Dynatrace Managed release notes version 1.184
New features and enhancements
Product news
- Multidimensional analysis 2.0: Analyze microservice-based metrics without code changes (Part 2)
Welcome back to the blog series in which we share how you can use multidimensional analysis (MDA) to easily analyze, chart, and report on any kind of data that's available within your microservices.
- Additional security for Synthetic monitor credentials with the new credential vault
With Dynatrace Synthetic Monitoring, you can easily monitor the availability and performance of your applications as experienced by your customers around the world and around the clock. Your applications usually require authentication and authorization (user ID, password, token, or certificate) as part of the business-critical path you wish to monitor (using private or public monitors). […]
- Easily handle proxy configurations in your private browser monitors with Proxy Auto-Configuration (PAC) file support
Private Synthetic locations allow you to monitor internal applications from inside your private network infrastructure. In such a setup, you often need to deal with some kind of proxy configuration. To handle complex proxy configurations, as of Dynatrace and ActiveGate versions 1.183, private browser monitors now also support Proxy Auto-Configuration (PAC) files. What is a […]
- Multidimensional analysis 2.0: Analyze, chart, and report on microservice-based metrics without code changes
Application and transaction-driven KPIs are at the heart of any successful business. Well-defined metrics for your applications and microservices are also at the heart of any technical analysis.
- Easily check configuration changes or environment sign ins with the new Audit logs API
Transparency and traceability of configuration changes are key to enabling multiple teams to collaborate effectively. Audit logs are crucial for tracking changes and security-relevant events. Until now, audit logs were only available to Dynatrace Managed customers.
Product news
- Automate your monitoring orchestration with the new Environment API (Early Adopter)
With the newly released Environment API, you can easily tie Dynatrace into your self-service pipeline and automate your monitoring orchestration.
- Ensure great customer experience on your mobile app by monitoring key user actions
From their favorite retailer to their favorite restaurant, today’s customers place great value on every interaction they have with a brand. Consequently, each interaction they have with your mobile app is a make-or-break opportunity for your business to drive lasting customer loyalty. But how do you ensure that your mobile app is not only working […]
- Understand customer experience with Session Replay without compromising data privacy
We've developed Session Replay with data privacy regulations and laws in mind, including GDPR (in Europe), California Consumer Privacy Act (CCPA), and Brazilian General Data Protection Law (LGPD).
- Get scheduled reports on data that matters to you most by subscribing to dashboards (EA)
Effective monitoring calls for effective reporting. With dashboard subscriptions and scheduled reports, available as an Early Adopter release with version 1.184, Dynatrace now makes your life substantially easier. Turn powerful Dynatrace dashboards into custom reports with just two clicks Dynatrace dashboards support a variety of chart visualizations and tiles. Custom charts allow you to visualize […]
- Additional IP addresses for public alert notifications (customer action required)
Alerting is a crucial aspect of monitoring your web application. Alerts warn you when your web application doesn't meet performance standards so you can respond quickly and fix the issue. To scale up and further guarantee the delivery of all your Dynatrace alerts, we're adding new public IP addresses.
Automated cluster extension with feedback
Our new Cluster node REST API endpoints dedicated for cluster management assist cluster administrators in setting up automation around bootstrapping a new cluster or extending cluster size. Adding a new cluster node is a blocking operation, so no other node can join the cluster at the same time. In large deployments, this operation is time-consuming and can take up to a couple of days. Previously, to check if the operation was finished, a cluster administrator could use a nodetool script to observe data synchronization in Cassandra databases. The new REST API is a robust alternative solution that can be easily incorporated into scripts or CI/CD pipelines. See the Cluster Management REST API specification for details on path and payload.

Provide Dynatrace Managed as a service to your teams (Early Adopter release)
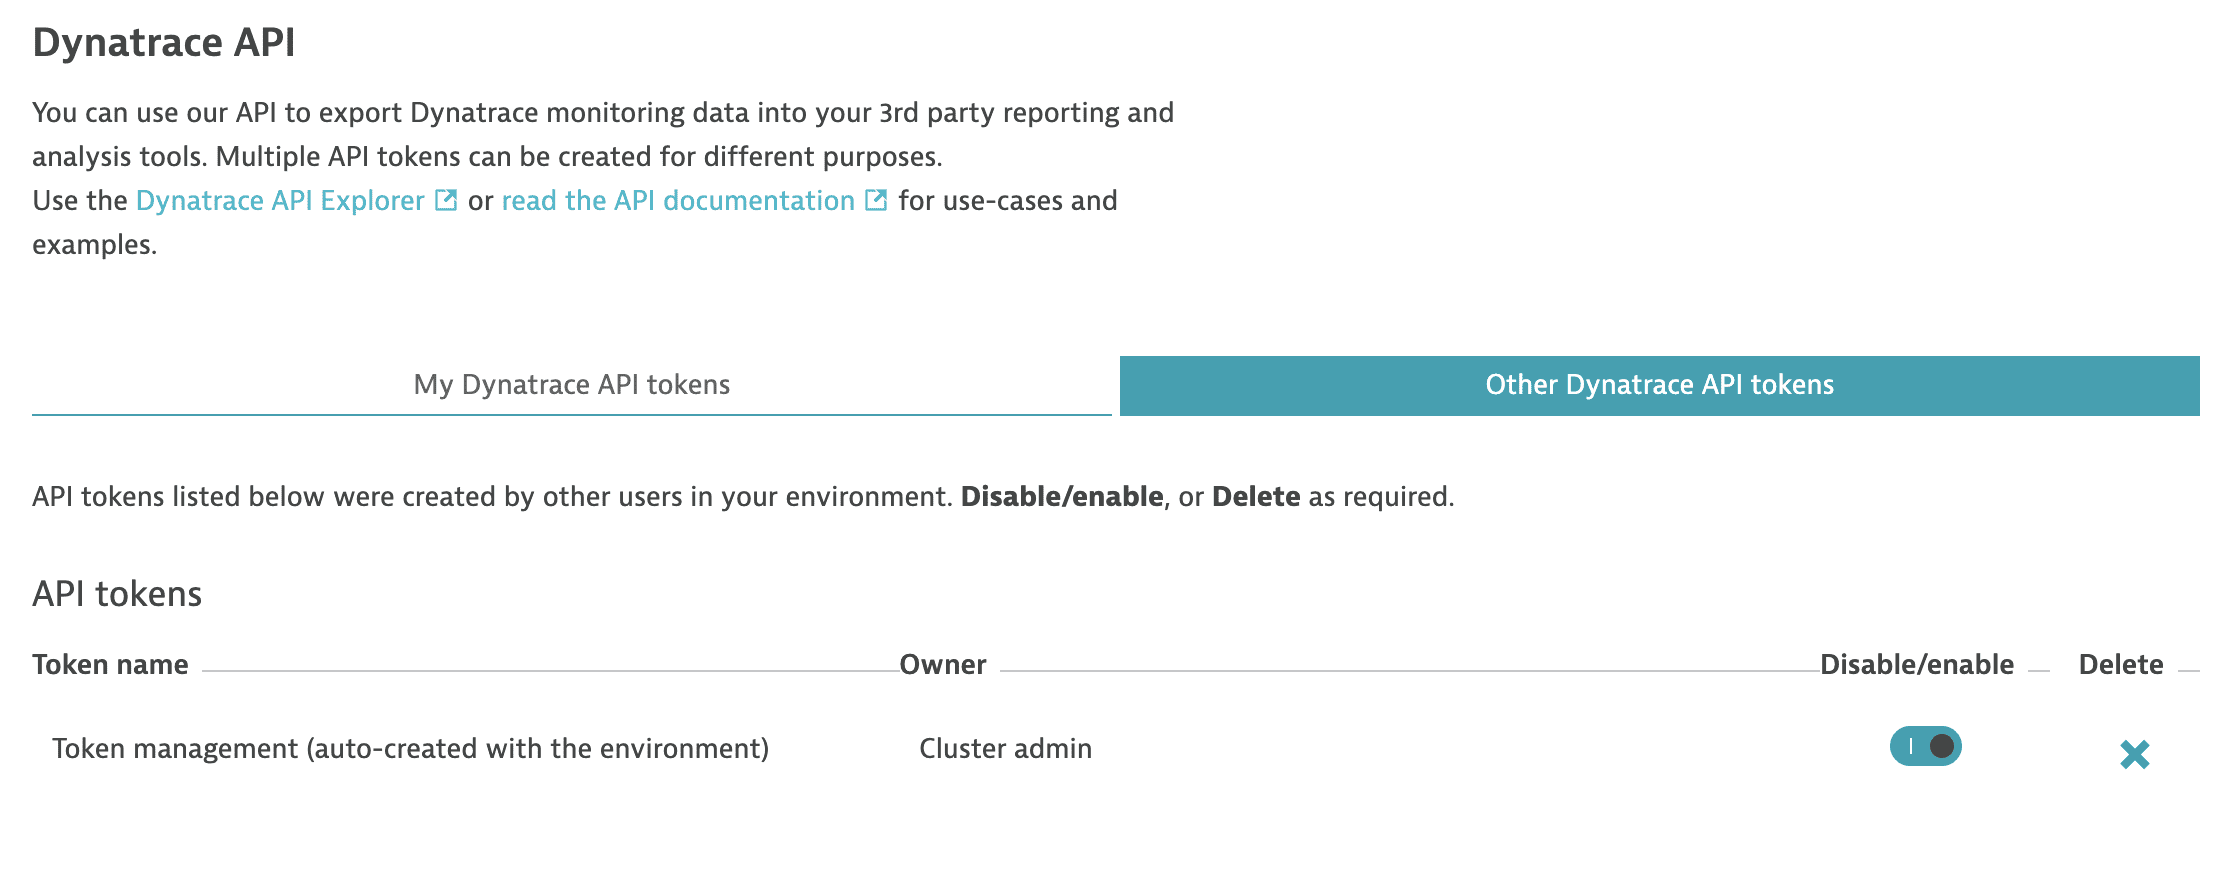
Our new Environments REST endpoint assists administrators who need to provision Dynatrace environments to other teams at scale. Until now, the process was cumbersome as it required administrators to manually create an environment and a token for further configuration. By providing automation via a new endpoint from the Cluster API, it's possible to deliver configuration-as-code, unified dashboarding, service naming conventions, and much more with minimal effort. To get started, you need to create a Service Provider API token in the Cluster Management Console. To get the interface details, use the Dynatrace API Explorer, which is available from the user menu under Cluster Management API. Select the Cluster API definition:
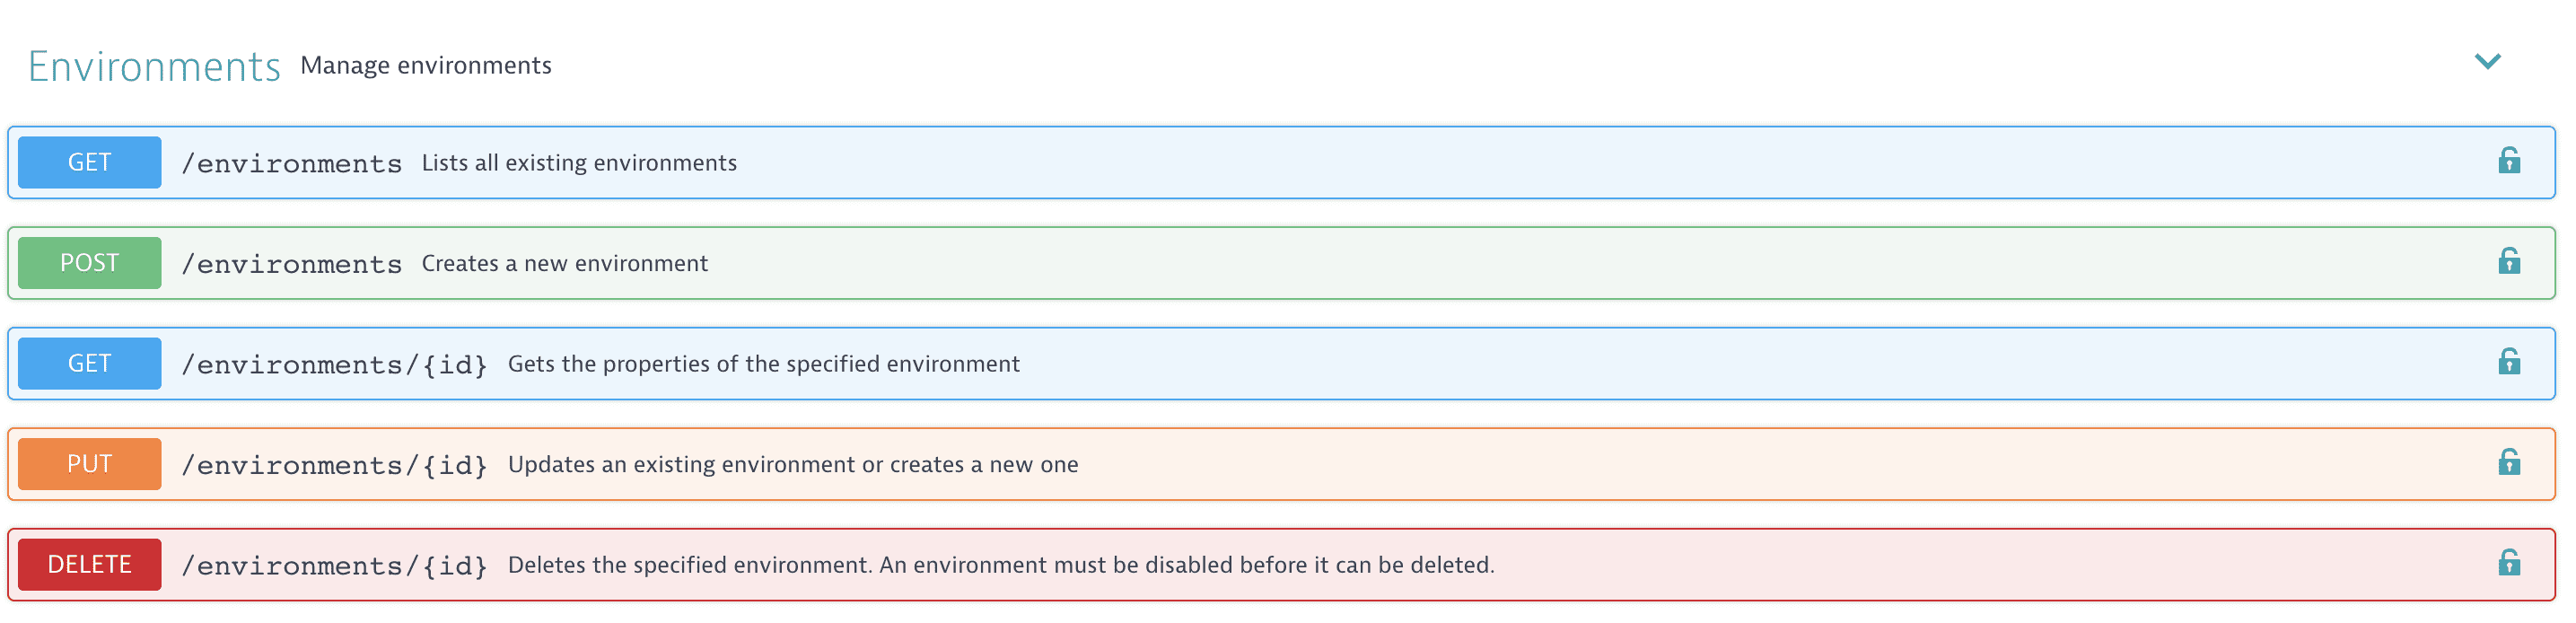
To create a new environment, use the POST method combined with the createToken=true query parameter in order to get an environment-level token in response.
Once you have this, you can continue with the Environment API or Configuration API to orchestrate the environment. An upcoming blog post will describe in detail how you can utilize the API to build powerful, manageable, and high-value environments for your teams. Note, the new REST API is still in the Early Adopter release stage and enabled by default.
Other changes
The JRE was updated to version 8u232 to take advantage of the latest security-vulnerability enhancements and bug fixes.
Resolved issues
Dynatrace Managed General Availability (Build .184)
The Dynatrace Managed .184 GA release contains 3 resolved issues.
| Component | Resolved issues |
|---|---|
| ON-PREM | 2 |
| ON-PREM Console | 1 |
ON-PREM
- Read only user profile screen sometimes displays changes confirmation dialog (caused by password manager). (APM-205150)
- Offline cluster tries to initialize online license during first startup. (APM-209624)
ON-PREM Console
- Some community users were not assigned to any account, thus were not able to see jira support tickets created by other users from their organization. (APM-206568)
Dynatrace SaaS General Availability (Build .183)
The Dynatrace SaaS .183 GA release contains 14 resolved issues.
| Component | Resolved issues |
|---|---|
| Code-Level | 2 |
| Cluster | 5 |
| Core UI | 6 |
| User Interface | 1 |
Code-Level
- Request naming preview not working for client side only service calls. (APM-208319)
- Request naming rules for URLs starting with username@password do not work. (APM-208914)
Cluster
- Icon for processes requiring restart on Technology Overview page is now consistent with process list on host dashboard. If agent is injected a gray info icon is shown. If agent is not injected a yellow warning icon is shown. (APM-207533)
- Filtering was not working, when user picked a filter being on different page than first one AND the filter only returned one page. Now when currently selected page doesn't exist after filtering, user will be moved to the last existing page. (APM-208327)
- Db Insights Oracle: It was not possible to find process group instance related to monitored database when Oracle process groups were splitted by host group. In this case all data from monitored database were reported to a separate custom device. (APM-204300)
- Enable USQL queries with combinations of PERCENTILE and FILTER. (APM-209178)
- Fixed and issues where some entities were not correctly displayed in the auto tagging preview although they were tagged correctly. (APM-206399)
Core UI
- Page ribbon resizes now correctly on dynamic content screens. (APM-202401)
- Fixed the font color of disabled elements on dark theme pages. (APM-203317)
- Fixed the wrong font color of the deployment achievement header element. (APM-205334)
- Events card's infobox is now correctly positioned. (APM-205917)
- Fixed an additional minute added to the chosen custom timeframe in some cases. (APM-208326)
- Events card resizes now correctly after a viewport resize. (APM-207893)
User Interface
- Fixes an issue that breaks the Kubernetes dashboard when the requested resources are higher than the available ones. (APM-207819)
Dynatrace SaaS General Availability (Build .184)
The Dynatrace SaaS .184 GA release contains 14 resolved issues.
| Component | Resolved issues |
|---|---|
| Code-Level | 1 |
| Cluster | 9 |
| Core UI | 3 |
| Log Analytics | 1 |
Code-Level
- For a given list of request naming rules it is now guaranteed that always the first completely matching rules renames the request. (APM-211692)
Cluster
- Fixed presenting wrong data (from previously visited host) in System Load and Physical CPU headers on Host's details screen. (APM-208952)
- Fix incorrect number of AWS Supporting services with problems on AWS dashboard's infographic. (APM-211212)
- Affected entities are now correctly counted in Network Overview's environment details. (APM-211296)
- Memory usage merging for restarted processes for PaaS hosts on host list is limited to 1000 processes. (APM-216884)
- Fixed missing Network Interfaces in Network Overview with applied Management Zone. (APM-217385)
- Enable USQL queries with combinations of PERCENTILE and FILTER. (APM-209178)
- Screens may fail to load on a Managed Environment when internal network requests are very slow. (APM-210777)
- Enable table USERERROR when using REST API to execute USQL queries. (APM-210805)
- During the update from Sprint 183 to Sprint 184 it was possible in rare cases that internal migration code caused an endless loop which consumed all webserver threads in the thread pool causing a server becoming unresponsive. (APM-217530)
Core UI
- Fixed tiles with a custom timeframe not being refreshed. (APM-210133)
- Fixed an issue when the management zone selector was not visible for users with tenant permissions. (APM-210254)
- Fixed issue when switching the timeframe from last 24 hours to previous and next 24 hours at midnight led to a last 5 minutes time frame. (APM-211028)
Log Analytics
- Improved validation of search queries in Log Viewer. (APM-207256)