Welcome back to the blog series in which we share how you can use multidimensional analysis (MDA) to easily analyze, chart, and report on any kind of data that's available within your microservices.
In Part 1 of this blog series, we presented a few Dynatrace customer use cases for multidimensional analysis. For example, we presented how a multinational travel agency uses MDA to diagnose error rates per loyalty status to make sure that their premium customers have a perfect software experience.
In this post, we’ll give you a more detailed walk-through of this functionality by discussing this specific business use case in detail.
Ensure perfect user experience by diagnosing service issues per loyalty status
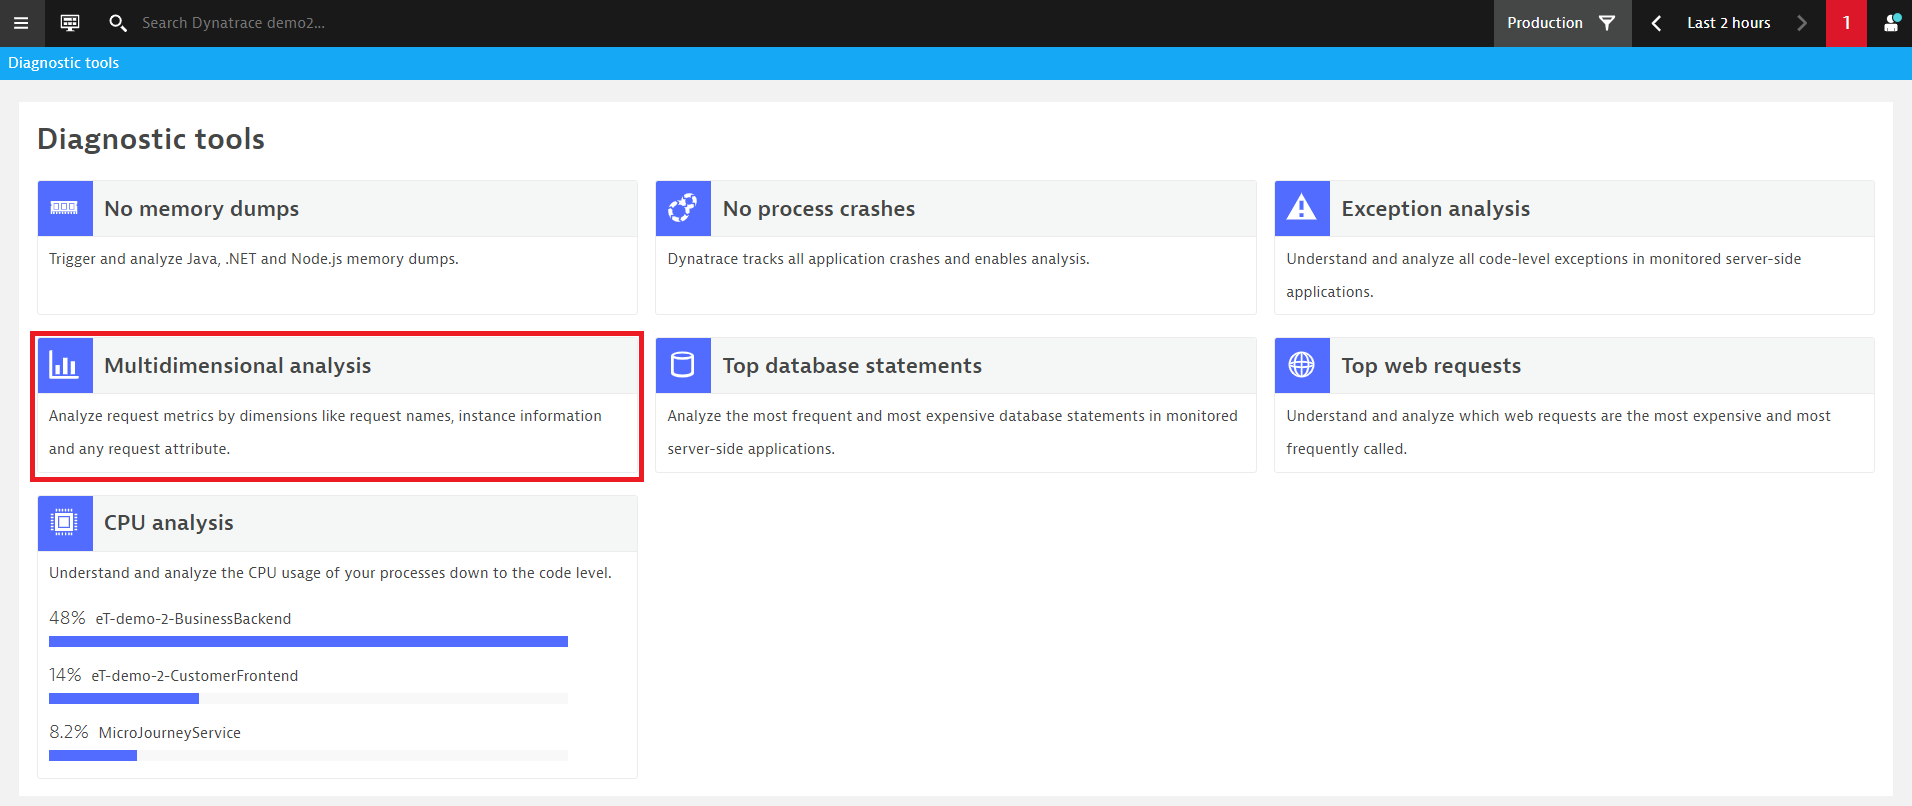
As the owner of a travel booking application, you might want to find out how a specific customer segment experiences your application. To start your analysis, select Diagnostic tools from the navigation menu and select Multidimensional analysis.
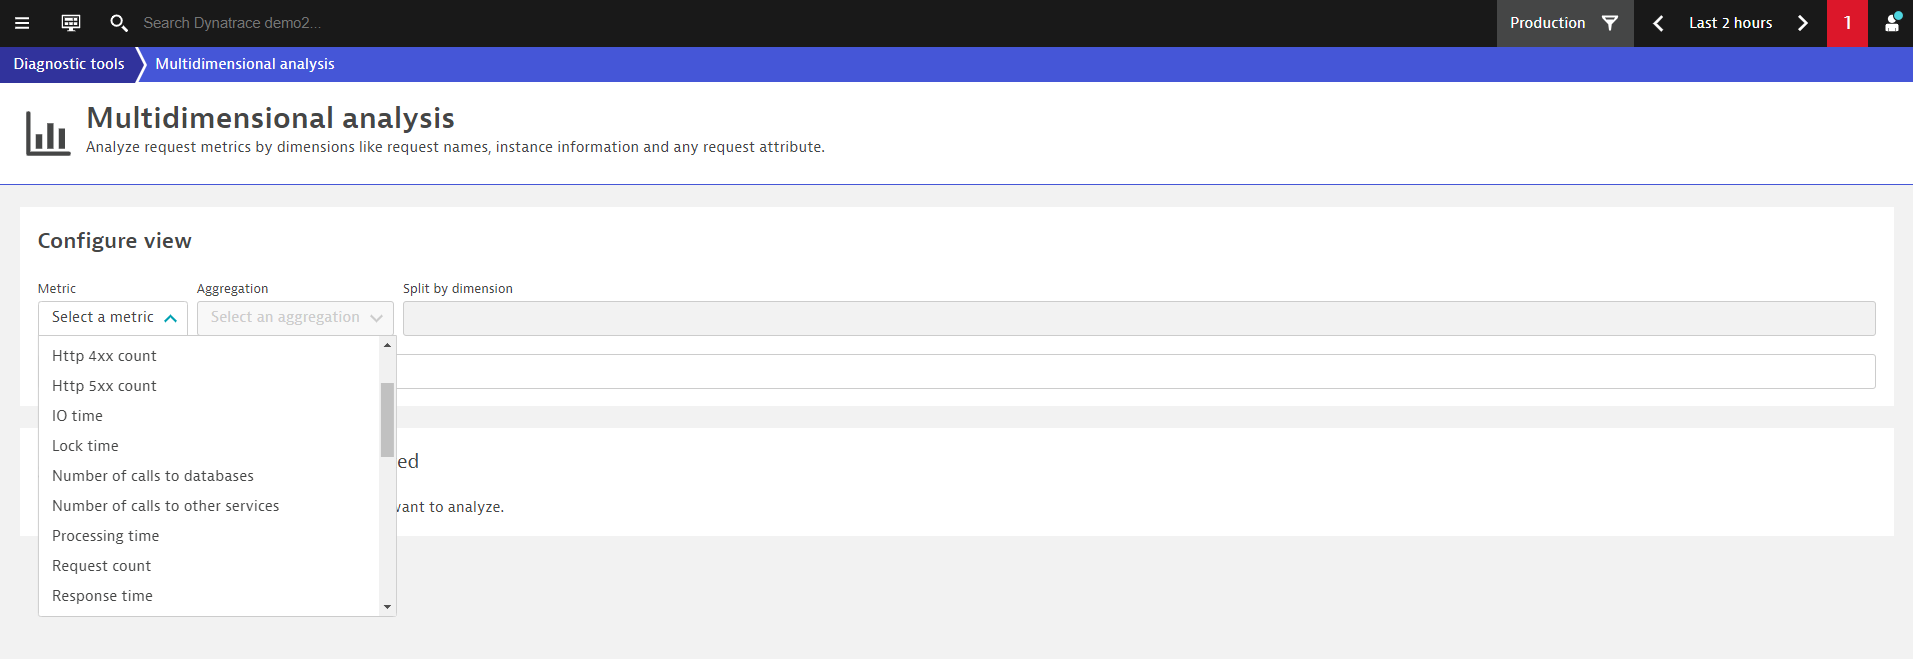
Select a Metric and Aggregation to get started. You can choose any standard Dynatrace metric and any request attribute. You can also split the results by any request attribute as well as filter based on topology, request property, failure state, timing, or other factors.
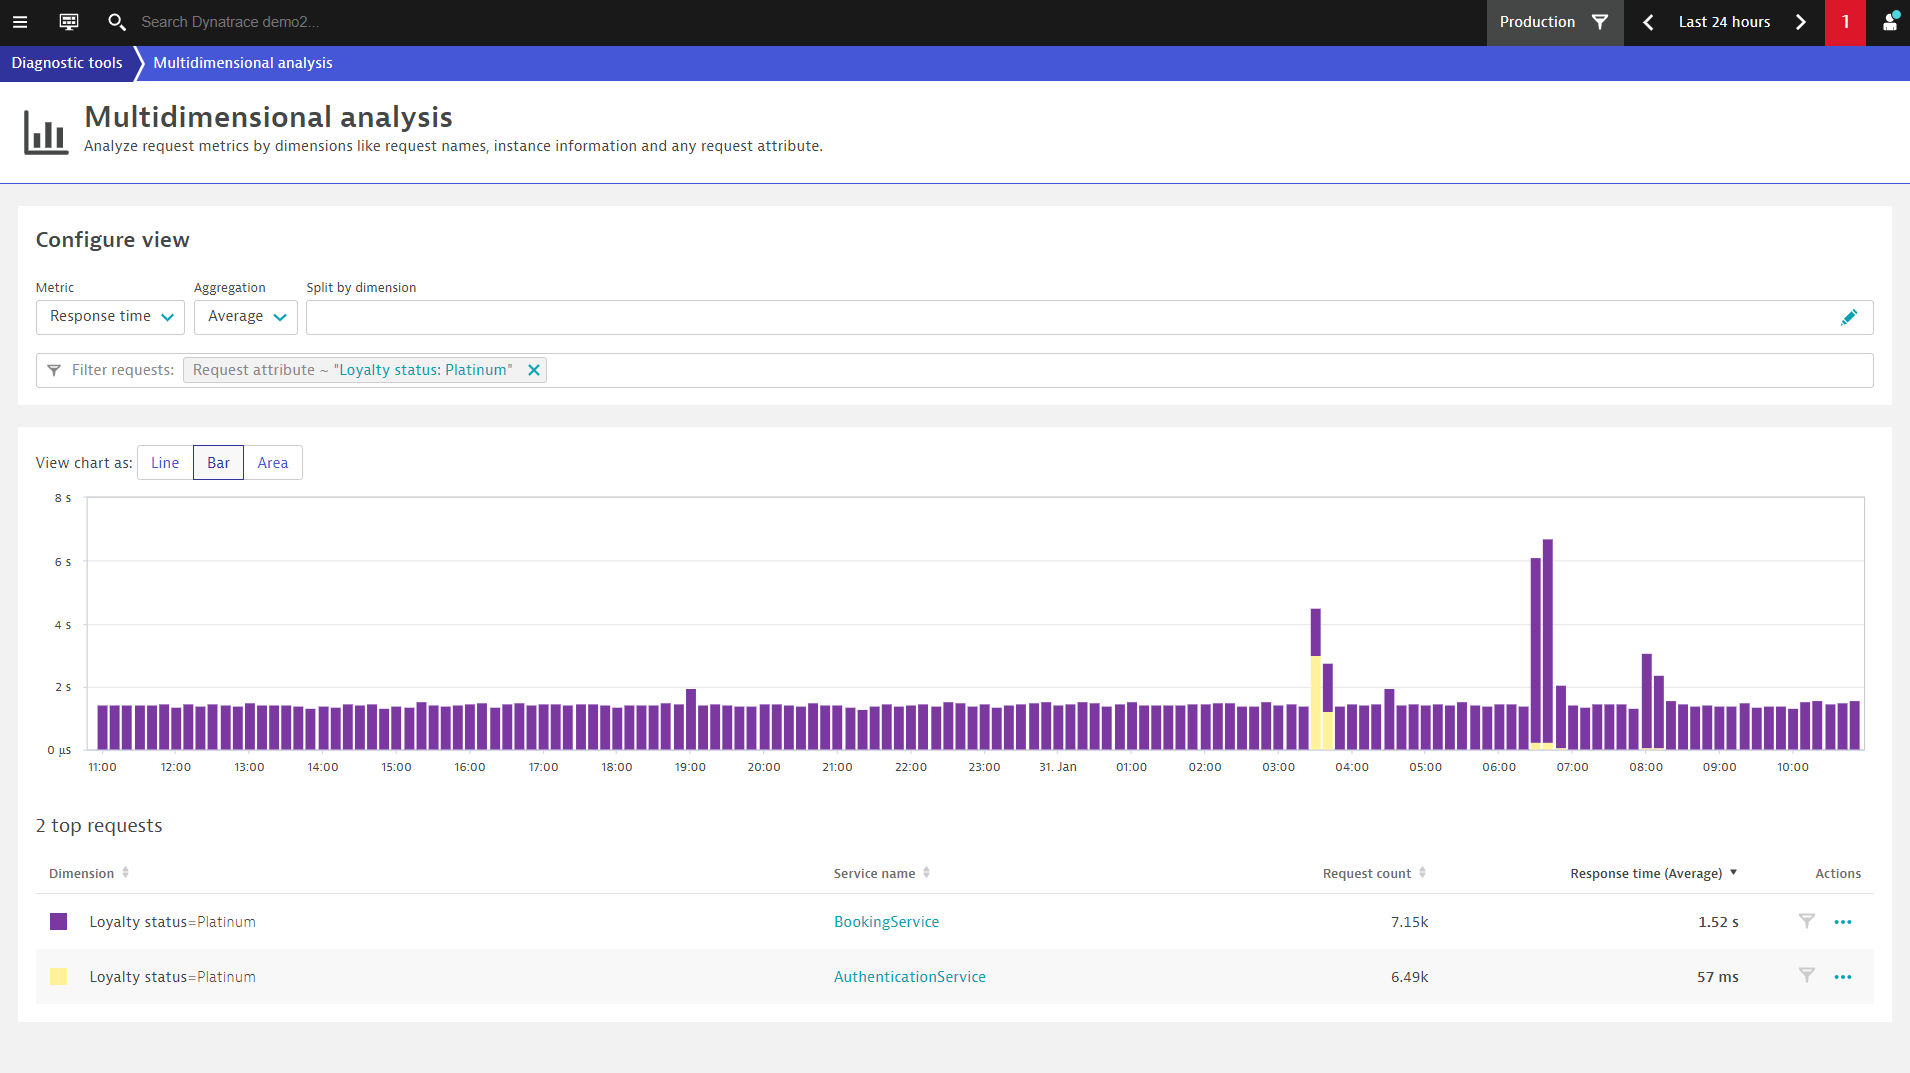
To see how your platinum loyalty-status customers experience your application, you might first want to analyze the response times of the calls to your microservices. To do this, select the Response time metric, and filter the results based on Platinum status, as shown below:
The results above show that while your platinum customers can log into your application pretty quickly (the response time of AuthenticationService is 57 ms), they need to wait relatively longer when booking a trip (the response time of BookingService is 1.52 s).
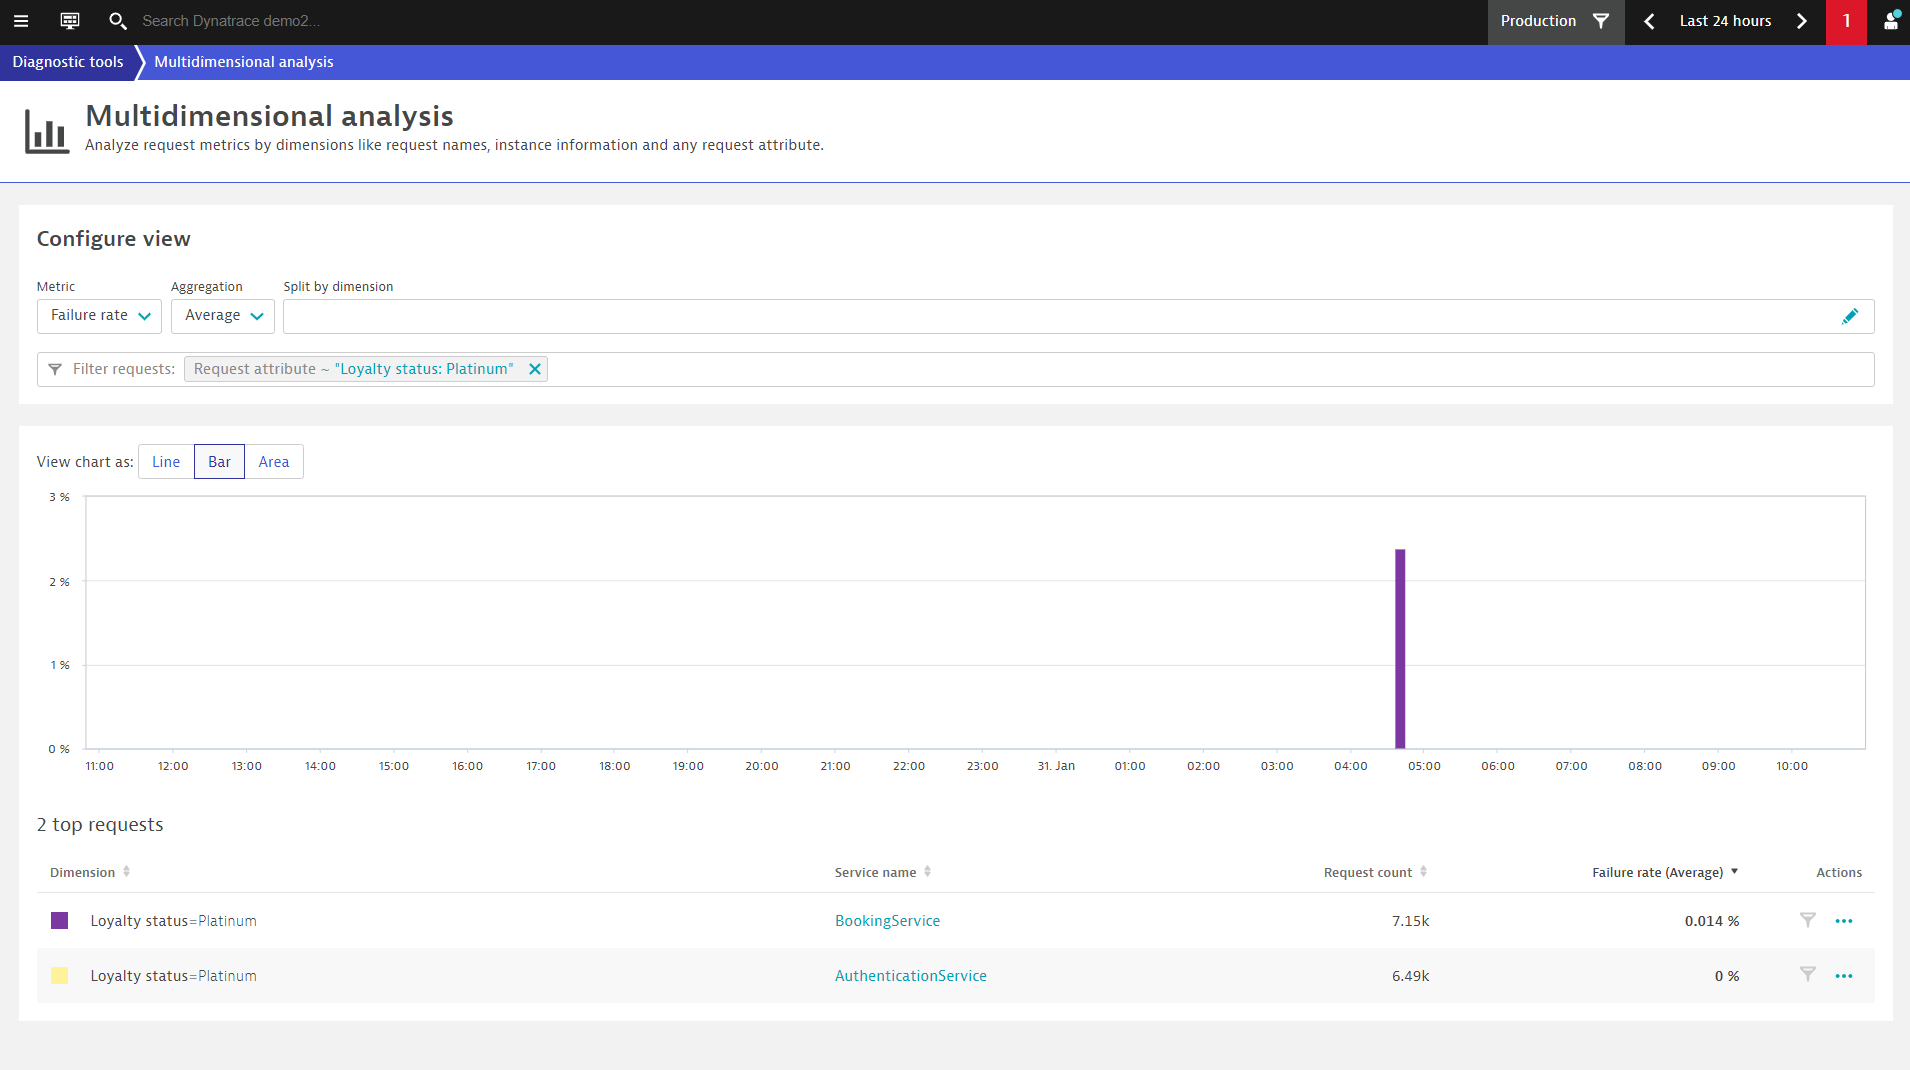
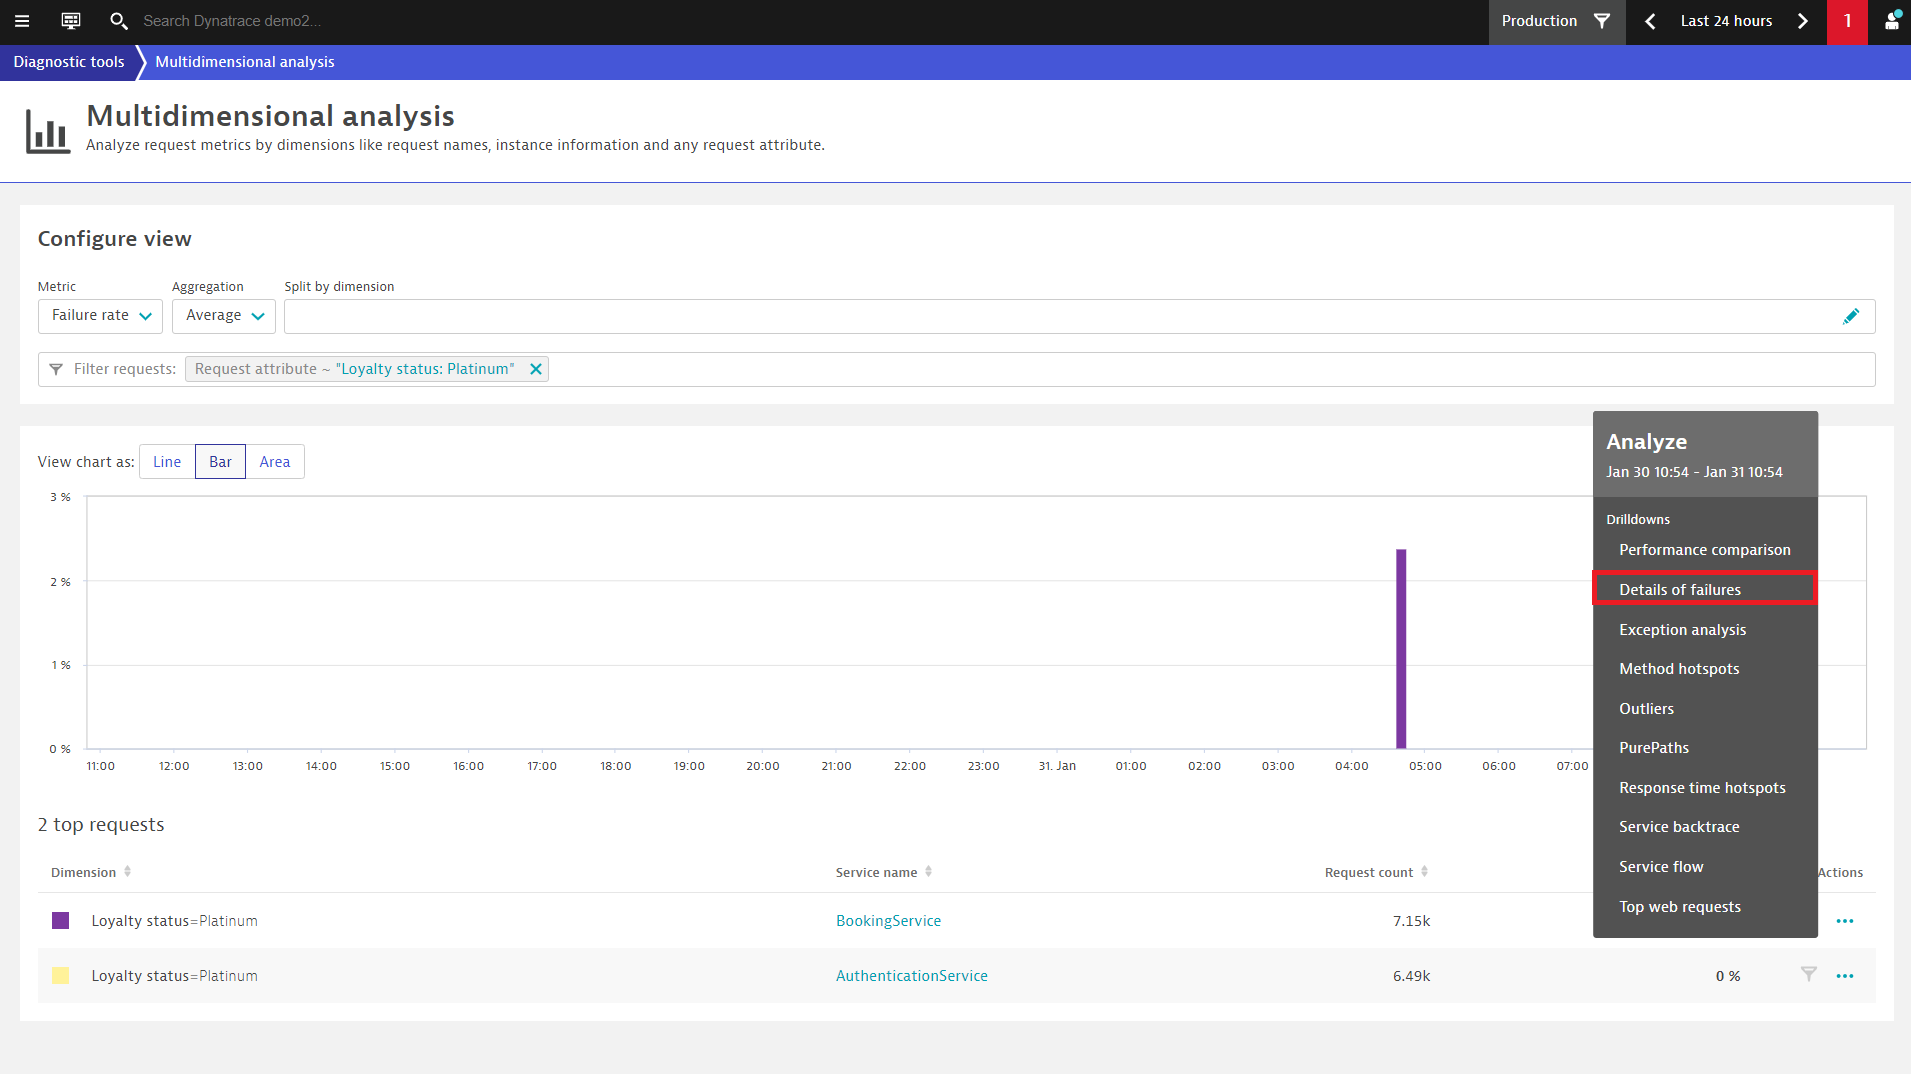
You might guess that the relatively long booking time is caused by a failure. Simply switch the metric to Failure rate to find out if there was an error that might have impacted your platinum customers.
The image above confirms that the relatively long booking time is in fact caused by a failure. Dynatrace found what might seem like a relatively insignificant failure—during the previous night, between 4:00 and 5:00 AM, some of your platinum customers were unable to book trips.
To find out what exactly happened, open the Analyze menu (…) to the right of BookingService in the Actions column. This menu provides you with a huge variety of options for deeply analyzing the service in question: failure details, method hotspots, service backtrace, service flow, and more. For this example, we’ll choose Details of failures.
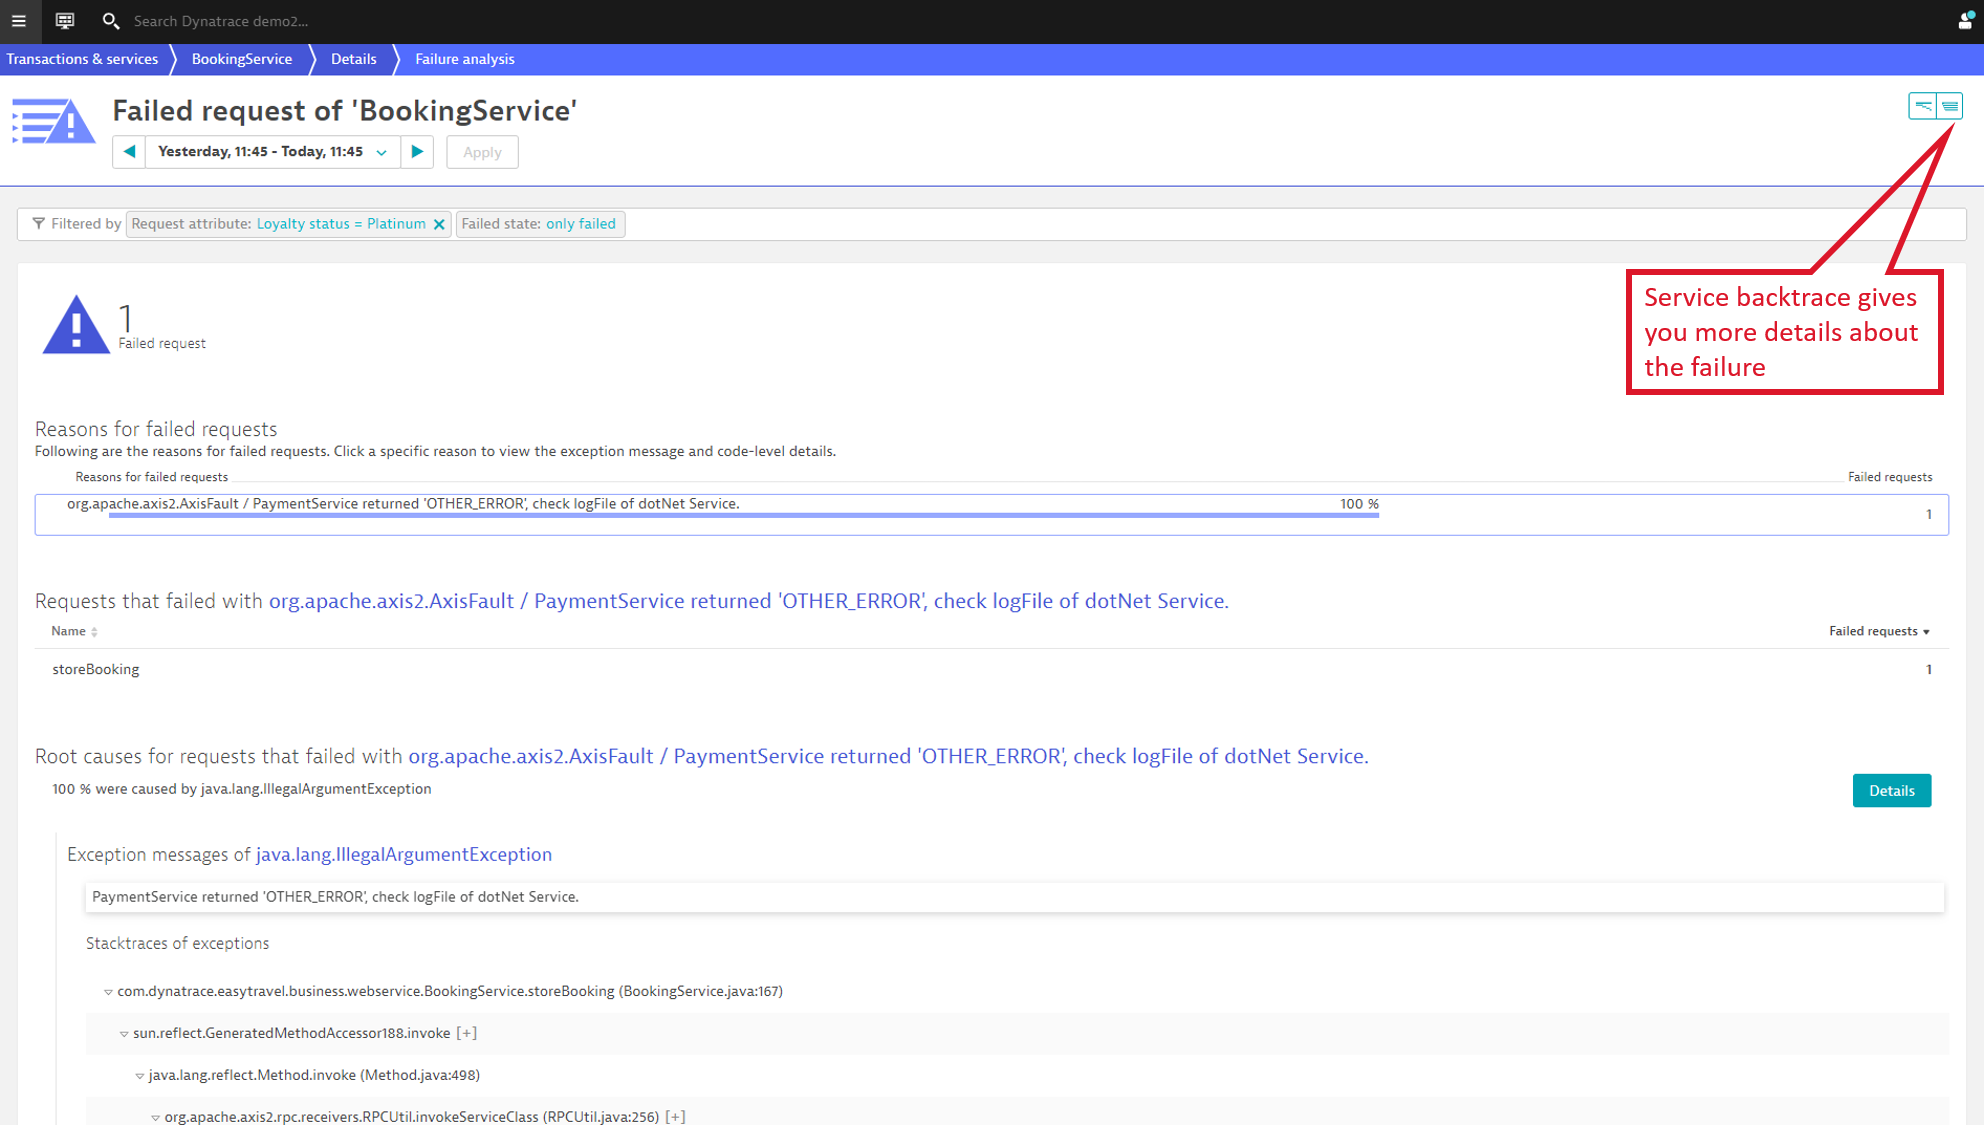
Now you can see the exact technical reasons for the failure: the payment service (PaymentService) that should have approved the booking failed to respond. With this knowledge, you can now contact the team that works on the payment service and ask them to resolve the issue.
Hint: To simplify the process of sharing your analysis with team members, you can copy and share the page URL with your payment service team. Dynatrace saves all multidimensional analyses, so you can use them at scale. You can share URLs with any colleague who has Dynatrace access, or bookmark them to return to them later.
As a final step, you might want to know exactly which application and user session were impacted by the failure. To find out, select the Backtrace button at the top-right corner of the Failure analysis page (see below).
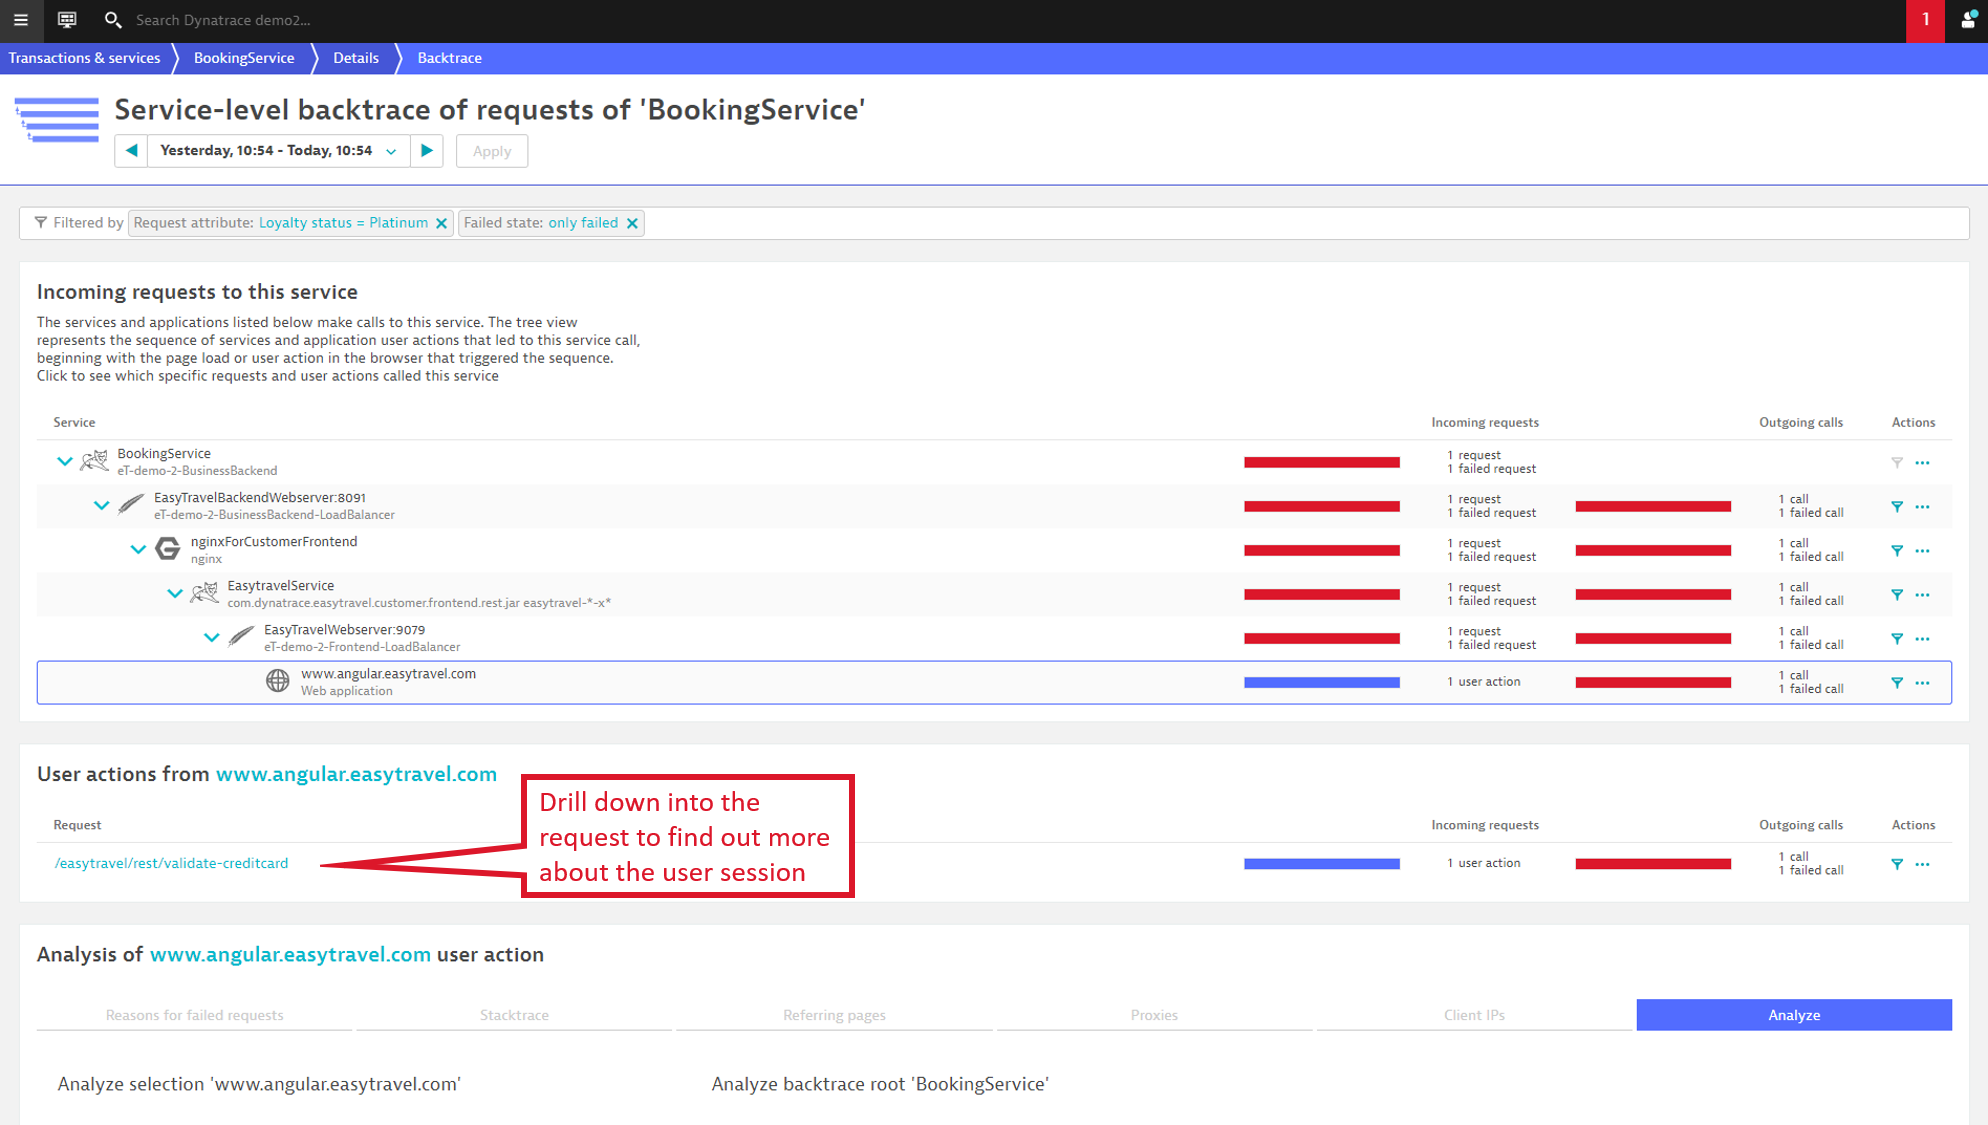
The Service-level backtrace page (see below) reveals the application that was impacted by the failed call. In this case it was the www.angular.easytravel.com application.
Also, if you click on the failed request in the User actions section, Dynatrace Real User Monitoring will show exactly which user session was impacted, so you know which customer you need to send a voucher to to let them know you value their business.
What’s next
With multidimensional analysis, you have a nearly limitless range of options for analyzing, charting, and reporting on your most important KPIs. The example presented above is just one of the many examples of how our customers can benefit from multidimensional analysis. Currently, you can perform multidimensional analysis on up to 100 services at a time, and we’re working hard to extend this in the near future.
And, as we’ve combined this functionality with the Calculated metrics feature, you now have even more options!
Stay tuned for Part 3 of this blog series in which you’ll learn how to:
- Create custom metrics and be alerted on them by pinning them to your Dynatrace dashboard with a single click.
- Expose custom metrics via the Dynatrace API to extend automation along your delivery pipeline.
- Enable Dynatrace Davis® AI to seamlessly and automatically analyze your custom metrics in the root-cause analysis of detected problems.



Looking for answers?
Start a new discussion or ask for help in our Q&A forum.
Go to forum