Log Monitoring Classic
With Log Monitoring as a part of the Dynatrace platform, you gain direct access to the log content of all your mission-critical applications, infrastructure and cloud platforms. You can create custom log metrics for smarter and faster troubleshooting. You will be able to understand log data in the context of your full stack, including real user impacts.
Log Monitoring Classic is available for SaaS and managed deployments. For the latest Dynatrace log offering on SaaS, Upgrade to Log Management and Analytics.
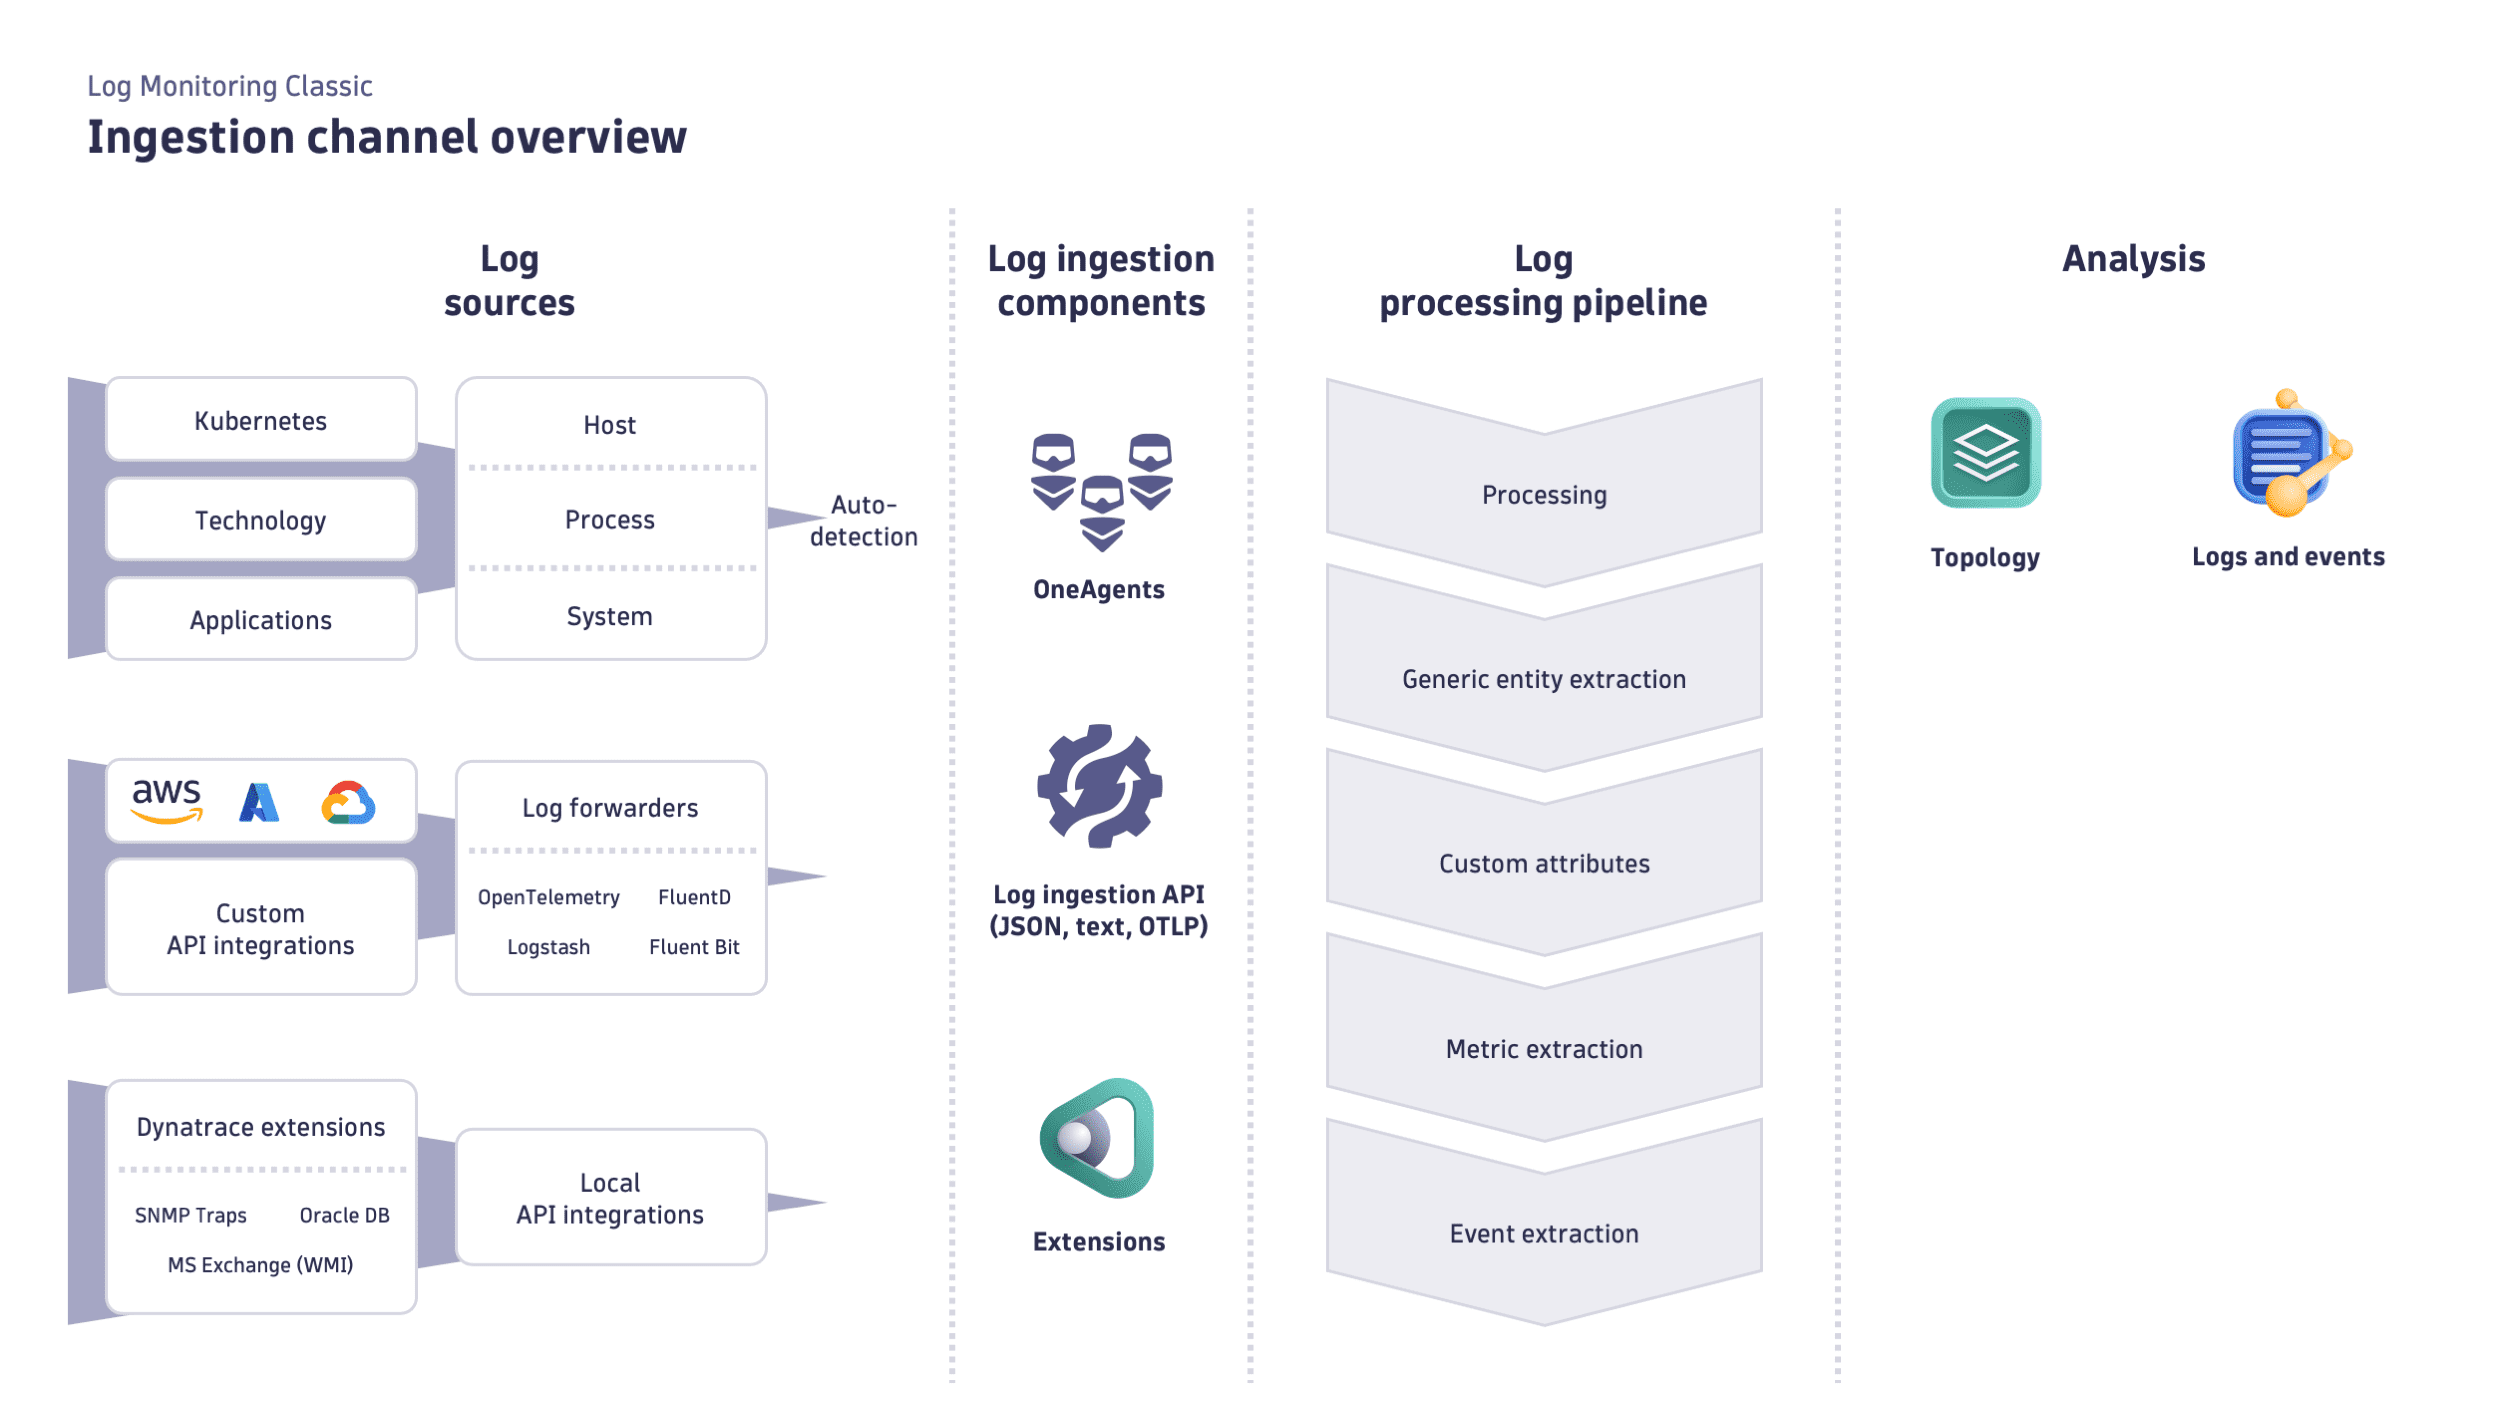
Ingest & Processing
Set up automatic log collection, and extract value with Log Processing.
Analysis
Analyze significant log events across multiple logs, across parts of the environment (production), and potentially over a longer timeframe.
Alerting
Define patterns, events, and custom log metrics to receive proactive notifications.
API
Use the Dynatrace API to send log data to Dynatrace and quickly search, aggregate, or export the log content.