Instrument mobile apps with Dynatrace Xamarin NuGet package
The Dynatrace Xamarin NuGet package helps auto-instrument your Xamarin app with OneAgent for Android and iOS as well as provides an API for manual instrumentation. The package is compatible with Xamarin.iOS, Xamarin.Android, and Xamarin.Forms projects.
On May 1, 2024, Microsoft will end support for all Xamarin SDKs. For this reason, we're deprecating the Dynatrace Xamarin NuGet package in May 2024. We will let you know in which upcoming package version we will be only fixing bugs and addressing important security issues.
Also, in accordance with the Dynatrace Support Policy, we will end support for the Dynatrace Xamarin NuGet package in May 2025.
We recommend that you upgrade your Xamarin projects to .NET and use the Dynatrace .NET MAUI NuGet package instead of the deprecated Xamarin NuGet package.
Supported features
Auto-instrumentation
User actions
Lifecycle events
Web requests
Crashes
Manual instrumentation
Custom actions
Web requests
Values
Events
Errors
Crashes
User tagging
Requirements
- For Android:
Android version 5.0+ (API 21+)
Xamarin.Android SDK version 10.1.x+
- For iOS: iOS version 12+
- For Xamarin.Forms: .NET Standard version 2.0+
Set up the package
Perform the following steps to set up the Dynatrace Xamarin NuGet package for your Xamarin app.
Install the Dynatrace Xamarin NuGet package

Create an application and get the config file

Add the config file to your project

Add the OneAgent start method

Xamarin.Forms only
Set up Xamarin.Forms DependencyService

Enable automatic web request instrumentation

Install the NuGet package
Add the Dynatrace Xamarin NuGet package to all the required projects.
- In Visual Studio, right-click the main project of your app and select Manage NuGet packages.
- Find Dynatrace.OneAgent.Xamarin from nuget.org and select Add Package.
Select the checkboxes of all the projects to which you want to add the NuGet package.
- Select OK.
Create an application and get the config file
Create a new mobile application in Dynatrace and download the configuration file.
- In Dynatrace, go to Mobile.
- Select Create mobile app.
- Enter a name for your application and select Create mobile app. The application settings page opens.
- From the application settings, select Instrumentation wizard > Xamarin.
- Under step 2, select Download dynatrace.config.json to get the configuration file.
Add the config file to your project
Add the dynatrace.config.json file, which you downloaded in the previous step, to your project.
Add the OneAgent start method
The start method is required for OneAgent to start.
Set up Xamarin.Forms DependencyService
Xamarin.Forms only
This instruction is for Xamarin.Forms versions 4.7.0+, which use RegisterSingleton. For earlier Xamarin.Forms versions, see the instruction below.
Register the interface at startup in the native part of your Xamarin.Forms application, and paste the following code right after Forms.Init().
The following example is for an Android Forms application:
using Dynatrace.Xamarin;Xamarin.Essentials.Platform.Init(this, savedInstanceState);global::Xamarin.Forms.Forms.Init(this, savedInstanceState);Xamarin.Forms.DependencyService.RegisterSingleton<IDynatrace>(Agent.Instance);LoadApplication(new App());
The following code in your Xamarin.Forms application allows you to access OneAgent:
using Dynatrace.Xamarin;IDynatrace dynatrace = DependencyService.Get<IDynatrace>();
In case of auto-instrumentation, you also need to apply the Dynatrace Xamarin NuGet package to the native parts of your application.
If you can't use DependencyService.RegisterSingleton as your Xamarin.Forms version is 4.6.0 or earlier, there is a workaround. The following code snippet shows how this works for Xamarin.Forms and Android, but you can easily apply it to iOS as well.
The App.xaml.cs file in the Xamarin.Forms part:
public partial class App : Application{static readonly Dictionary<Type, Func<object, object>> factories = new Dictionary<Type, Func<object, object>>();public App(){InitializeComponent();DependencyResolver.ResolveUsing((type, args) => factories.ContainsKey(type) ? factories[type].Invoke(args) : null);IDynatrace Dynatrace = DependencyService.Resolve<IDynatrace>();Dynatrace.Start(null);}public static void Register(Type type, Func<object, object> factory){factories[type] = factory;}...}
The Android part, where you have to call RegisterSingleton, should look like this:
public class MainActivity : global::Xamarin.Forms.Platform.Android.FormsAppCompatActivity{protected override void OnCreate(Bundle savedInstanceState){...Xamarin.Essentials.Platform.Init(this, savedInstanceState);global::Xamarin.Forms.Forms.Init(this, savedInstanceState);App.Register(typeof(IDynatrace), (o) => Agent.Instance);LoadApplication(new App());}...}
Enable automatic web request instrumentation optional
You can optionally use the following method to enable the auto-instrumentation of web requests. The HttpMessageHandler used by HttpClient takes care of the manual web request instrumentation.
using Dynatrace.Xamarin;var httpHandler = Agent.Instance.GetHttpMessageHandler();var httpClient = new HttpClient(httpHandler);
Moreover, you can also have your own HTTP handler:
using Dynatrace.Xamarin;var defaultHttpHandler = new HttpClientHandler();var httpHandler = Agent.Instance.GetHttpMessageHandler(defaultHttpHandler);var httpClient = new HttpClient(httpHandler);
Manual instrumentation
The sections below describe how to start OneAgent manually, create custom actions, instrument web requests, and report values, events, and crashes.
Start OneAgent
You can use the manual startup with a configuration builder (Android) or a configuration dictionary (iOS).
-
Modify the
dynatrace.config.jsonfile to disable OneAgent autostart.Don't add additional properties to the configuration file. If you do that, the build fails with an exception.
-
Start OneAgent manually and pass the required properties.
Create custom actions
You can create custom actions and enhance them with additional information such as values, events, and errors.
Call EnterAction to start a custom action and LeaveAction to close a custom action. Timing is measured automatically.
using Dynatrace.Xamarin;var myAction = Agent.Instance.EnterAction("Tap on Confirm");//Perform the action and whatever else is needed.myAction.LeaveAction();
For a mobile custom action or a mobile autogenerated user action, the maximum name length is 250 characters.
When the user opt-in mode is enabled for your application, it might affect user tagging and reporting of custom events, user actions, values, and errors. The exact data types not reported to Dynatrace depend on the data collection level set by a particular user. For details, refer to Data collection levels.
Create child actions
Besides generating standalone custom actions, you can also create child actions.
Child actions are similar to parent custom actions. When a parent action is closed, all child actions of the parent action are automatically closed.
using Dynatrace.Xamarin;var myAction = Agent.Instance.EnterAction("Tap on Confirm");var mySubAction = myAction.EnterAction("Tap on Confirm again");//Perform the action and whatever else is needed.mySubAction.LeaveAction();myAction.LeaveAction();
For a mobile custom action or a mobile autogenerated user action, the maximum name length is 250 characters.
There's no limit on the number of child actions attached to a custom action. However, note that you can have only one level of child actions—you can't create a child action for another child action (child actions can't have their own child actions). Also, refer to User session structure for individual user.
Child actions are not displayed on the user session details page, but you can view them on the waterfall analysis page for a custom action to which these child actions are attached.
Cancel custom actions
If you need to cancel an already created but not yet closed custom action, call Cancel. Canceling an action discards all data associated with it: all reported values, events, and errors are discarded; all child actions are canceled.
using Dynatrace.Xamarin;var myAction = Agent.Instance.EnterAction("Tap on Confirm");// Action is canceledmyAction.Cancel();
You can't cancel a closed action, so calling Cancel after LeaveAction is impossible for the same action. The same goes for closing a canceled action: you can't call LeaveAction after using Cancel for the same action.
Instrument web requests
Use the following code snippet to instrument web requests:
using Dynatrace.Xamarin;// Create an actionvar webAction = Agent.Instance.EnterAction(actionName: "WebRequest Action");// Generate a new unique tag associated with the web request actionstring requestTag = webAction.GetRequestTag(url);string requestTagHeader = webAction.GetRequestTagHeader();// Place the Dynatrace HTTP header on your web requesthttpClient.DefaultRequestHeaders.Add(requestTagHeader, requestTag);// Generate a WebRequestTiming object based on the unique tagWebRequestTiming timing = (WebRequestTiming)Agent.Instance.GetWebRequestTiming(requestTag, url);// Start web request timing before the HTTP request is senttiming.StartWebRequestTiming();try{var response = await httpClient.GetAsync(url);// Stop web request timing when the HTTP response is received and the response body is obtainedtiming.StopWebRequestTiming(url, (int)response.StatusCode, response.ReasonPhrase);}catch (HttpRequestException exception){// Stop web request timing when a connection exception occurstiming.StopWebRequestTiming(url, -1, exception.ToString());}finally{// Leave an actionwebAction.LeaveAction();}
Report a value
The reportValue method allows you to report key-value pairs of metadata that you can later view in the Dynatrace web UI and convert into user action and user session properties. The reported values must be part of a user action.
You can report values of the following data types:
intdoublestring
ReportValue(valueName: string, value: int);ReportValue(valueName: string, value: double);ReportValue(valueName: string, value: string);
For instance, to report a string value within the Tap on Confirm action, use the following code:
using Dynatrace.Xamarin;var myAction = Agent.Instance.EnterAction("Tap on Confirm");myAction.ReportValue("Customer type", "Gold");myAction.LeaveAction();
To view the reported values in the Dynatrace web UI, go to the details of the user action that should contain that metadata and scroll down to the Reported values section.
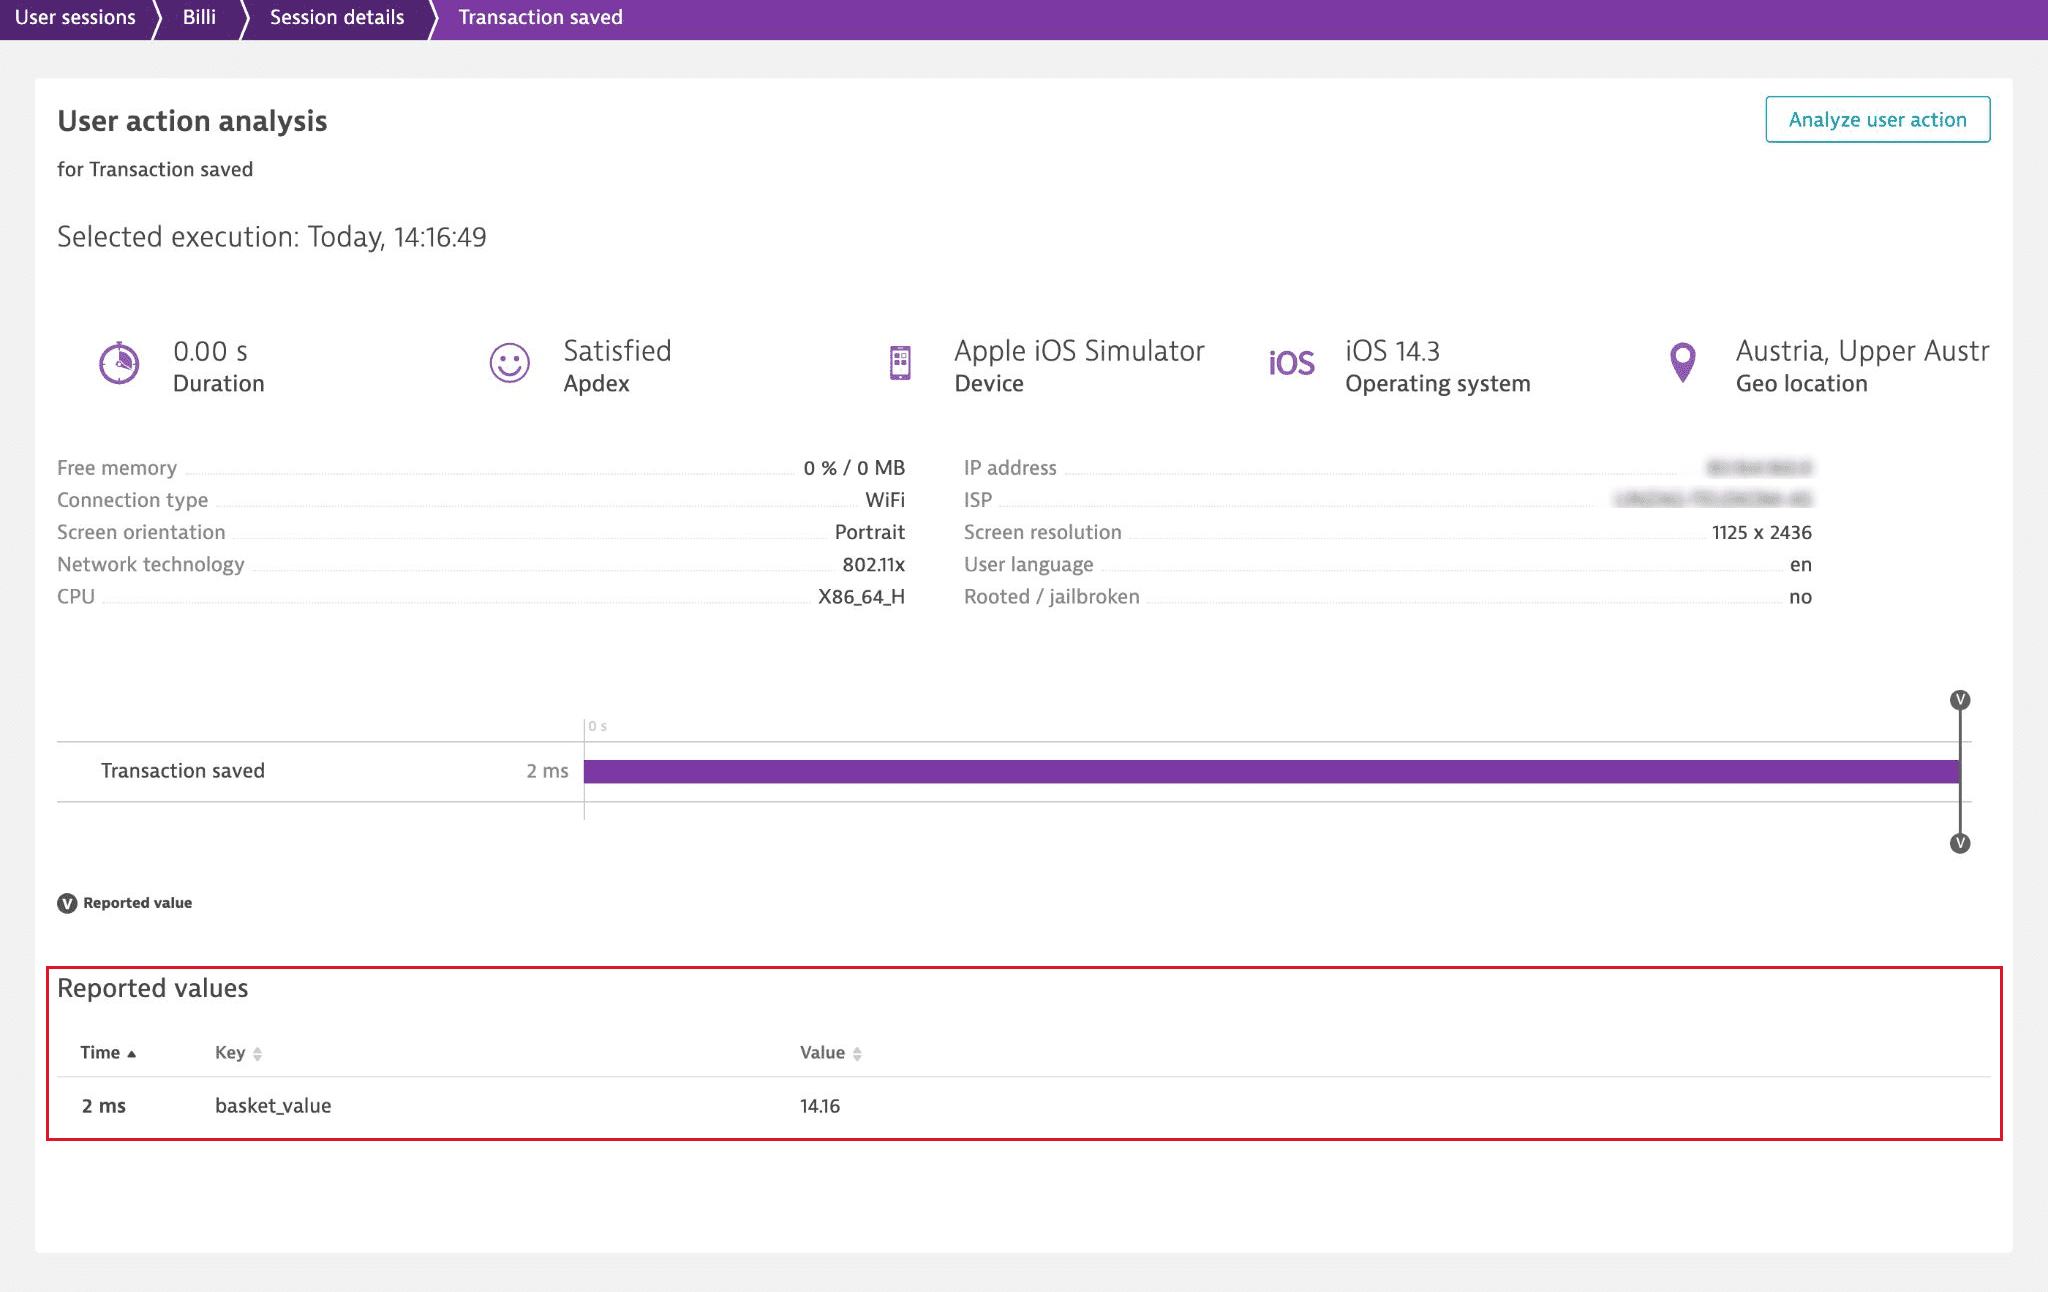
To add action and session properties based on the reported values and then use these properties to create powerful queries, segmentations, and aggregations, see Define user action and user session properties for mobile applications.
When the user opt-in mode is enabled for your application, it might affect user tagging and reporting of custom events, user actions, values, and errors. The exact data types not reported to Dynatrace depend on the data collection level set by a particular user. For details, refer to Data collection levels.
Report an event
For any open action, you can report an event. Use the following API call:
ReportEvent(eventName: string);
If you want to report standalone events with lots of additional information, see Report a business event.
When the user opt-in mode is enabled for your application, it might affect user tagging and reporting of custom events, user actions, values, and errors. The exact data types not reported to Dynatrace depend on the data collection level set by a particular user. For details, refer to Data collection levels.
Report an error
To report an error, use the ReportError method.
ReportError(errorName: string, errorCode: number);
When the user opt-in mode is enabled for your application, it might affect user tagging and reporting of custom events, user actions, values, and errors. The exact data types not reported to Dynatrace depend on the data collection level set by a particular user. For details, refer to Data collection levels.
Report an error stack trace
To report an error stack trace, use the following API call:
using Dynatrace.Xamarin;Agent.Instance.ReportErrorStacktrace("Error_Class", "Error_Value", "Error_Reason", "Error_Stacktrace");
Report a crash
To report a crash, use the following API call.
using Dynatrace.Xamarin;Agent.Instance.ReportCrash("CrashWithoutException", "Crash_Reason", "Crash_Stacktrace");
You can also use an exception object:
using Dynatrace.Xamarin;Agent.Instance.ReportCrashWithException("CrashWithExceptionObj", exception);
The time when the crash details are sent to Dynatrace depends on your mobile application operating system.
-
Android
In general, the crash details are sent immediately after the crash, so the user doesn’t have to relaunch the application. However, in some cases, the application should be reopened within 10 minutes so that the crash report is sent. Note that Dynatrace doesn't send crash reports that are older than 10 minutes (as such reports can no longer be correlated on the Dynatrace Cluster).
-
iOS
The crash details are sent only when the user reopens the mobile application (so on the next application launch). However, if the user doesn't open the application within 10 minutes, the crash report is deleted. This is because Dynatrace doesn't send crash reports that are older than 10 minutes (as such reports can no longer be correlated on the Dynatrace Cluster).
Reporting a crash forces a user session to be completed. Any subsequent actions are included in a new user session.
Android only When you use automated crash reporting, Visual Studio might catch the exception before OneAgent. If you notice that Dynatrace doesn't report crashes to your environment, make sure that you're not using the debug option in Visual Studio. Otherwise, the debugger catches the crash and nothing is reported to your Dynatrace environment.
Report a business event
Dynatrace SaaS version 1.253+
With sendBizEvent, you can report business events. These are standalone events, as Dynatrace sends them separately from user actions or user sessions.
Business events are only captured for monitored sessions. When OneAgent is disabled either through a special flag or due to cost and traffic control, business events are not reported for such sessions. Note that this behavior might be subject to change in the future, potentially allowing business events to be sent to Dynatrace regardless of session monitoring.
For additional details on business events, refer to Business Analytics.
using Dynatrace.Xamarin;var attributes = new Dictionary<string, JsonValue>();attributes.Add("event.name", "Confirmed Booking");attributes.Add("screen", "booking-confirmation");attributes.Add("product", "Danube Anna Hotel");attributes.Add("amount", 358.35);attributes.Add("currency", "USD");attributes.Add("reviewScore", 4.8);attributes.Add("arrivalDate", "2022-11-05");attributes.Add("departureDate", "2022-11-15");attributes.Add("journeyDuration", 10);attributes.Add("adultTravelers", 2);attributes.Add("childrenTravelers", 0);Agent.Instance.SendBizEvent("com.easytravel.funnel.booking-finished", attributes);
Tag specific users
You can tag each user of your application with a unique user name. This enables you to search and filter specific user sessions and analyze individual user behavior over time. For more details, see User tagging.
Make the following API call to tag the current session with a particular name:
using Dynatrace.Xamarin;Agent.Instance.IdentifyUser("John Smith");
OneAgent for Android version 237+ OneAgent for iOS version 235+ Sessions split due to idle or duration timeout are re-tagged automatically.
When OneAgent ends a tagged session because the session duration has reached its set limit or due to the user's inactivity, the subsequent session is re-tagged automatically. You don't need to provide the user identification information again.
However, note that OneAgent does not re-tag the subsequent session in the following cases:
- When you explicitly end a tagged user session via
endVisit When the user or the mobile operating system closes or force stops the app
When OneAgent ends the current user session and generates a new session after the privacy settings have been changed
See User sessions > Session end to learn when OneAgent ends a mobile user session.
When the user opt-in mode is enabled for your application, it might affect user tagging and reporting of custom events, user actions, values, and errors. The exact data types not reported to Dynatrace depend on the data collection level set by a particular user. For details, refer to Data collection levels.
End a session
You can force a session to end via the API call. This also closes all open actions and starts a new session.
using Dynatrace.Xamarin;Agent.Instance.EndVisit();
Configure data privacy (opt-in mode)
With user opt-in mode, each user of your application can set their data privacy preferences and decide whether they want or don't want to share their information. When the opt-in mode is enabled, you need to ask each user for permission to capture their data; then, you store their data privacy preferences. For details, see User opt-in mode.
Enable user opt-in mode
To activate the user opt-in mode, set the userOptIn property (Android) or DTXUserOptIn configuration key (iOS) to true in the dynatrace.config.json file.
Retrieve user's data privacy preferences
You can retrieve the data privacy preferences of a particular user.
To get the current UserPrivacyOptions configuration, use the following API call:
using Dynatrace.Xamarin;// Get the UserPrivacyOptions objectUserPrivacyOptions currentOptions = Agent.Instance.GetUserPrivacyOptions();// Get the individual settings for DataCollectionLevel and crash reportingbool crashOptedIn = Agent.Instance.GetUserPrivacyOptions().CrashReportingOptedIn;DataCollectionLevel dataCollectionLevel = Agent.Instance.GetUserPrivacyOptions().DataCollectionLevel;
Change user's data privacy preferences
You can adjust the data privacy preferences based on the decision of a particular user.
To set new options on a UserPrivacyOptions object, use the following code:
using Dynatrace.Xamarin;// Creating a new UserPrivacyOptions object requires setting the two parameters of DataCollectionLevel and crash reportingUserPrivacyOptions options = new UserPrivacyOptions(DataCollectionLevel.Performance, false);// Update the options with the setter// Set a data collection level (user allowed you to capture performance and personal data)options.DataCollectionLevel = DataCollectionLevel.UserBehavior;// Allow crash reporting (user allowed you to collect information on crashes)options.CrashReportingOptedIn = true;// Get the values of the configuration with the getteroptions.DataCollectionLevel;options.CrashReportingOptedIn;// Get the UserPrivacyOptions objectUserPrivacyOptions currentOptions = Agent.Instance.GetUserPrivacyOptions();
To apply the new UserPrivacyOptions configuration, use this code:
using Dynatrace.Xamarin;UserPrivacyOptions options = new UserPrivacyOptions(DataCollectionLevel.UserBehavior, true);Agent.Instance.ApplyUserPrivacyOptions(options);
The possible values for the data collection level are as follows:
OffPerformanceUserBehavior
Report GPS location
You can report the latitude and longitude.
SetGPSLocation(latitude: double, longitude: double);
Configuration file
The dynatrace.config.json configuration file contains your application ID, beacon URL, and some other settings.
- You can download this file from Dynatrace or create it manually.
- If you don't add a configuration file with at least the beacon URL and the application ID properties, the build fails. Alternatively, use the manual startup with a configuration builder (Android) or a configuration dictionary (iOS).
- When you use a specific build configuration—for example,
Debug,Release, or a custom-defined configuration—our package searches theAssets(Android) orResources(iOS) directory for a configuration file nameddynatrace<Configuration>.config.json. For example, if you're using theDebugbuild configuration, our package looks for a file nameddynatraceDebug.config.json. If the package can't find the configuration-specific file, it uses the defaultdynatrace.config.jsonfile.
The following is the dynatrace.config.json file structure for Android and iOS.
Never use dot notation for the configuration file. Always write in full bracket style.
Enable OneAgent debug logs
If the instrumentation runs through and your application starts, but you see no data in your Dynatrace environment, you probably need to dig deeper to find out why OneAgents aren't sending any data. Opening up a support ticket is a great idea but gathering logs first is even better.
Enable build debug logs for Android
Android only
If the Android instrumentation fails, you most likely need to open a support ticket and provide build debug logs. To provide those logs, you need to set the DynatraceInstrumentationLogging property and change the build log level to Diagnostic.
-
Set the
DynatraceInstrumentationLoggingproperty. Choose one of the following options to do that:- Create
Directory.Build.propsin the Android project directory:
<Project><PropertyGroup><DynatraceInstrumentationLogging>true</DynatraceInstrumentationLogging></PropertyGroup></Project>- Add the
DynatraceInstrumentationLoggingproperty to the.csprojfile of your project. Insert it into some existingPropertyGroup, depending on the configuration that you're executing.
- Create
-
Change the build output verbosity to
Diagnostic. For details, see the Microsoft documentation on how to change the amount of information included in the build log. -
Rebuild your project.
-
Attach the build logs to the support ticket so that we can further analyze your issue.
Troubleshooting
If you can't resolve a problem, check Mobile applications: Issues with Dynatrace Xamarin NuGet package in the Dynatrace Community.