Deployment
This page gives an overview and guided path to different deployment options depending on the desired observability value. By default, all deployment options are based on Dynatrace Operator.
Observability options for Kubernetes
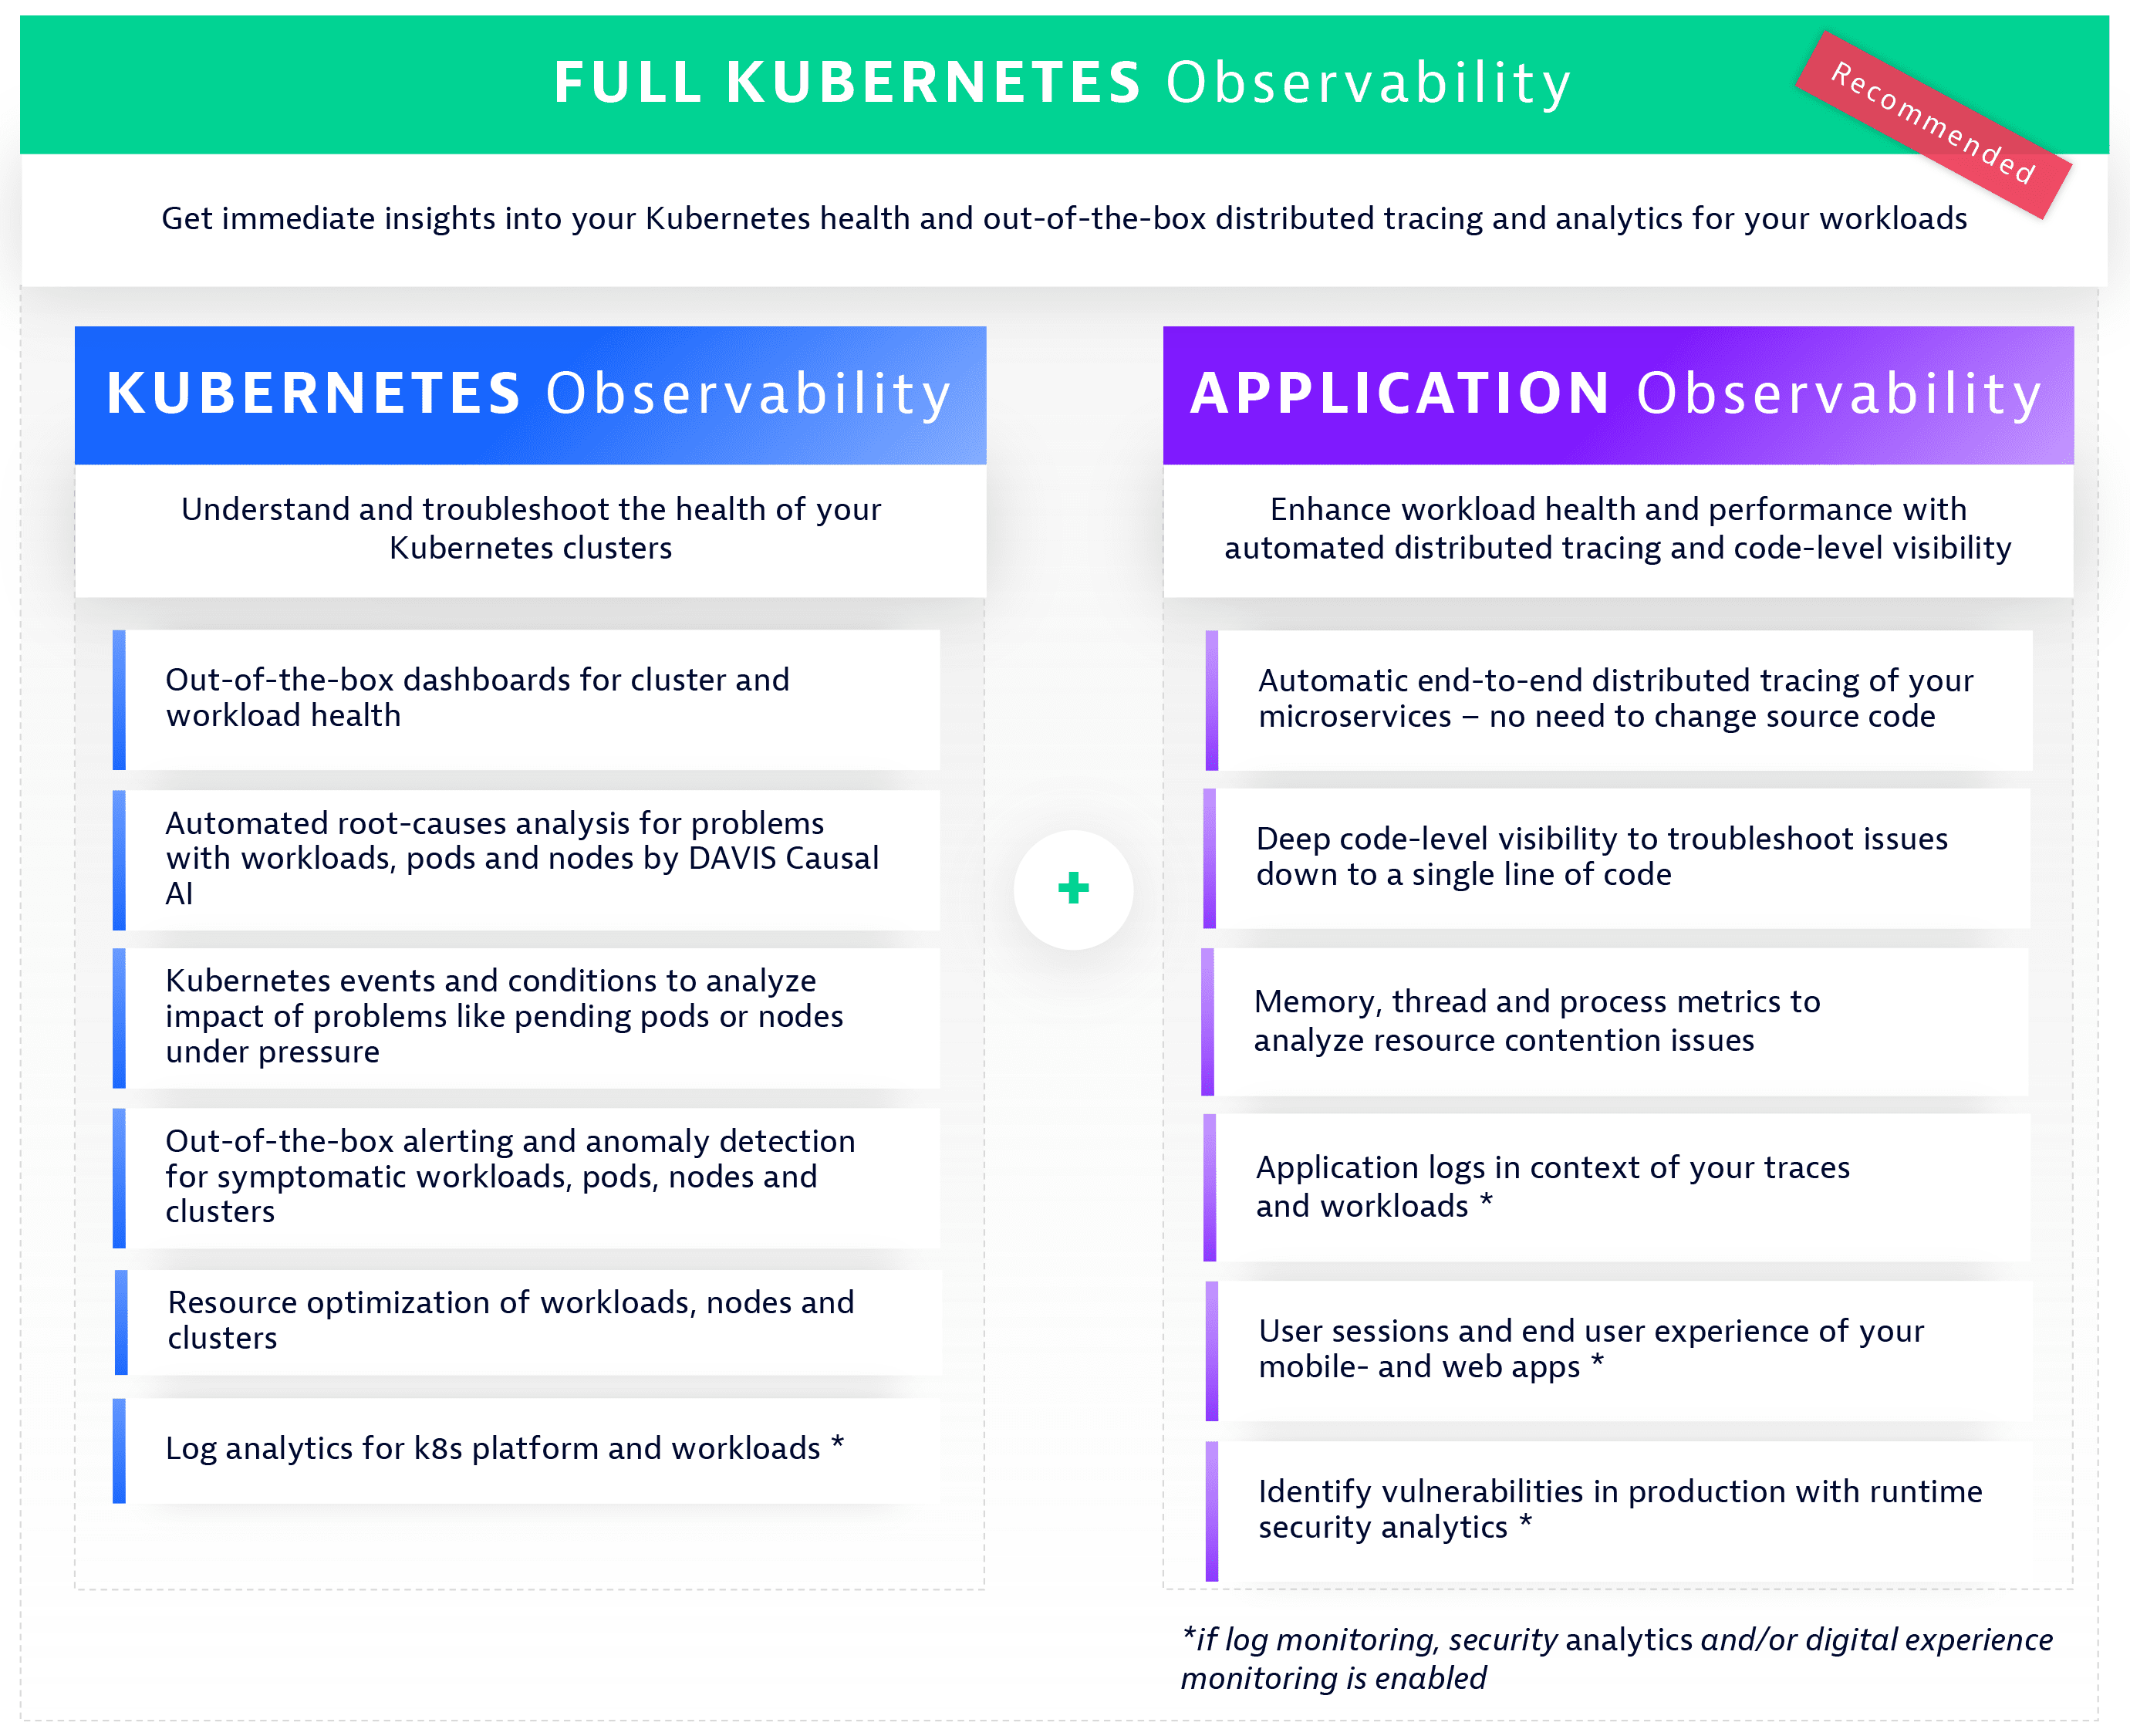
Full Kubernetes observability
Get immediate insights into your Kubernetes health and out-of-the-box distributed tracing and analytics for your workloads
Deployment options
- recommended Deploy Dynatrace Operator in cloud native full stack mode
- Deploy Dynatrace Operator in classic full stack mode
Limitations: There’s a startup dependency between the container in which OneAgent is deployed and application containers to be instrumented (for example, containers that have deep process monitoring enabled). The OneAgent container must be started and the oneagenthelper process must be running before the application container is launched so that the application can be properly instrumented.
- deprecated Manual OneAgent rollout via Daemonset (not based on Dynatrace Operator)
Want to learn more about the different approaches and deployment options?
Here's how it works
Kubernetes observability
Understand and troubleshoot the health of your Kubernetes clusters
Deployment
Deploy Dynatrace Operator for Kubernetes observability
Application observability
Enhance workload health and performance with automated distributed tracing and code-level visibility.
Deployment
Deploy Dynatrace Operator in application monitoring mode
The following options for application monitoring are not based on Dynatrace Operator:
For the S390x architecture, pod runtime and container build-time injections are supported.
Deployment from Marketplaces
Dynatrace supports deploying Dynatrace Operator from within the following Marketplaces:
Learn more
How it works
Familiarize yourself with Dynatrace components that are deployed in your Kubernetes cluster.
Guides
Learn how you can configure Dynatrace Operator to support specific use cases.
Reference
API reference and configuration options for all Dynatrace components within your Kubernetes cluster.
Dynatrace Operator release notes
See release notes for Dynatrace Operator.