Monitor Azure Virtual Machines (built-in)
Dynatrace ingests metrics from Azure Metrics API for Azure Virtual Machines and Azure Virtual Machine Scale Sets. You can view metrics for each service instance, split metrics into multiple dimensions, and create custom charts that you can pin to your dashboards.
Prerequisites
Environment ActiveGate
- To disable monitoring of built-in services, you need Environment ActiveGate version 1.245+ and Dynatrace version 1.247+.
This service monitors Azure Virtual Machines (Microsoft.Compute/virtualMachines and Microsoft.Compute/virtualMachineScaleSets).
You can find the already monitored resources on the Azure overview page in the VMs and Scale sets sections. To monitor resources of type Microsoft.ClassicCompute/virtualMachines, check Azure Virtual Machine (classic) and the Cloud services section on the Azure overview page.
Enable monitoring
To learn how to enable service monitoring, see Enable service monitoring.
View service metrics
You can view Azure service metrics in your Dynatrace environment on the Azure subscription page or on your own dashboard.
View metrics on the Azure account page
To access metrics on the Azure account page
-
Go to Azure or Azure Classic (latest Dynatrace).
-
Choose the Azure subscription.
-
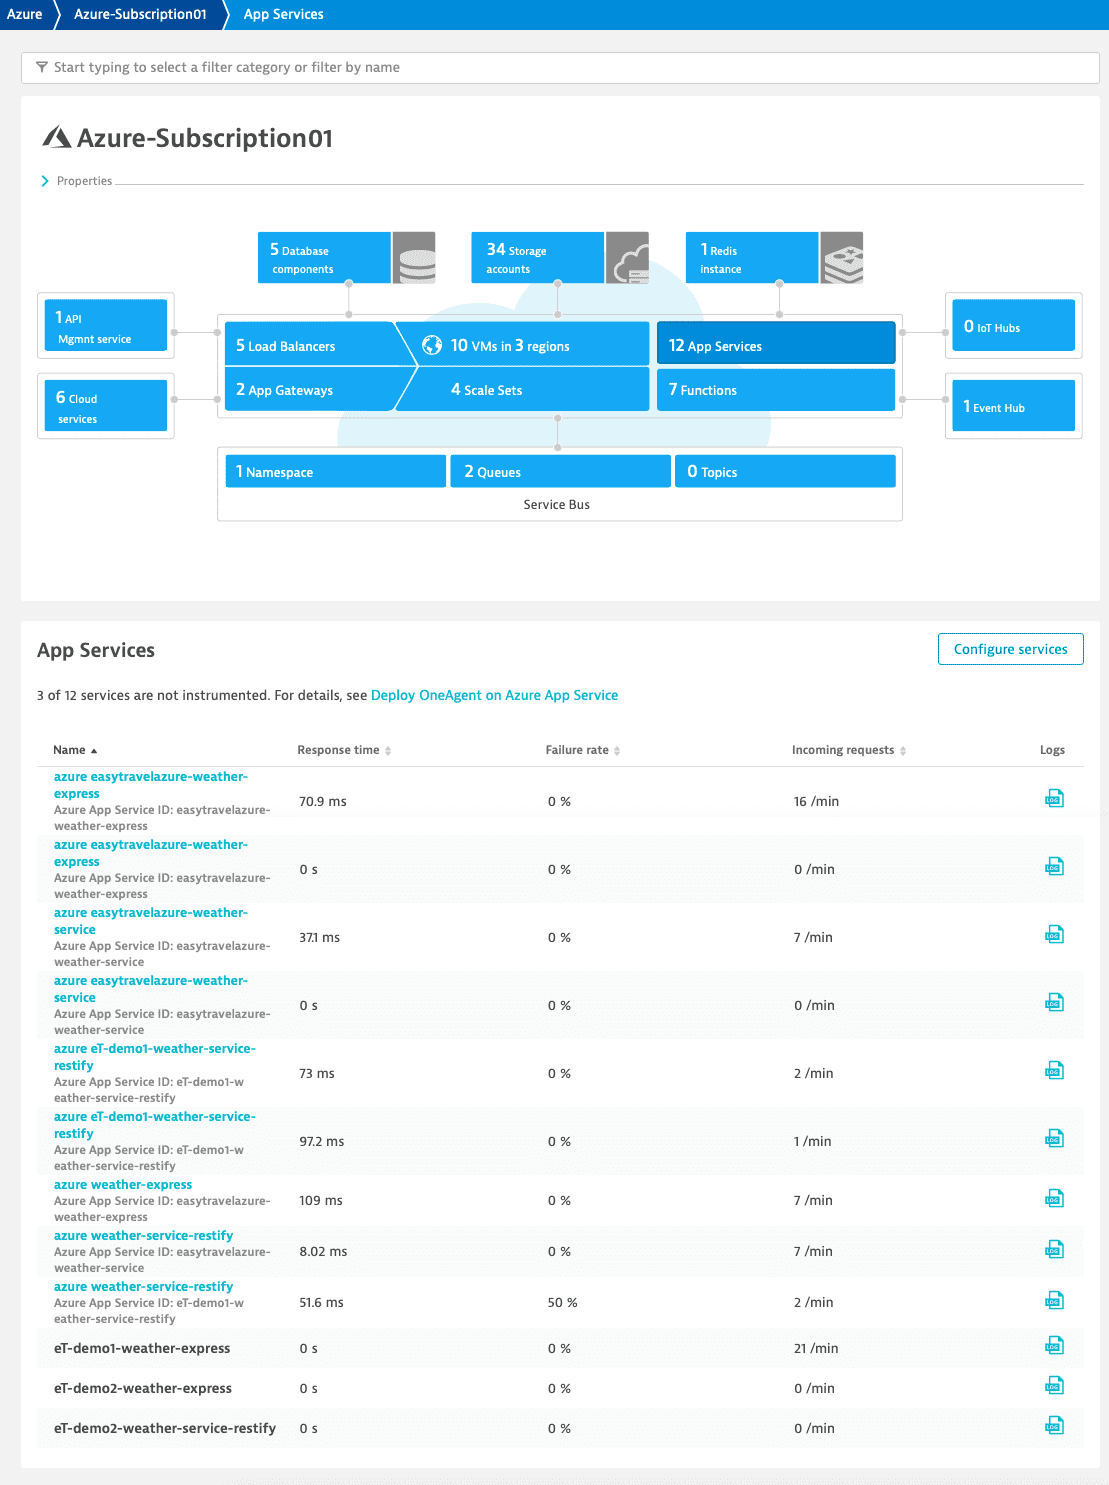
Select the service whose metrics you want to check. Metrics for the selected service are visible under the infographic in the service section, similarly to the example below.
View metrics on a dashboard
You can create your own dashboard for viewing Azure service metrics. For information on how to create dashboards, see Create and edit Dynatrace dashboards.
Available metrics
Azure Virtual Machines
| Metric key | Name | Unit | Aggregations | Monitoring consumption |
|---|---|---|---|---|
| builtin:cloud | Disk read bytes | Byte | autovalue | DDUs |
| builtin:cloud | Disk read operations per sec | Per second | autoavgmaxmin | DDUs |
| builtin:cloud | Disk write bytes | Byte | autovalue | DDUs |
| builtin:cloud | Disk write operations per sec | Per second | autoavgmaxmin | DDUs |
| builtin:cloud | Network in bytes | Byte | autovalue | DDUs |
| builtin:cloud | Network out bytes | Byte | autovalue | DDUs |
| builtin:cloud | Percentage CPU | Percent (%) | autoavgmaxmin | DDUs |
Azure Virtual Machines region
| Metric key | Name | Unit | Aggregations | Monitoring consumption |
|---|---|---|---|---|
| builtin:cloud | Number of starting VMs in region | Count | autoavgmaxmin | Host units |
| builtin:cloud | Number of active VMs in region | Count | autoavgmaxmin | Host units |
| builtin:cloud | Number of stopped VMs in region | Count | autoavgmaxmin | Host units |
Azure Virtual Machine Scale Sets
| Metric key | Name | Unit | Aggregations | Monitoring consumption |
|---|---|---|---|---|
| builtin:cloud | Disk read bytes | Byte | autovalue | DDUs |
| builtin:cloud | Disk read operations per sec | Per second | autoavgmaxmin | DDUs |
| builtin:cloud | Disk write bytes | Byte | autovalue | DDUs |
| builtin:cloud | Disk write operations per sec | Per second | autoavgmaxmin | DDUs |
| builtin:cloud | Network in bytes | Byte | autovalue | DDUs |
| builtin:cloud | Network out bytes | Byte | autovalue | DDUs |
| builtin:cloud | Number of starting VMs in scale set | Count | autoavgmaxmin | Host units |
| builtin:cloud | Number of active VMs in scale set | Count | autoavgmaxmin | Host units |
| builtin:cloud | Number of stopped VMs in scale set | Count | autoavgmaxmin | Host units |
| builtin:cloud | Percentage CPU | Percent (%) | autoavgmaxmin | DDUs |