Azure SQL Servers (built-in)
For information about differences between classic services and other services, see Migrate from Azure classic (formerly "built-in") services to cloud services.
Dynatrace ingests metrics from Azure Metrics API for Azure SQL (SQL Servers, SQL Databases, SQL Elastic Pools). You can view metrics for each service instance, split metrics into multiple dimensions, and create custom charts that you can pin to your dashboards.
Prerequisites
Environment ActiveGate
- To disable monitoring of built-in services, you need Environment ActiveGate version 1.245+ and Dynatrace version 1.247+.
This service monitors SQL Servers, SQL Databases (only containing the user kind) and SQL elastic pools.
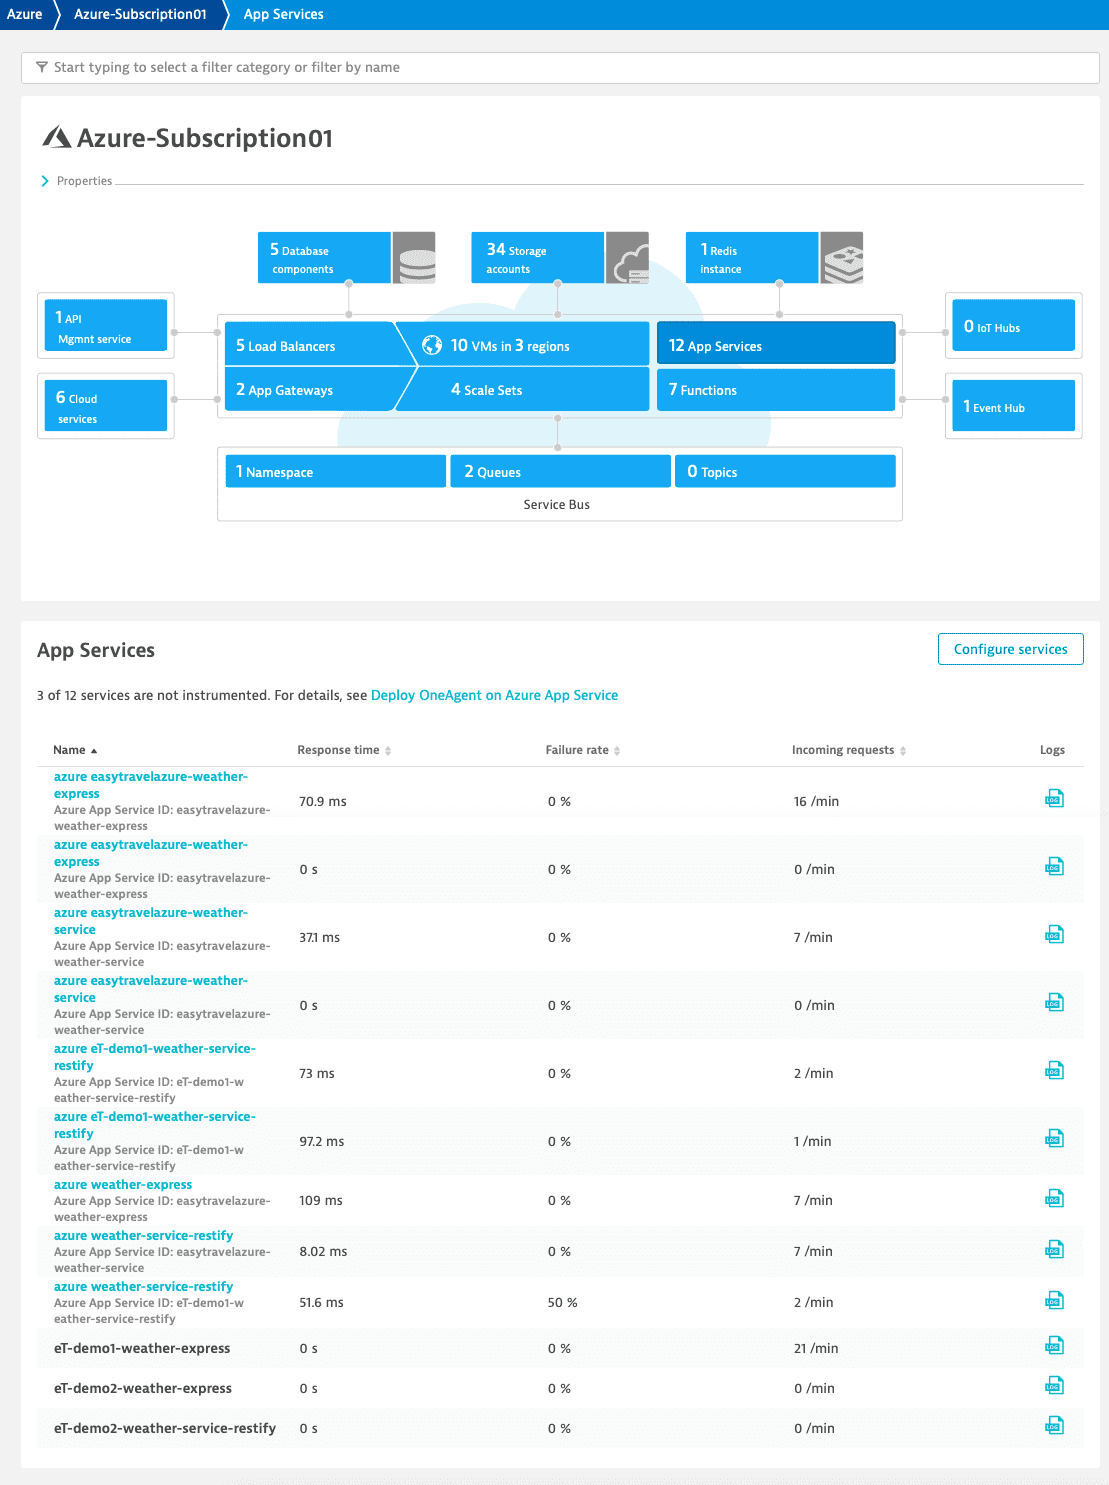
You can find the already monitored resources on the Azure overview page, Databases components view.
To monitor resources of the hyperscale/data warehouse resources, or Managed deployments, check the SQL Database Hyperscale/SQL Data Warehouse/SQL Managed Instance and the Azure overview page, Cloud services view.
Enable monitoring
To learn how to enable service monitoring, see Enable service monitoring.
View service metrics
You can view Azure service metrics in your Dynatrace environment on the Azure subscription page or on your own dashboard.
View metrics on the Azure account page
To access metrics on the Azure account page
-
Go to Azure or Azure Classic (latest Dynatrace).
-
Choose the Azure subscription.
-
Select the service whose metrics you want to check. Metrics for the selected service are visible under the infographic in the service section, similarly to the example below.
View metrics on a dashboard
You can create your own dashboard for viewing Azure service metrics. For information on how to create dashboards, see Create and edit Dynatrace dashboards.
Available metrics
SQL Databases
| Metric key | Name | Unit | Aggregations | Monitoring consumption |
|---|---|---|---|---|
| builtin:cloud | Blocked by firewall | Count | autovalue | DDUs |
| builtin:cloud | Failed connections | Count | autovalue | DDUs |
| builtin:cloud | Successful connections | Count | autovalue | DDUs |
| builtin:cloud | DTU limit | Count | autoavgmaxmin | DDUs |
| builtin:cloud | DTU used | Count | autoavgmaxmin | DDUs |
| builtin:cloud | DTU percentage | Percent (%) | autoavgmaxmin | DDUs |
| builtin:cloud | Data I/O percentage | Percent (%) | autoavgmaxmin | DDUs |
| builtin:cloud | Log I/O percentage | Percent (%) | autoavgmaxmin | DDUs |
| builtin:cloud | Database size percentage | Percent (%) | autoavgmaxmin | DDUs |
| builtin:cloud | Total database size | Byte | autoavgmaxmin | DDUs |
| builtin:cloud | In-Memory OLTP storage percent | Percent (%) | autoavgmaxmin | DDUs |
| builtin:cloud | CPU percentage | Percent (%) | autoavgmaxmin | DDUs |
| builtin:cloud | Deadlocks | Count | autovalue | DDUs |
| builtin:cloud | Sessions percentage | Percent (%) | autoavgmaxmin | DDUs |
| builtin:cloud | Workers percentage | Percent (%) | autoavgmaxmin | DDUs |
SQL Elastic Pools
| Metric key | Name | Unit | Aggregations | Monitoring consumption |
|---|---|---|---|---|
| builtin:cloud | Storage limit | Byte | autoavgmaxmin | DDUs |
| builtin:cloud | Database size percentage | Percent (%) | autoavgmaxmin | DDUs |
| builtin:cloud | Storage used | Byte | autoavgmaxmin | DDUs |
| builtin:cloud | In-memory OLTP storage percent | Percent (%) | autoavgmaxmin | DDUs |
| builtin:cloud | DTU percentage | Percent (%) | autoavgmaxmin | DDUs |
| builtin:cloud | eDTU limit | Count | autoavgmaxmin | DDUs |
| builtin:cloud | eDTU used | Count | autoavgmaxmin | DDUs |
| builtin:cloud | Data I/O percentage | Percent (%) | autoavgmaxmin | DDUs |
| builtin:cloud | Log I/O percentage | Percent (%) | autoavgmaxmin | DDUs |
| builtin:cloud | CPU percentage | Percent (%) | autoavgmaxmin | DDUs |
| builtin:cloud | Sessions percentage | Percent (%) | autoavgmaxmin | DDUs |
| builtin:cloud | Workers percentage | Percent (%) | autoavgmaxmin | DDUs |