Tags and management zones for AWS integration
To organize cloud entities in your environment and simplify searches for them, you can use tags and basic instance properties imported from the cloud, as well as tags and management zones assigned in Dynatrace. Tags and management zones are applied to cloud entities just as they are for other entities, but they are best applied via the entity selector.
Cloud entities in your environment
You can browse all cloud entites in your environment using their ID or type from cloud entity types via the entity selector, just as for other entities. You can also explore all available properties and relationships available for each individual resource or type.
You can also browse their metrics using entity selector as part of metric selector, e.g. in Data Explorer.
To learn more about Dynatrace cloud entities and to check which ones can have tags imported from the cloud, see Cloud services with their respective Dynatrace entity types.
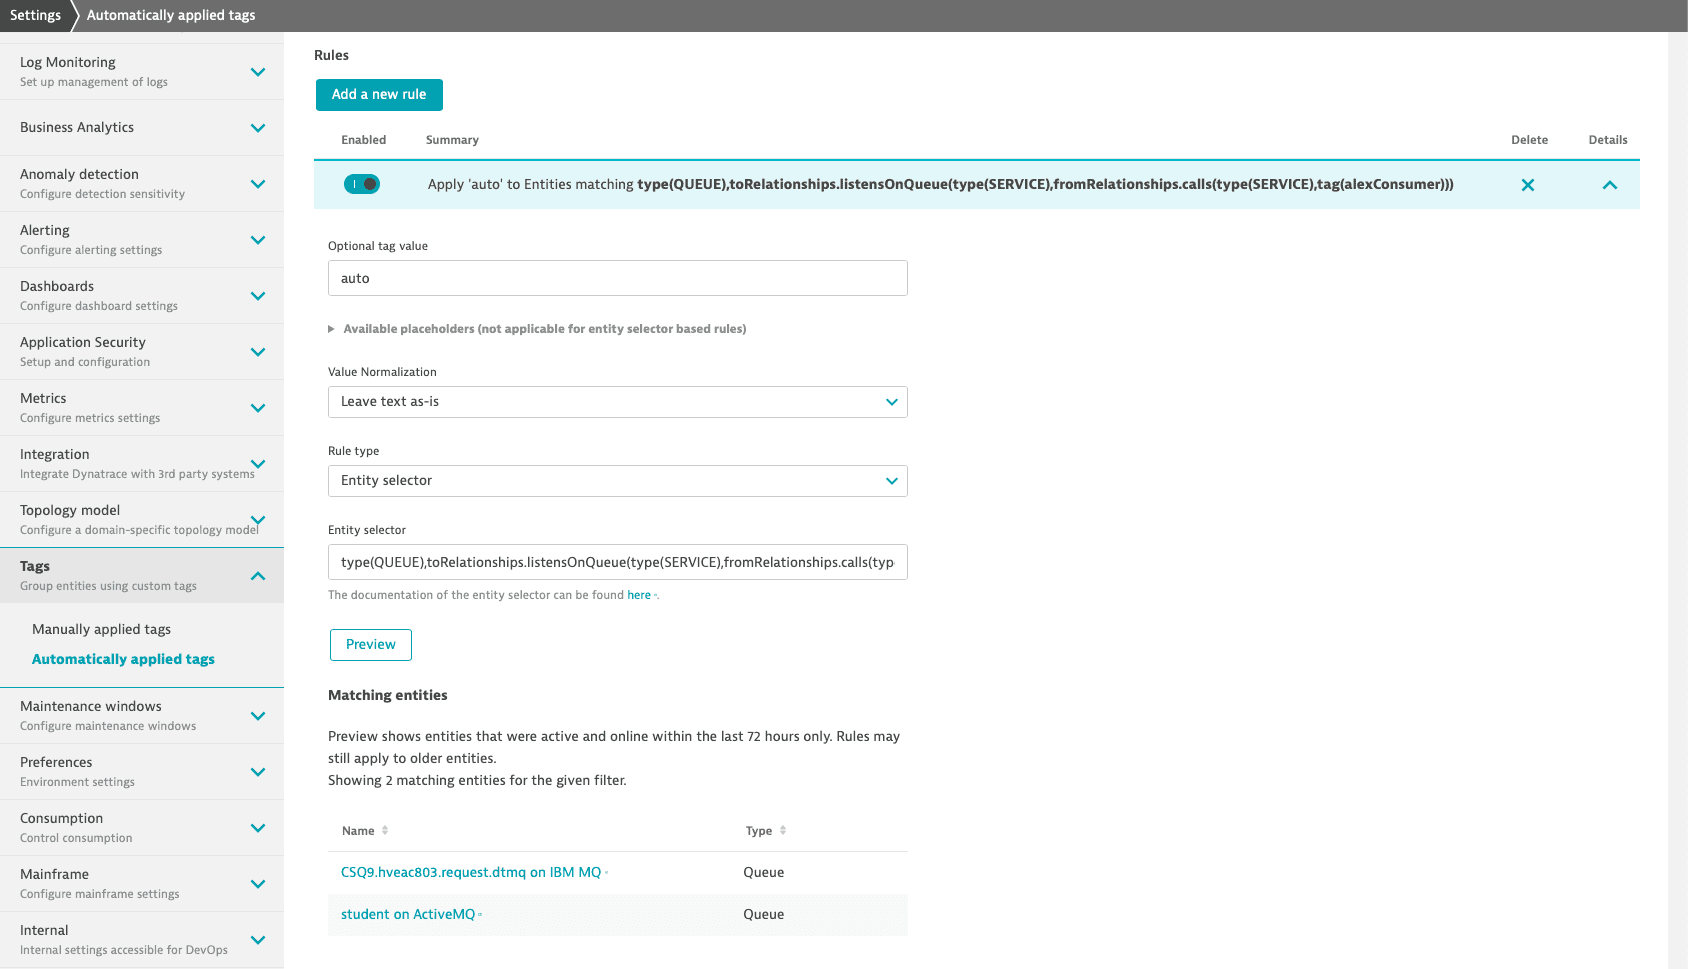
Add an automatically applied tag to cloud entities
Follow the steps below to automatically apply a tag to cloud entities. To learn more about tags, see Define and apply tags.
-
Go to Settings > Tags > Automatically applied tags.
-
Select Create tag and type a name for the new tag in the Tag name field.
-
Select Add a new rule.
-
optional Optional tag value. This value appears next to the tag name that the rule is specified for, after a
:, and is used to provide more precise information based on the individual rule. Note that for rules based on the entity selector, this value cannot be extracted from the entity itself using placeholders. -
From the Rule type list, choose the Entity selector type.
-
Use one of the code snippets from the examples and adapt it with your own values to apply tags to cloud entities matching your entity selector.
-
Select Preview to verify the results returned by the specific entity selector.
-
Select Save changes.
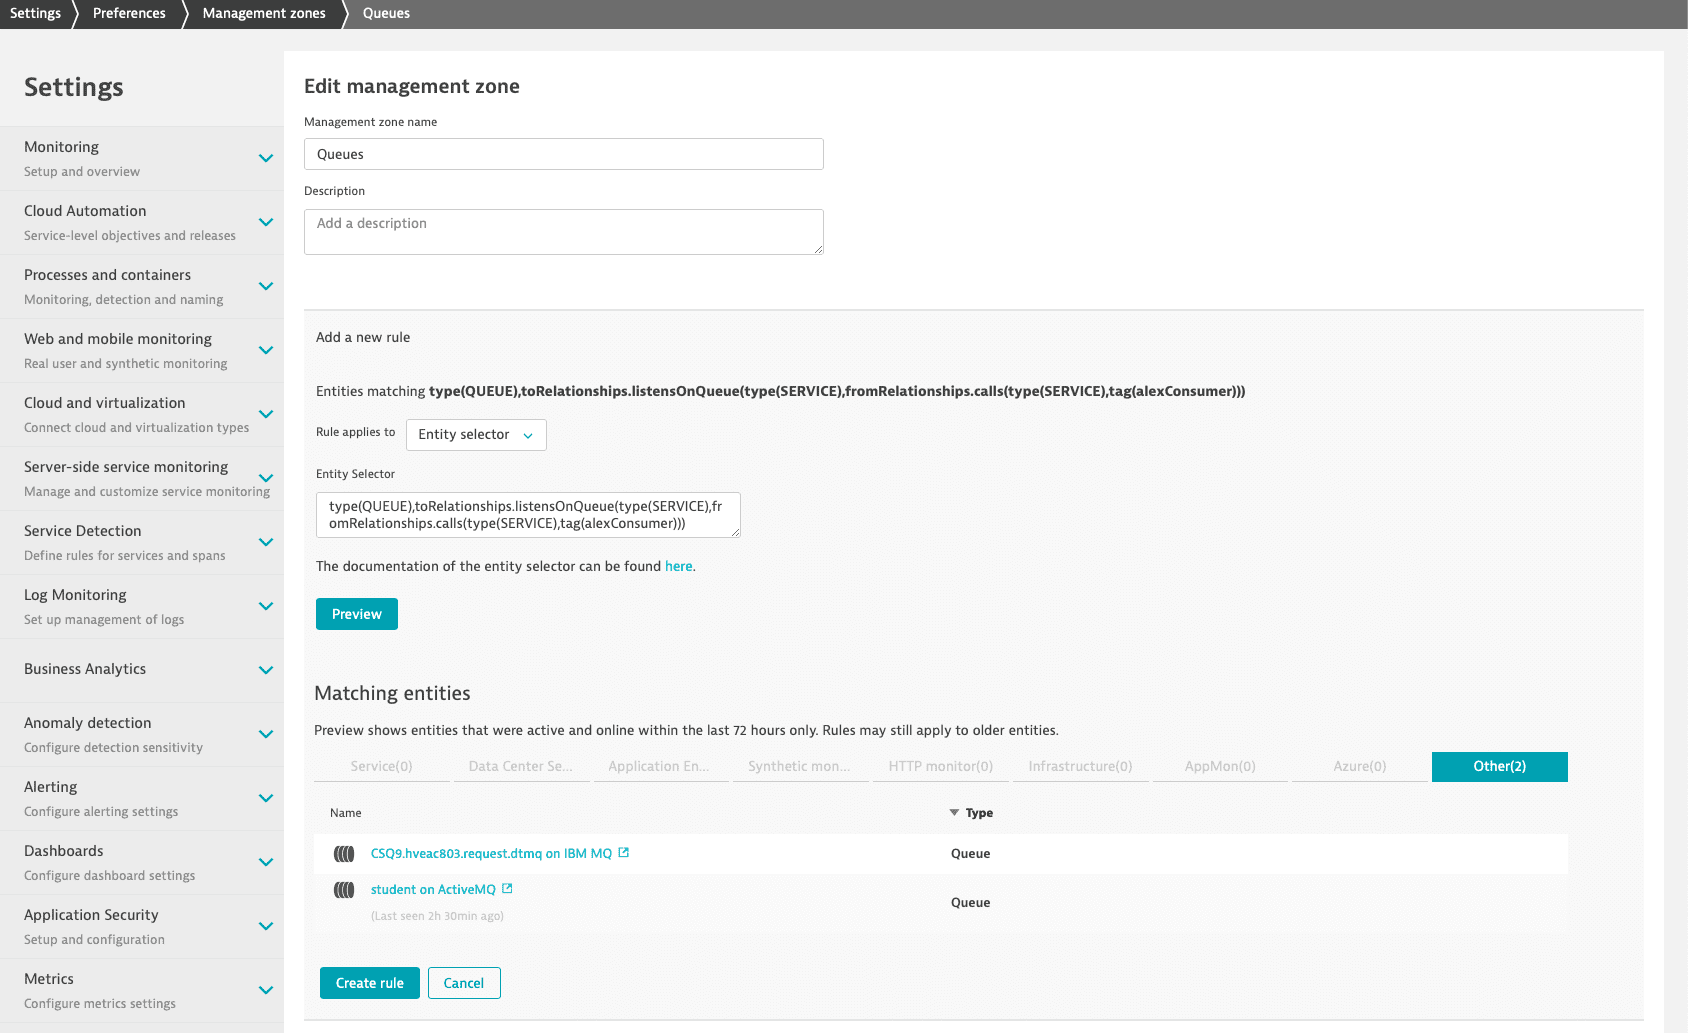
Add cloud entities to existing management zones
Follow the steps below to add cloud entities to existing management zones. To learn more about management zones, see Set up management zones.
- Go to Settings > Preferences > Management zones.
- Edit an existing management zone and select Add a new rule.
- In the Rule applies to list, choose the Entity selector.
- Use one of the code snippets from the examples and adapt it with your own values to add to the management zone cloud entities matching the entity selector.
- Select Preview to verify the results returned by the specific entity selector.
- Select Save changes.
Entity selector examples for AWS entities
You can use the examples below and cloud entity types to suit your own needs.