Trace Python, Node.js, and Java Lambda functions
Dynatrace provides you with a dedicated AWS Lambda layer that contains the Dynatrace extension for AWS Lambda. You need to add the publicly available layer for your runtime and region to your function. Then, based on your configuration method, Dynatrace provides a template or configuration for your AWS Lambda function.
Activate AWS Lambda

Choose a configuration method

Specify a Dynatrace API endpoint

Enable Real User Monitoring

Define an AWS layer name

Deployment

Configuration options

Dynatrace AWS integration

Prerequisites
- A supported AWS Lambda runtime. The Dynatrace extension supports AWS Lambda functions written in Node.js, Python, or Java. Both 64-bit ARM (AWS Graviton2 processors) and 64-bit x86 architectures are supported.
- Java The following RAM requirements need to be met:
- If Lambda SnapStart is enabled and OneAgent version is 1.267+, memory needs to be set to a minimum of 512 MB.
- If Lambda SnapStart is not enabled and OneAgent version is 1.265 or earlier, memory needs to be set to a minimum of 1500 MB. To configure memory in the AWS Lambda console, go to General > Basic settings and set Memory.
A new configuration of the memory size affects the amount of virtual CPU available to the function; to learn more about it, see Monitoring overhead below.
Note that the RAM requirements for Node.js and Python Lambda functions might be significantly lower. The compute power in AWS Lambda scales with the allocated memory and with low memory settings the function execution time becomes much slower.
- Activate the Forward Tag 4 trace context extension OneAgent feature. Go to Settings > Preferences > OneAgent features.
Activate AWS Lambda
To get started
- In Dynatrace Hub, select AWS Lambda.
- Select Set up.
Follow the instructions to enable monitoring of AWS Lambda functions.
Choose a configuration method
The Dynatrace Lambda agent is distributed as a layer that can be enabled and configured manually or using well known Infrastructure as Code (IaC) solutions.
On the Enable Monitoring for AWS Lambda Functions page, use the How will you configure your AWS Lambda functions? list to select your preferred method, and then make sure you set all properties for the selected method before copying the generated configuration snippets.
If you select this method, Dynatrace provides you with:
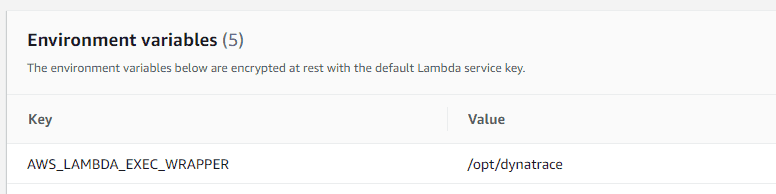
An environment variable to add to your AWS Lambda function
- A JSON snippet that you need to copy into the
dtconfig.jsonfile in the root folder of your Lambda deployment Lambda layer ARN
When using this method, make sure that you add the Dynatrace Lambda layer to your function. You can do this through the AWS console (Add layer > Specify an ARN and paste the ARN displayed on the deployment page) or by using an automated solution of your choice.
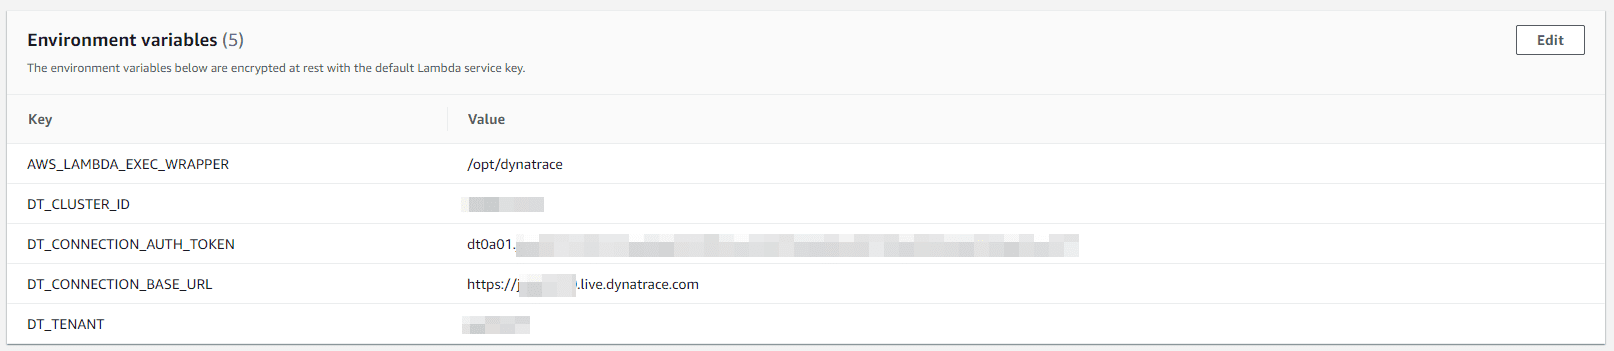
Enter environment variables via the AWS Console
Enter the Lambda layer ARN via the AWS Console
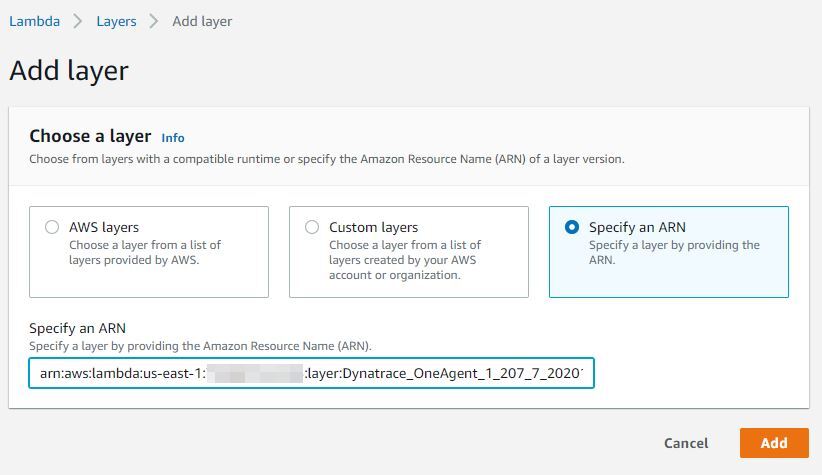
When using this method, make sure that you add the Dynatrace Lambda layer to your function. The layer, as well as the environment variables, can be set either manually through the AWS console (Add layer > Specify an ARN and paste the ARN displayed on the deployment page) or by using an automated solution of your choice.
Client-side decryption of environment variables (Security in Transit) is not supported.
If you select this method, Dynatrace provides you with:
-
Values to define environment variables for the AWS Lambda functions that you want to monitor
-
Lambda layer ARN
Terraform is a popular Infrastructure as Code (IaC) solution. If you select this method, Dynatrace provides you with:
A template to define the AWS Lambda function. This includes all the configuration that you need to deploy and configure the Dynatrace AWS Lambda extension together with your functions.
Lambda layer ARN
The AWS Serverless Application Model (SAM) is an open-source framework for building serverless applications.
If you select this method, Dynatrace provides you with a template to define the AWS Lambda function. This includes all the configuration that you need to integrate the Dynatrace AWS Lambda extension.
The Serverless Application option is a framework for deploying serverless stacks.
If you select this method, Dynatrace provides you with a template to define the AWS Lambda function. This includes all the configuration that you need to integrate the Dynatrace AWS Lambda extension.
AWS CloudFormation is an IaC solution that enables provisioning of a wide range of AWS services.
If you select this method, Dynatrace provides you with a template to define the AWS Lambda function. This includes all the configuration that you need to integrate the Dynatrace AWS Lambda extension.
Specify a Dynatrace API endpoint optional
This is an optional step that enables you to specify a Dynatrace API endpoint to which monitoring data will be sent.
The typical scenario is to deploy a Dynatrace ActiveGate in close proximity (same region) to the Lambda functions that you want to monitor in order to reduce network latency, which can impact the execution and cold start time of your Lambda functions for (usually one) network request by the agent per Lambda invocation (which happens at the end of the invocation). See section for typical overhead numbers.
Enable Real User Monitoring optional
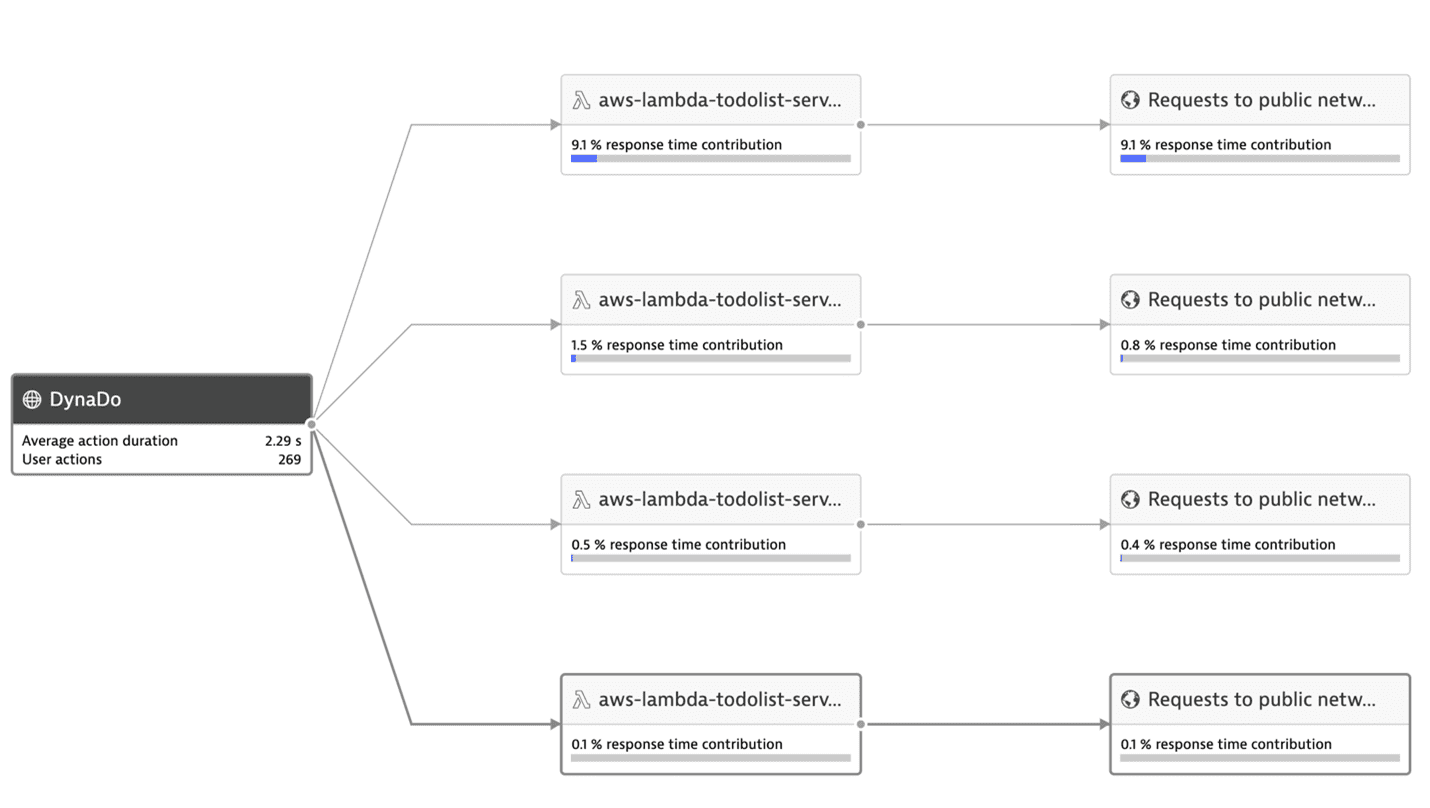
This is an optional step to use Real User Monitoring (RUM), which provides you with deep insights into user actions and performance via the browser or in mobile apps.
Configure AWS
-
Make sure the
x-dtcheader is allowed in the CORS settings of your monitored Lambda functions.RUM for Lambda functions requires a specific header (
x-dtc) to be sent with XHR calls to AWS. To enable it, the CORS settings of your AWS deployment must allow thex-dtcheader during preflight (OPTIONS) requests. To configure CORS and allow thex-dtcheader for your specific setup, see Enable CORS on a resource using the API Gateway console in AWS documentation.
Configure Dynatrace
To configure the x-dtc header for calls to your Lambda functions
- Go to Web, Mobile, Frontend, or Custom Applications, depending on your application type.
Select the application you want to connect with your Lambda function.
- Select the browse menu (…) in the upper-right corner and select Edit.
- Select Capturing > Async web requests and SPAs.
- Make sure that your framework of choice is enabled. If your framework is not listed, enable Capture XmlHttpRequest (XHR) for generic support of
XHR. - Select Capturing > Advanced setup.
- Scroll down to the Enable Real User Monitoring for cross-origin XHR calls section and enter a pattern that matches the URL to your Lambda functions. For example:
TheAwsUniqueId.execute-api.us-east-1.amazonaws.com - Select Save. After a few minutes, the header will be attached to all calls to your Lambda function and requests from your browser will be linked to the backend.
If requests start failing after enabling this option, review your CORS settings. To learn how to configure CORS, see Enable CORS on a resource using the API Gateway console in AWS documentation.
Define an AWS layer name
Select the AWS region and the runtime of the Lambda function to be monitored. These settings are required to provide the correct layer ARN.
 Deployment
Copy the configuration snippets into your deployment and use your deployment method of choice to enable the layer and set the configuration for your Lambda functions.
Configuration options
Configure the AWS API Gateway
-
If inbound (non-XHR) requests to your Lambda functions are not connected to the calling application, configure the API Gateway to pass through the Dynatrace tag. To do this, enable Use Lambda Proxy Integration on the Integration Request configuration page of the API Gateway.
-
If the API Gateway is configured from the Lambda configuration page, this setting will be enabled by default. For more information, see Enable CORS on a resource using the API Gateway console.
AWS Lambda also supports non-proxy integration, which—without some additional configuration—prevents Dynatrace from
Tracing calls from other monitored applications
- RUM detection (web and mobile)
Node.jsPython To make tracing calls from other monitored applications/RUM detection work in this scenario, create a custom mapping template in the integration requests configuration.
-
In the AWS API Gateway Console, go to Resources and select a request method (for example, GET).
-
Select Mapping Templates and then select Add mapping template.
-
Add the following content to the template:
{"path": "$context.path","httpMethod": "$context.httpMethod","headers": {#foreach($param in ["x-dynatrace", "traceparent", "tracestate", "x-dtc", "referer", "host", "x-forwarded-proto", "x-forwarded-for", "x-forwarded-port"])"$param": "$util.escapeJavaScript($input.params().header.get($param))"#if($foreach.hasNext),#end#end },"requestContext": {"stage": "$context.stage"}}The
x-dtcheader is specific to tracing RUM scenarios, whereas the remaining headers are generally needed to link traces together and extract relevant information, such as web request metadata. -
Select Save to save your configuration.
-
Redeploy your API.
Filter cold starts
One of the important metrics for Lambda is the frequency of cold starts. A cold start happens when a new instance of a Lambda function is invoked. Such cold starts take longer and add latency to your requests.
A high cold-start frequency can indicate errors or an uneven load pattern that can be mitigated using provisioned concurrency. Dynatrace reports such cold starts as a property on the distributed trace.
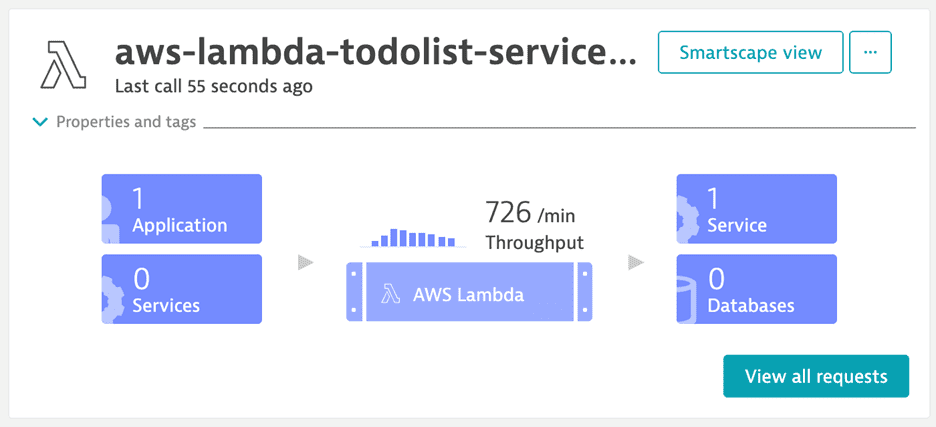
To analyze cold starts, select View all requests on the Lambda service details page.
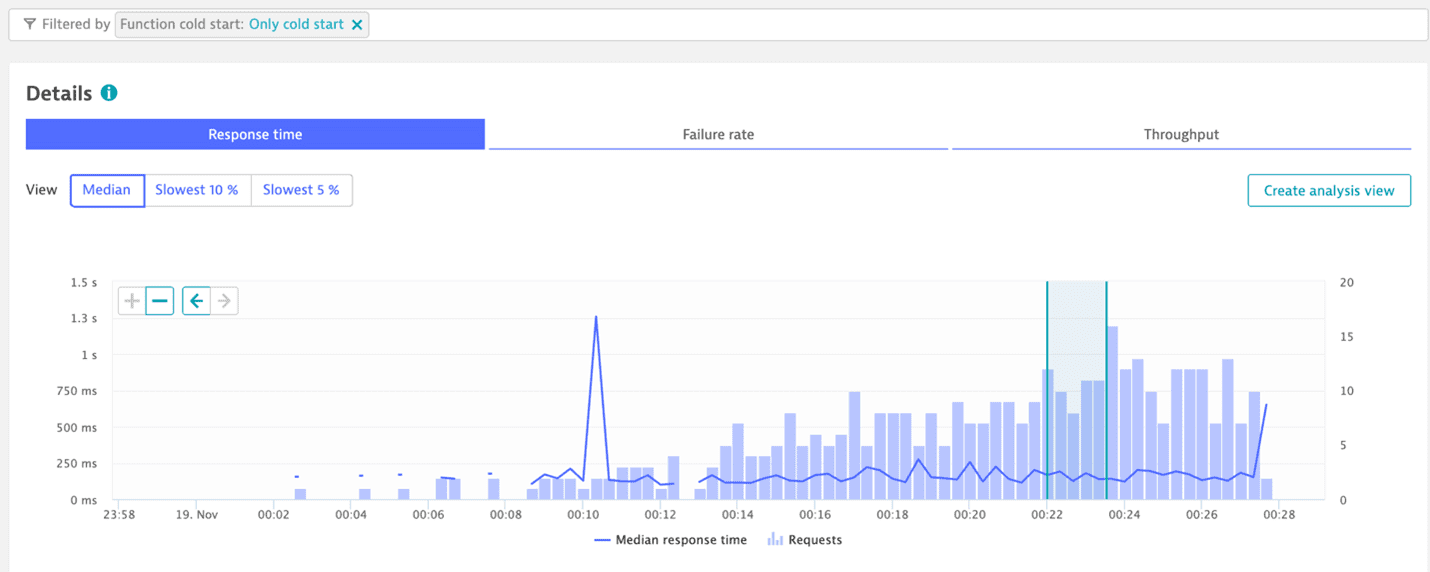
In the request filter, select Function cold start in the Request property section.
This displays a page that you can filter by invocations containing Only cold start or No cold start.
Monitoring overhead
Enabling monitoring unavoidably induces overhead to the monitored function execution. Overhead depends on several factors, such as function runtime technology, configuration, and concrete function characteristics such as code size or execution duration and complexity.
The amount of memory configured for a function directly impacts the compute resources assigned to the function instance. For more details, see Memory and computing power.
The worst-case scenario on measured overhead is a function with an empty function handler and minimum memory configuration.
Cold start overhead
- For Python, cold start overhead is about 1,000 ms.
- For Node.js, cold start overhead is about 700 ms.
- For Java, cold start overhead may exceed 1,000 ms.
For the minimum memory configuration requirement, see Requirement for Java Lambda functions.
Response time latency
Latency depends on the function implementation, but is typically less than 10%. This means that the time it takes until the caller of a Lambda function receives a response might increase up to 10% when the agent layer is added in comparison to when the agent is not active/present.
Code space overhead
| Runtime | Code space (MB) |
|---|---|
| Node.js | ~6MB |
| Python | 6.3MB |
| Java | 4.5MB |
Dynatrace AWS integration
While not mandatory, we recommend that you set up Dynatrace Amazon CloudWatch integration. This allows data ingested via AWS integration to be seamlessly combined with the data collected by the Dynatrace AWS Lambda extension.
Known limitations
-
The Dynatrace AWS Lambda extension does not support the capture of method-level request attributes.
-
Most Dynatrace AWS Lambda extensions don't capture IP addresses of outgoing HTTP requests. This results in unmonitored hosts if the called service isn't monitored with Dynatrace.
-
Incoming calls: Dynatrace can monitor incoming calls only if they are invoked via:
AWS SDK Lambda Invoke API
API gateway
Lambda function URL
AWS SQS
AWS SNS
For other invocation types, OneAgent cannot capture any specific information and can also not connect the trace to any parent. Invocations via the AWS SDK need the client to be instrumented with Dynatrace in order to connect the trace.
-
Outgoing requests to another AWS Lambda function: In a monitored AWS Lambda function, the following libraries are supported for outgoing requests to another AWS Lambda function:
For Java: AWS SDK version 1 for Java
- For Node.js: AWS SDK for JavaScript in Node.js:
- version 2
- version 3 (OneAgent version 1.263+)
For Python: AWS SDK for Python (Boto3)
-
Outgoing HTTP requests: In a monitored AWS Lambda function, the following libraries/HTTP clients are supported for outgoing HTTP requests:
For Java: Apache HTTP Client 3.x, 4.x
- For Node.js:
- Built-in
http.request - Built-in
fetch API (OneAgent version 1.285+)
- Built-in
- For Python:
requests,aiohttp-client,urllib3,redis-py(OneAgent version 1.289+)
-
Additional requirements for incoming calls for Java only: To correctly monitor the configured handler method
- The configured handler class has to implement the handler method by itself. If the handler method is only defined in a base class, you have to add an override in the handler class, calling the base handler method within (usually
super.handleRequest(...)). - The handler method has to have a
Context(com.amazonaws.services.lambda.runtime.Context) parameter. - We recommend following best practice by deriving your Lambda handler class from com.amazonaws.services.lambda.runtime.RequestHandler overrriding
handleRequestand configuring that as handler method. However, as long as the previous requirements are fulfilled, the agent supports any valid handler function, even if not derived from that base interface. - The AWS Lambda events library must be used by your function as the types defined in the
com.amazonaws.services.lambda.runtime.eventspackage are used by OneAgent to match the corresponding invocation types for incoming calls.
- The configured handler class has to implement the handler method by itself. If the handler method is only defined in a base class, you have to add an override in the handler class, calling the base handler method within (usually
-
Node.js sensors and instrumentations for ES modules:
-
The Node.js AWS Lambda extension sensors (instrumentations) don't support ECMAScript modules. This means that the extension won't properly monitor outgoing calls (for example, HTTP or AWS SDK requests).
-
OpenTelemetry instrumentations don't support ECMAScript modules by default.
There is a way to make OpenTelemetry instrumentations work with ECMAScript modules, but it's experimental and has some limitations. For details, Instrumentation for ES Modules In NodeJS (experimental).
-