Analyze processes
From any Host page you can view a list of the processes that contribute to each host health metric (for example, Memory in the image below).
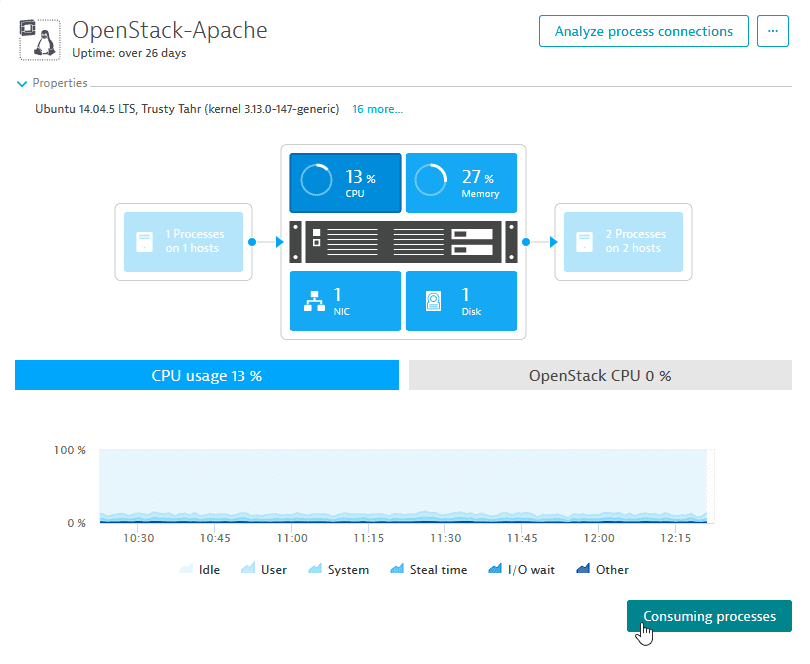
You can click the Consuming processes button to view the list of the processes that contributed to the selected health metric.
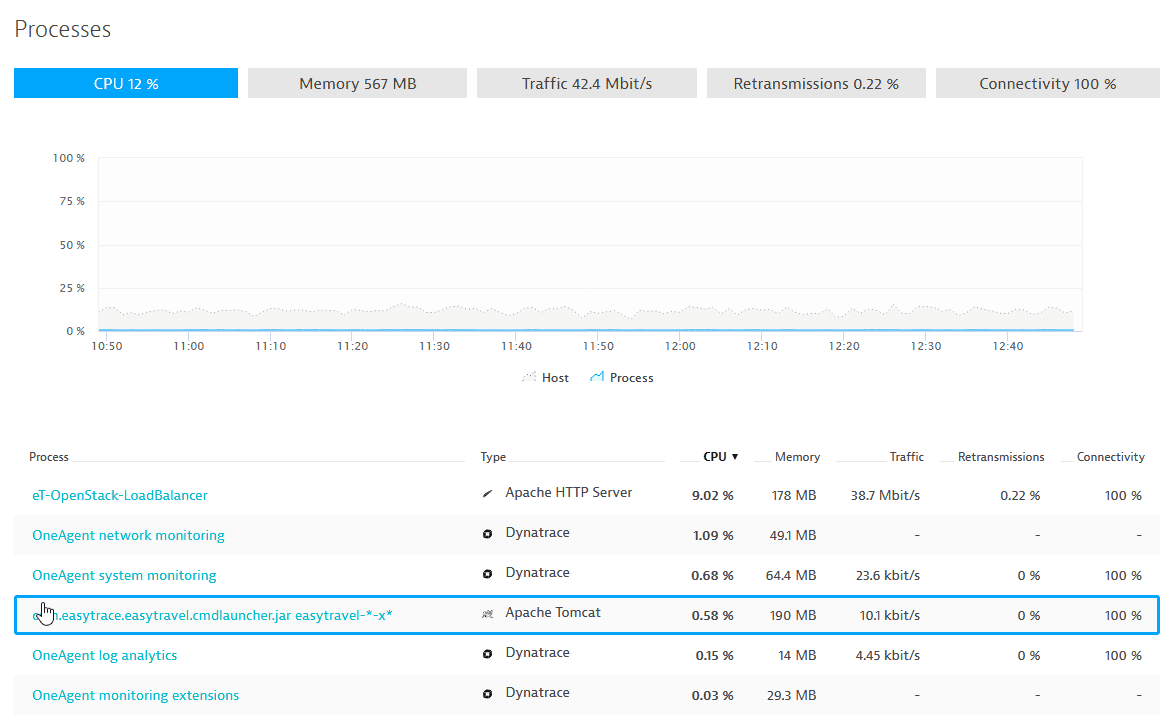
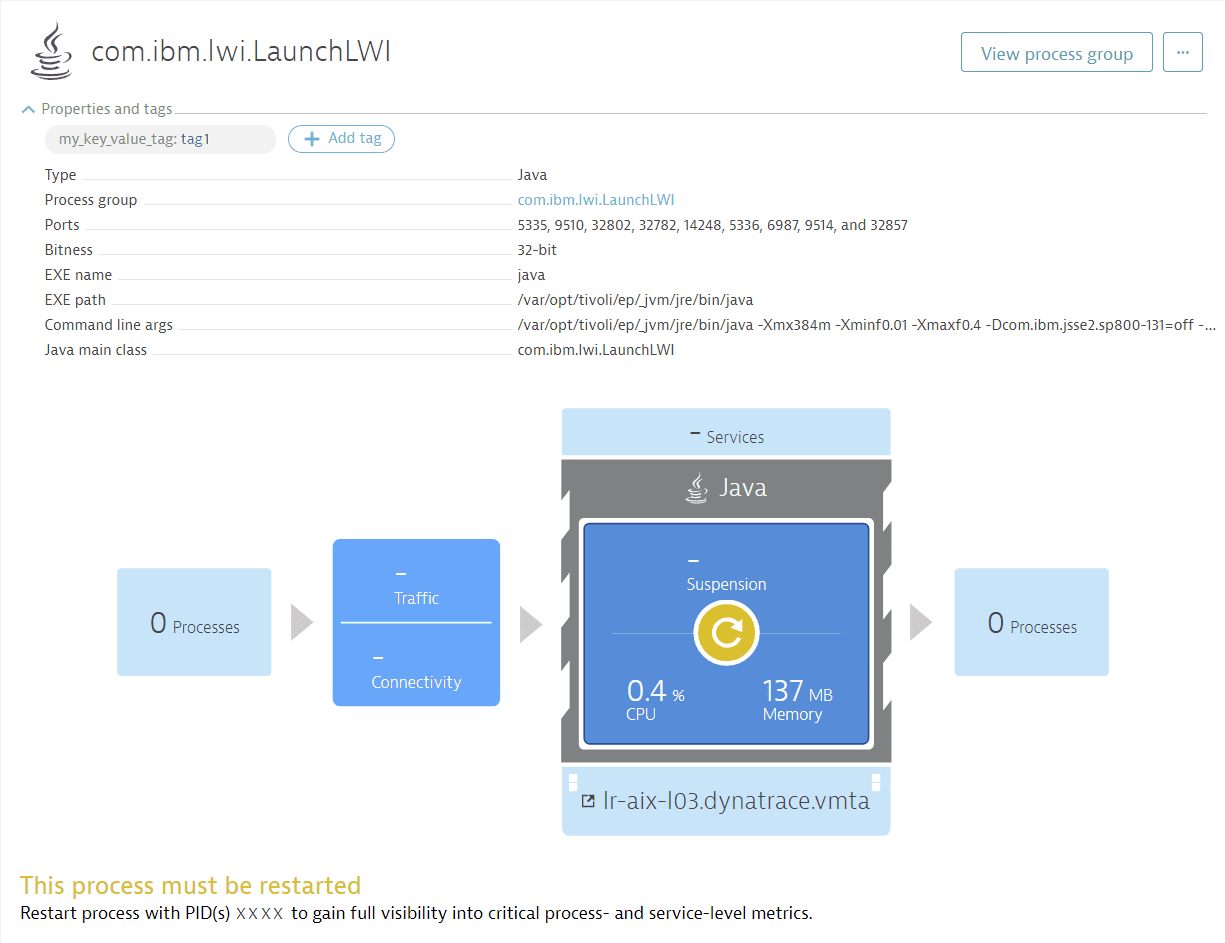
Once you've displayed the contributing processes list, click any process to explore that process in detail on a dedicated Process page. On each process page you'll find process-specific statistics related to CPU consumption, memory consumption, network utilization (see image below), and other infrastructure measurements. You'll also find details regarding related events, problems, and dependencies.
Vulnerabilities
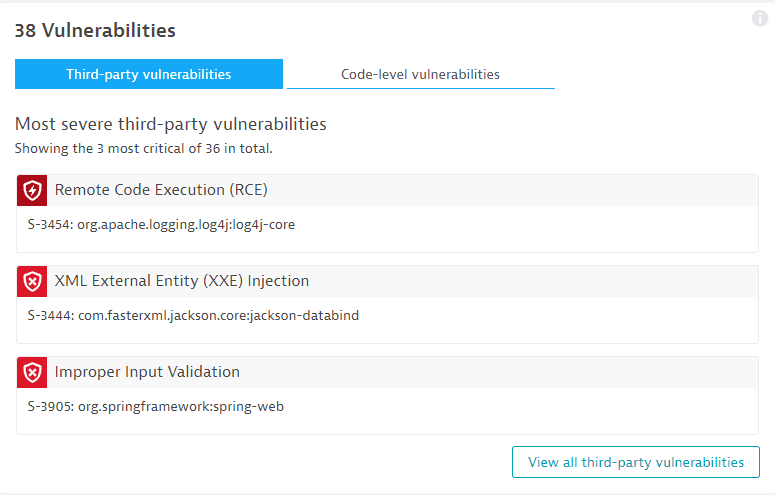
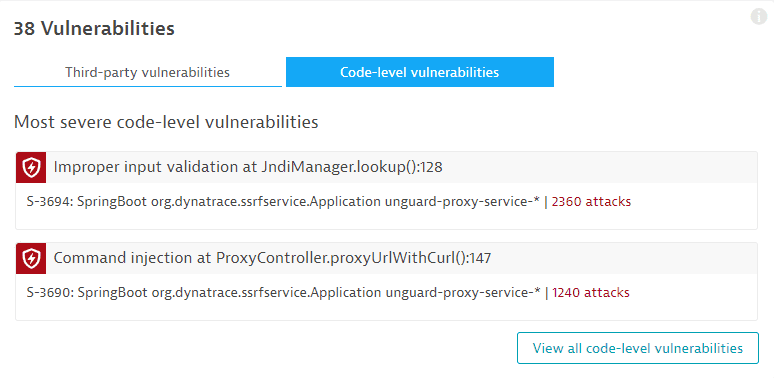
The Vulnerabilities section on the details page of a process shows the five most severe third-party vulnerabilities and code-level vulnerabilities related to this process.
To view this section, activate and enable Application Security.
If you're missing the security permissions for the management zone where the process is included, this section is not displayed.
Select a vulnerability to view the details and understand the severity and impact of a vulnerability within your environment.
- For a complete list of the detected vulnerabilities affecting this process, select Show all third-party vulnerabilities/Show all code-level vulnerabilities.
Example third-party vulnerabilities:
Example code-level vulnerabilities:
Process availability
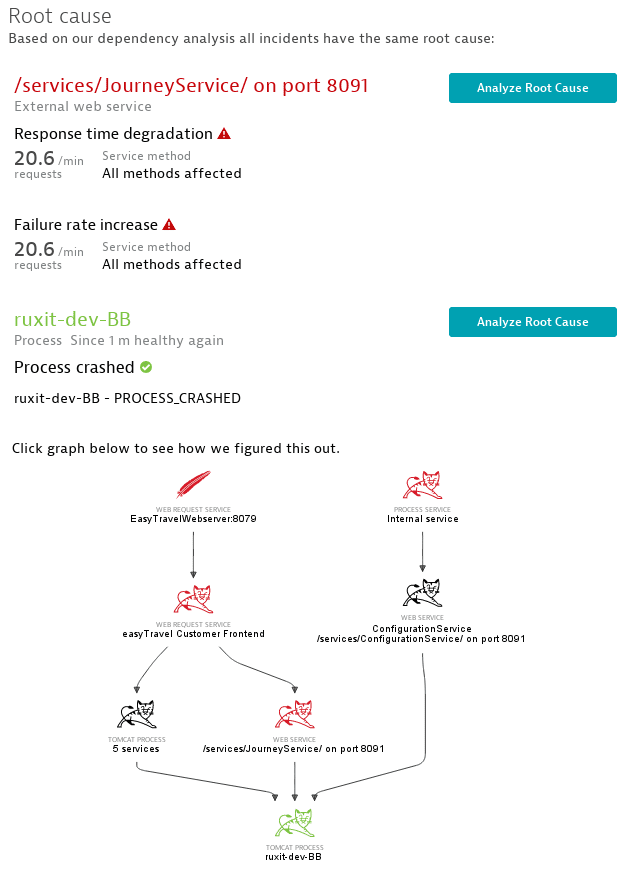
Apart from recording event-types, like process shutdowns and restarts, Dynatrace also shows process crashes. This is especially important for service availability monitoring. Services inherit their availability from the processes they run on. Dynatrace considers a service to be offline when the entire process group it runs on is unavailable. This can occur when a process is shutdown or crashes (see image below).
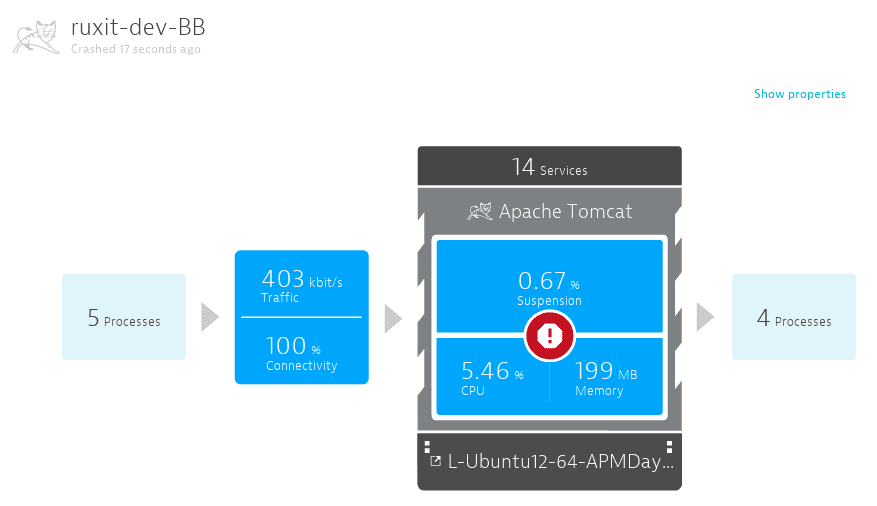
Dynatrace allows you to distinguish between services that are available, but receive no traffic, and services that are unavailable because the underlying processes have stopped or crashed. In the case of a crashed process, Dynatrace monitors the crash and informs you about the impact of the crash on your services and applications (see image below).