F5 BIG-IP LTM monitoring
This extension documentation is now deprecated and will no longer be updated. We recommend using the new F5 BIG-IP LTM extension for improved functionality and support.
Learn about F5 BIG-IP LTM Extension configuration, deployment and working with data.
Before you begin
Verify that your designated ActiveGate has the Extensions 2.0 module active and running.
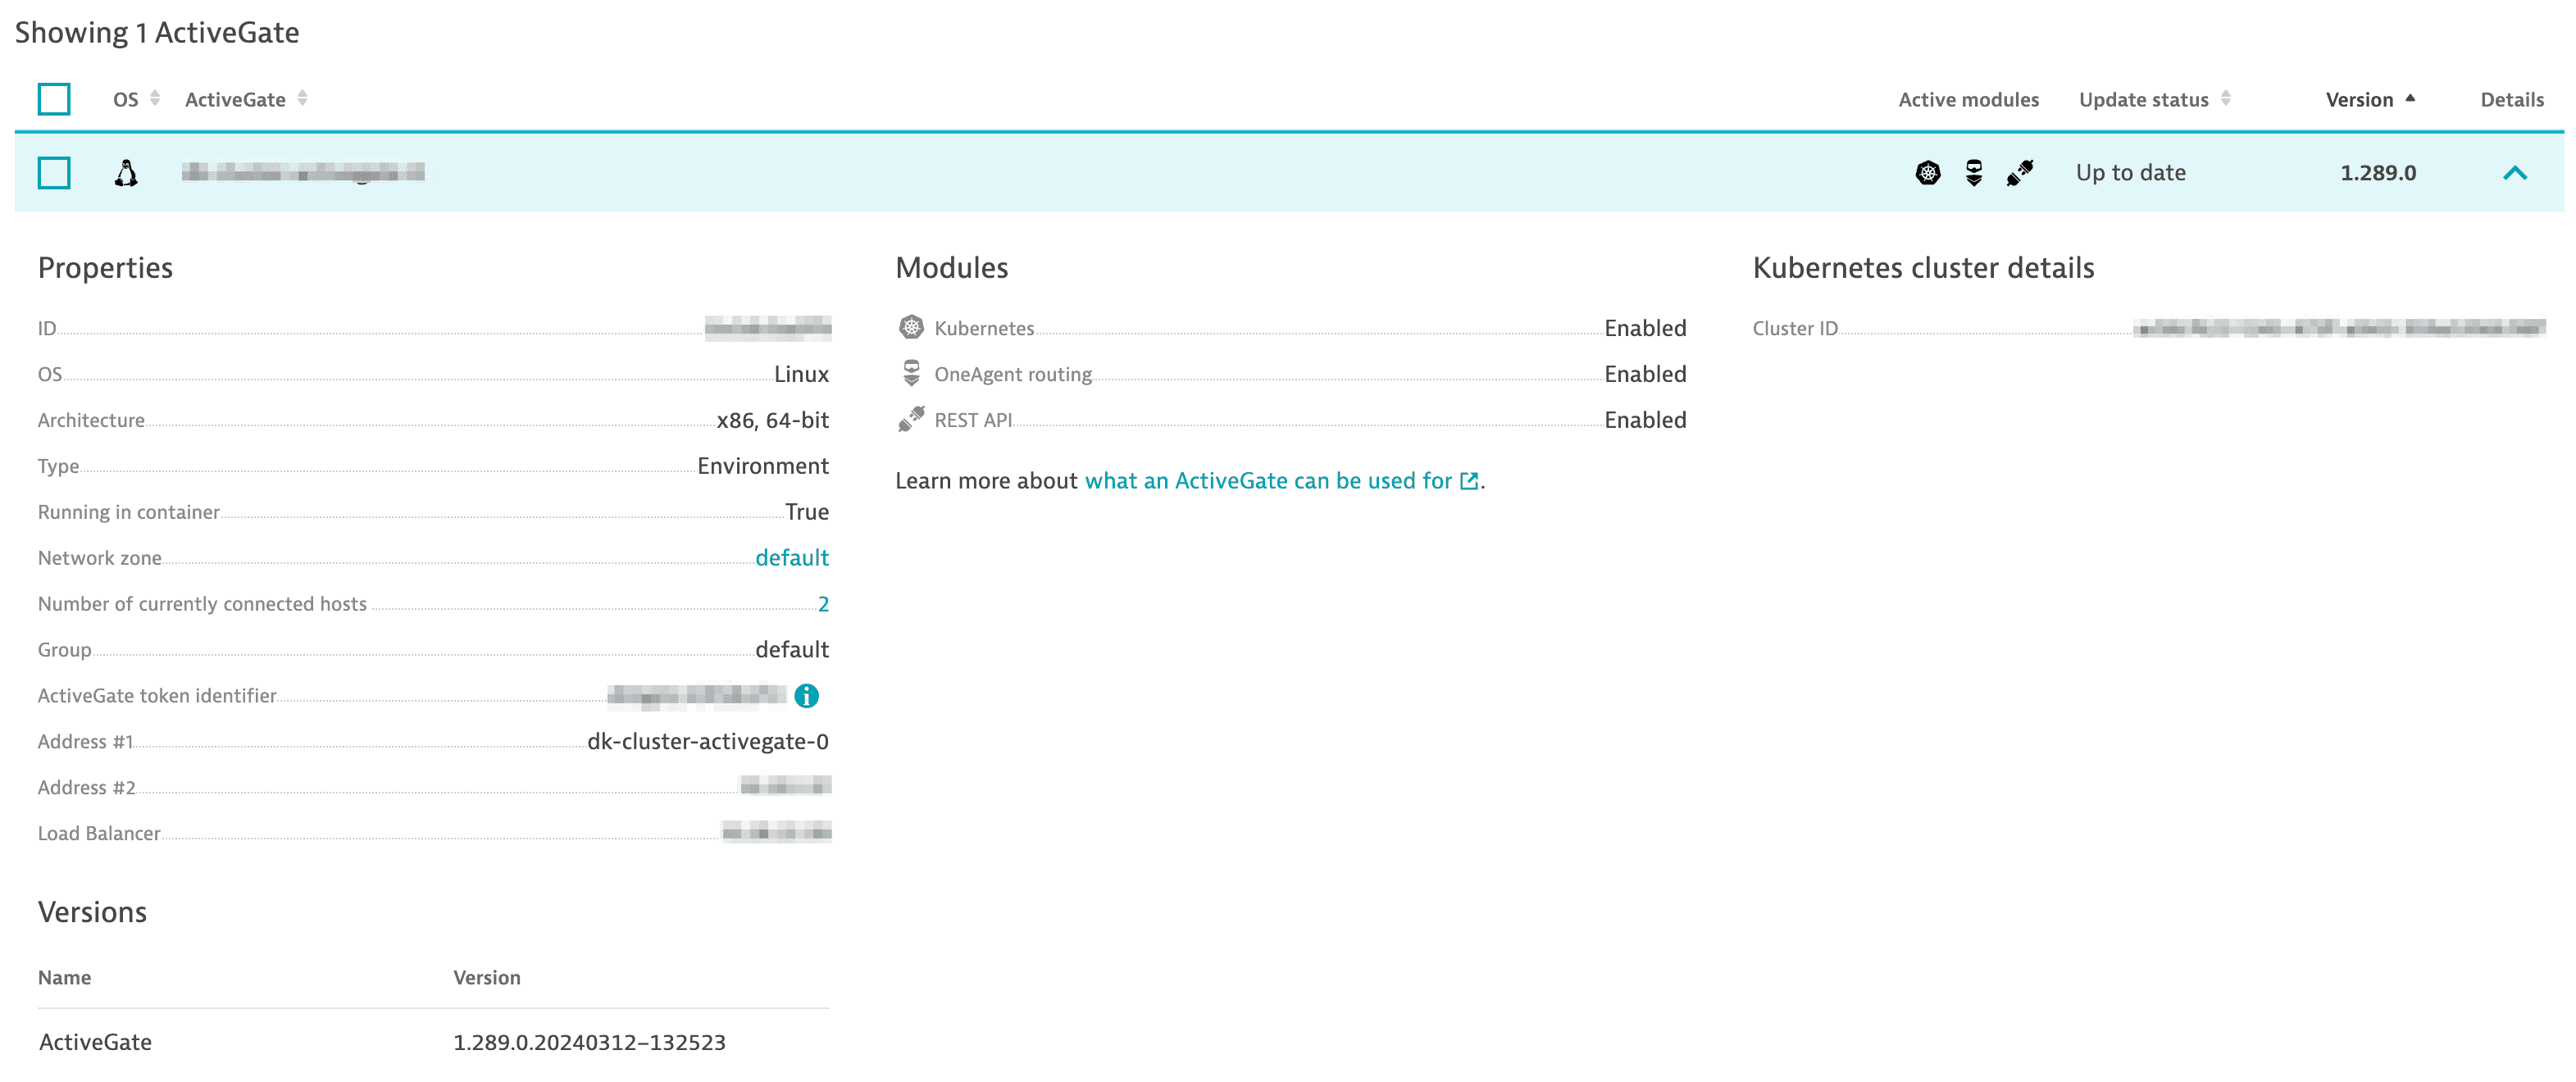
- Go to Deployment Status > ActiveGates and expand the details of the designated ActiveGate.
- In the Properties section, make sure that the ActiveGate is assigned to a Group.
- In the Modules section, make sure that the Extensions 2.0 module is enabled.
If either of these properties needs to be changed, see Configuration properties and parameters of ActiveGate.
Any changes done via ActiveGate configuration files require a restart of the ActiveGate and Extensions Execution Controller (EEC) services.
Extension deployment
In Dynatrace Hub, select and install F5 BIG-IP.
Monitoring configuration
- Make sure the expected version is displayed in the Versions list at the bottom of the page.
- Add your monitoring configuration by selecting Add monitoring configuration.
Define devices
Select Add device to define the devices from which you want to pull data and provide the device connection details:
IP address or device name
Port
SNMP version and related authentication details
ActiveGate group
Choose the ActiveGate group to determine which ActiveGates will run the extension. When done, select Next step.
Customize the monitoring
The next step in extension activation is to customize monitoring. See the complete list of feature sets and the metrics collected.
Filters match entity names to include/exclude instances from monitoring. This makes the data more relevant and saves unnecessary license consumption. Filters work with a specific entity type and support the following syntax:
$eq(<str>)– check if<str>matches what you're filtering$prefix(...)– must begin with …$suffix(...)- must end with …$contains(...)– must contain …$and(<expr1>, <expr2>)– can be used to chain two or more of the above expressions with AND operator$or(<expr1>, <expr2>)– can be used to chain two or more of the above expressions with OR operator$not(<expr>)– can be used to negate an expression
For example, to exclude all Pools from the Common partition, you can add a filter: $not($prefix(/Common/))
The final step is to select Activate, which will communicate the monitoring configuration to the ActiveGate along with the extension that defines how data is being collected.
Data visualization and configuration
The extension is packaged with an overview dashboard that is published as soon as you add it to your environment. Go to Dashboards or Dashboards Classic (latest Dynatrace) and look for a preset dashboard called F5 BIGIP LTM Overview.
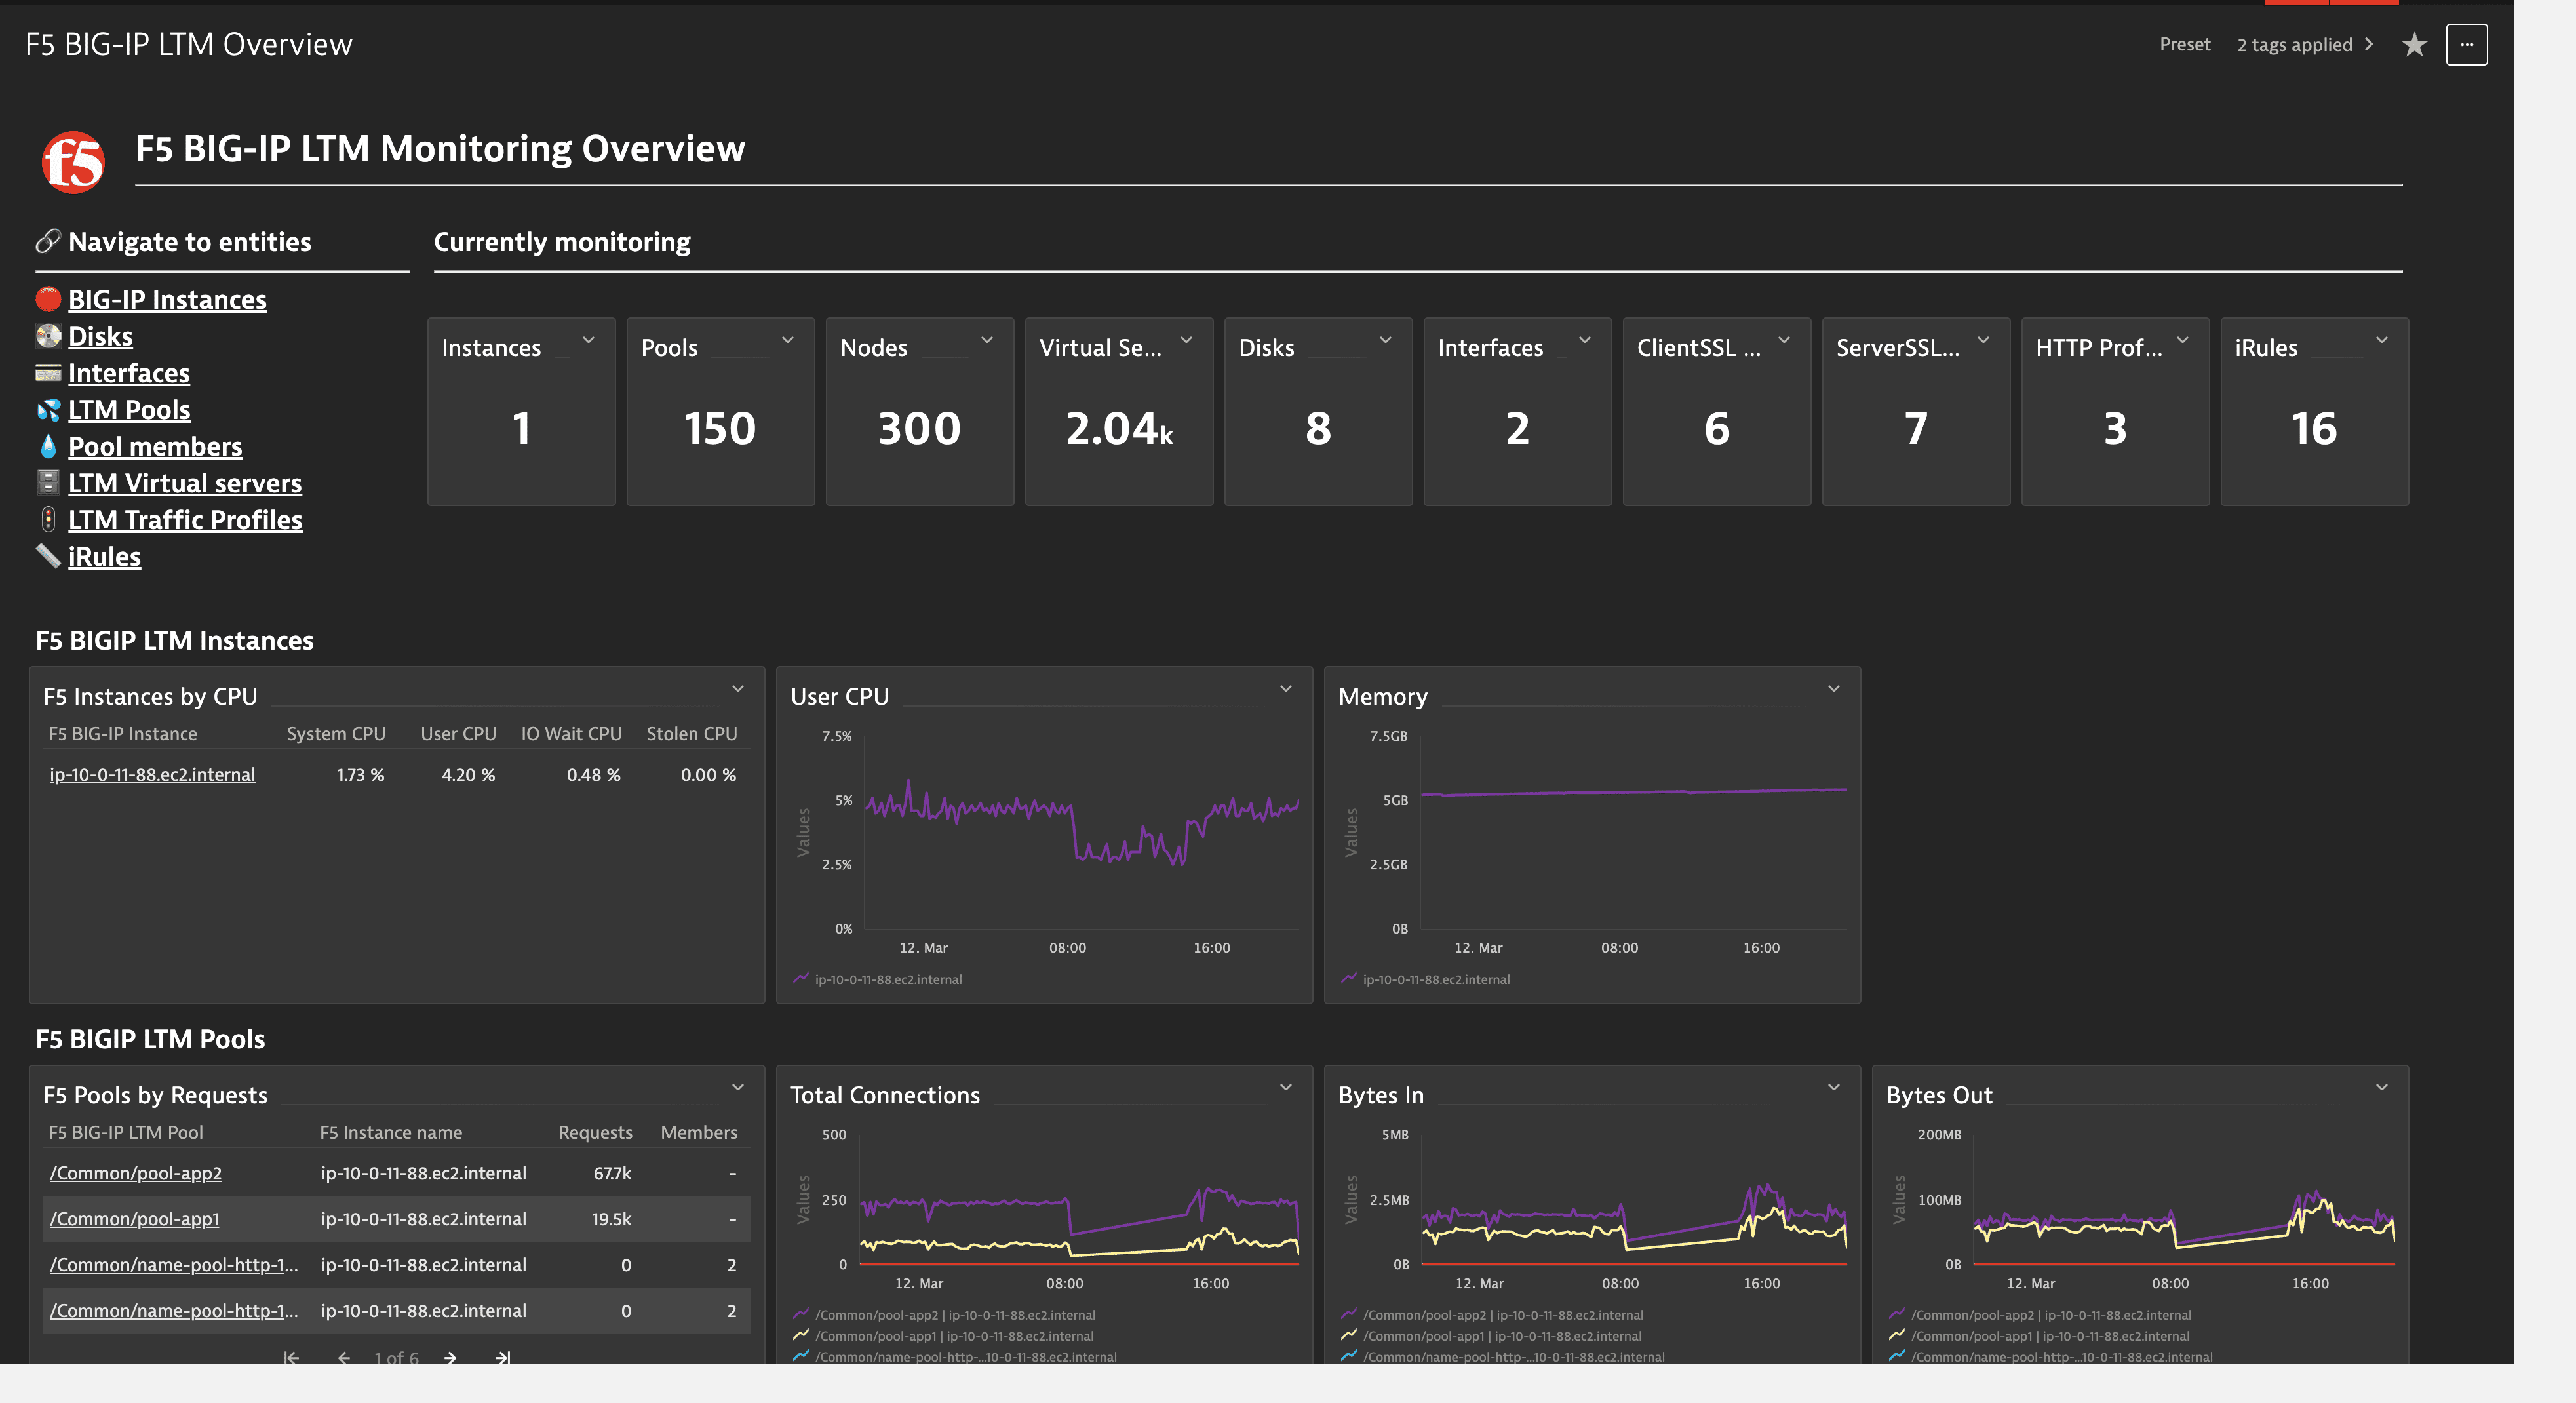
The dashboard gives an overview into the main components of the platform, as well as shortcuts to the lists of different entity types (in the Navigate to F5 entities section). This is currently the quickest way to navigate to the lists of entities. Otherwise, you can manually add the path into your URL bar: .../ui/entity/list/<entity-type>
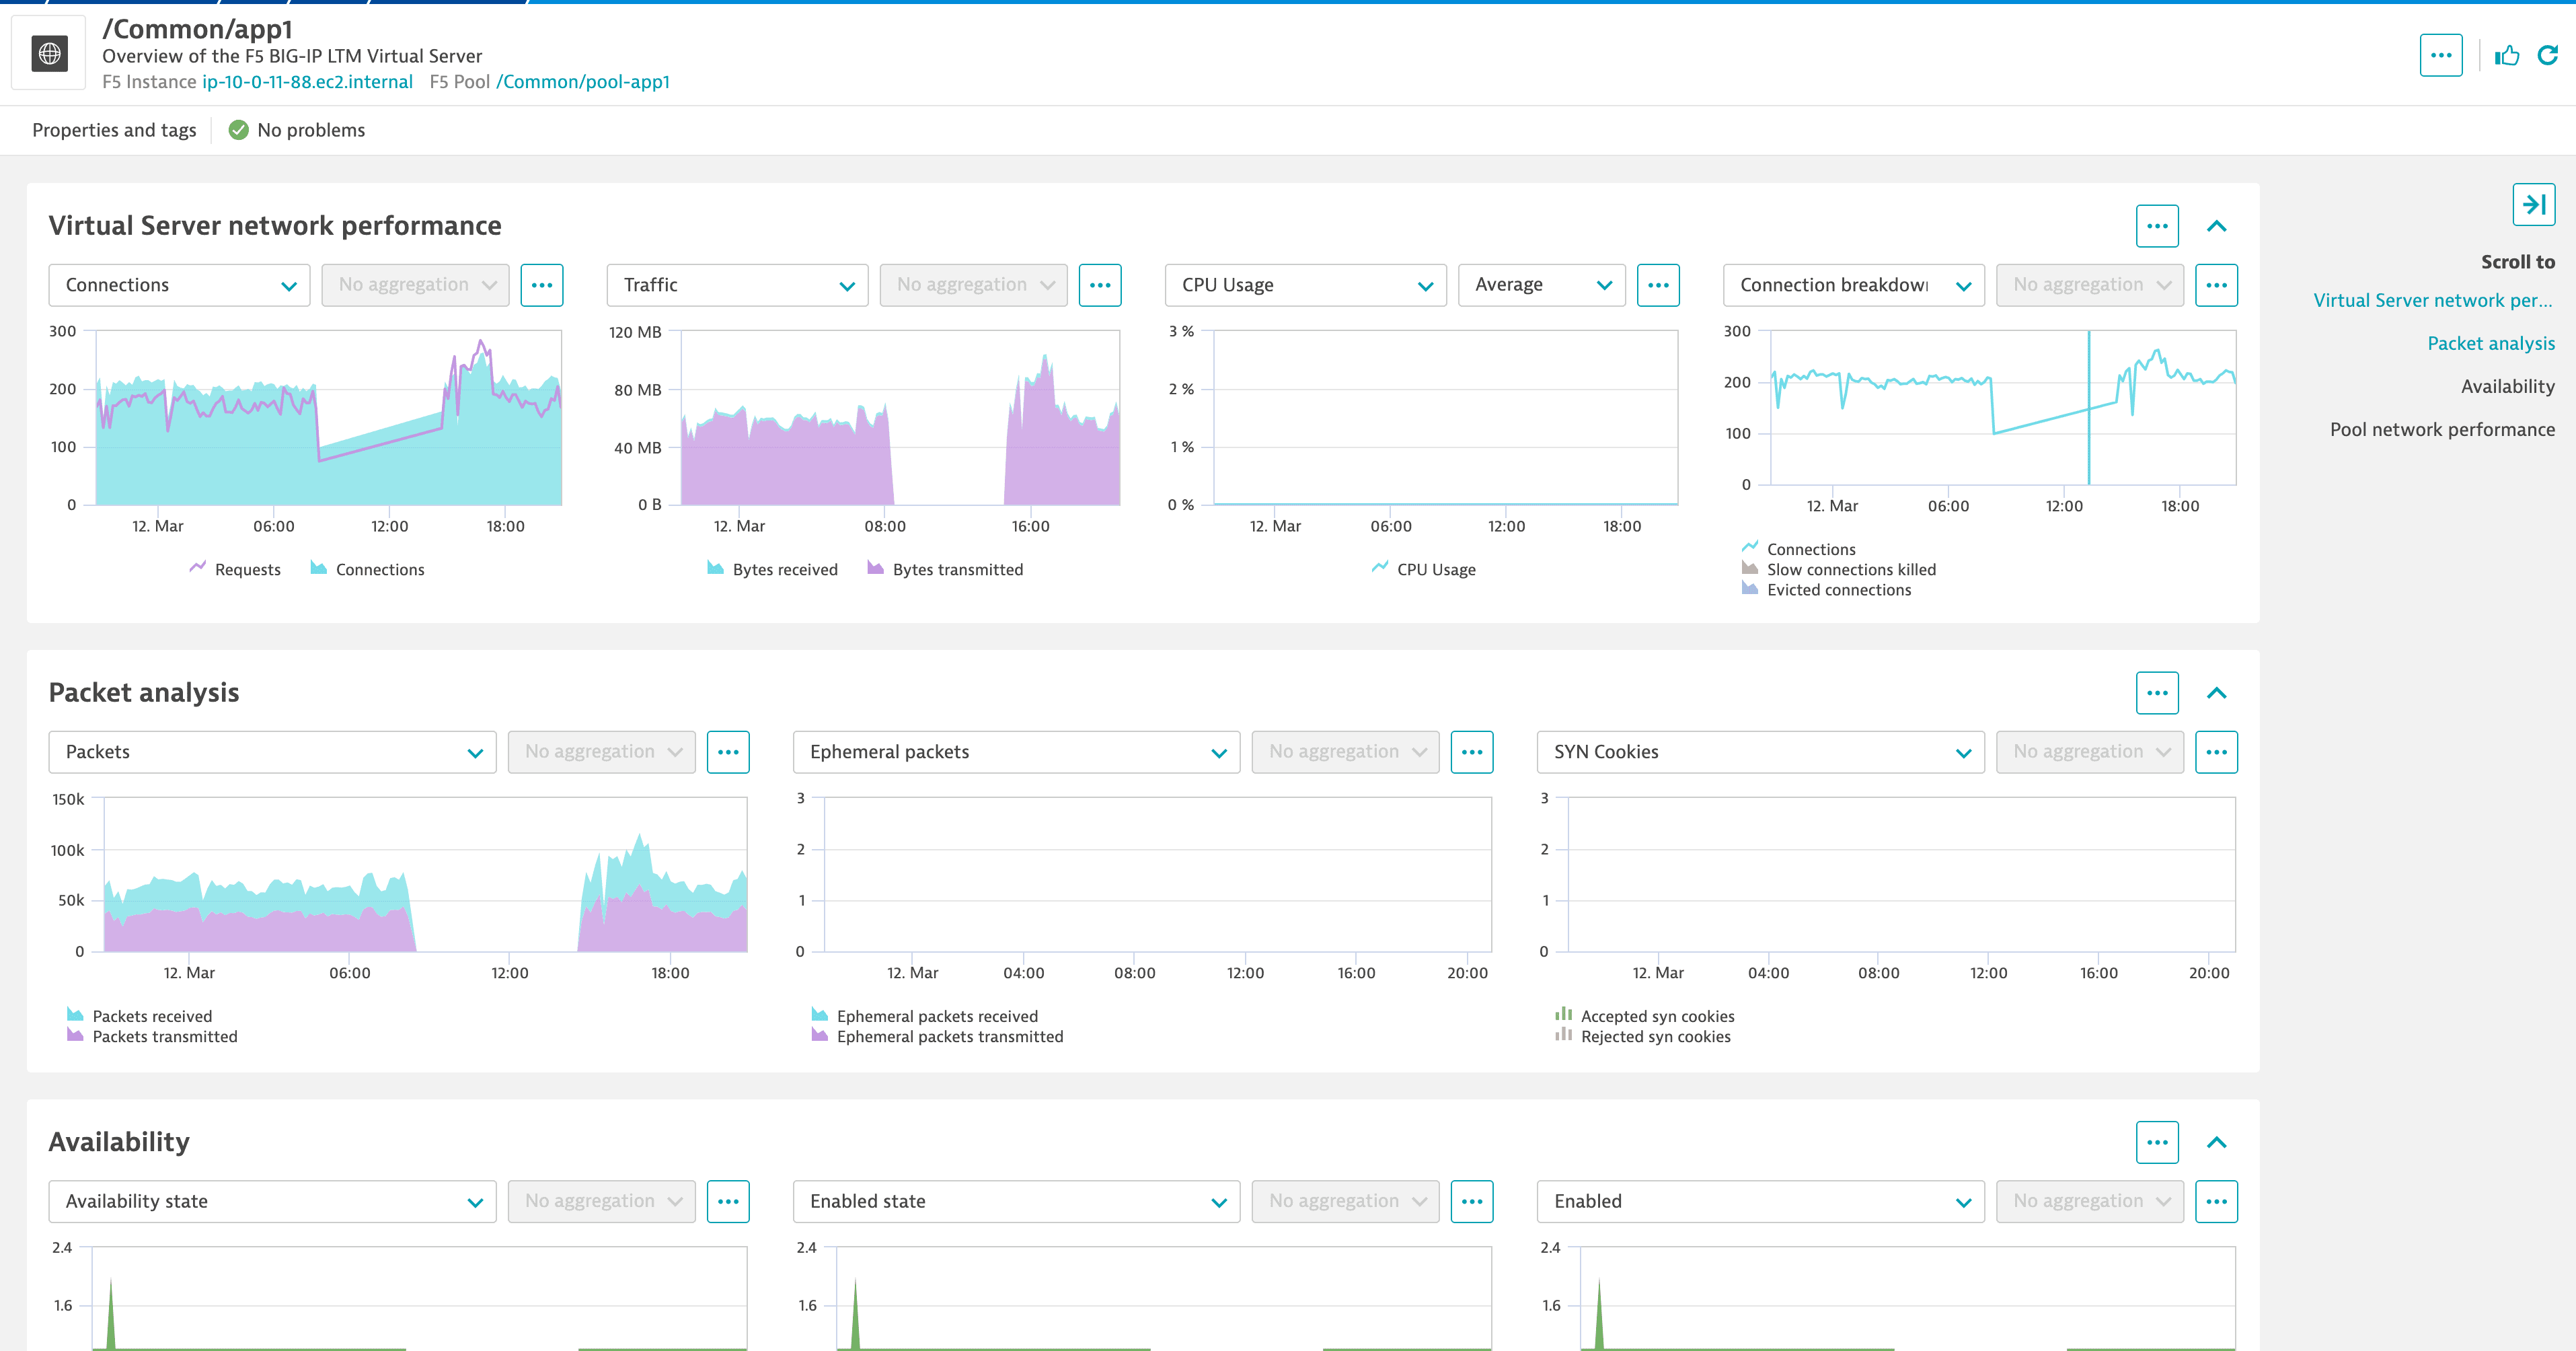
Access individual entities from a list or by drilling down from one of the charts in order to get the full details:
Metrics
See the metrics collected by the extension broken down into feature sets
-
N/A
| Metric name | Metric key | Description |
|---|---|---|
System uptime | sys.uptime.sec | The system up time since boot |
-
instance-memory-basic
| Metric name | Metric key | Description |
|---|---|---|
Total memory | sys.host.memory.total | The total host memory in bytes (not including TMM) for a single host system. |
Memory used (%) | sys.host.memory.used.percent | The total memory usage of the host system. |
Used memory | sys.host.memory.used | The host memory in bytes currently in use (not including TMM) for a single host system. |
-
instance-memory-advanced
| Metric name | Metric key | Description |
|---|---|---|
Total swap | mem.total.swap | The total amount of swap space configured for this host. |
Available swap | mem.avail.swap | The amount of swap space currently unused or available. |
Shared memory | mem.shared | The total amount of real or virtual memory currently allocated for use as shared memory. This object will not be implemented on hosts where the underlying operating system does not explicitly identify memory as specifically reserved for this purpose. |
Cached memory | mem.cached | The total amount of real or virtual memory currently allocated for use as cached memory. This object will not be implemented on hosts where the underlying operating system does not explicitly identify memory as specifically reserved for this purpose. |
Buffer memory | mem.buffer | The total amount of real or virtual memory currently allocated for use as memory buffers. This object will not be implemented on hosts where the underlying operating system does not explicitly identify memory as specifically reserved for this purpose. |
-
instance-sync
| Metric name | Metric key | Description |
|---|---|---|
Failover status | sys.cm.failover.status.id | The failover status ID on the system.
|
Sync status | sys.cm.sync.status.id | The sync status ID on the system. |
-
instance-cpu-basic
| Metric name | Metric key | Description |
|---|---|---|
Idle CPU | sys.global.host.cpu.idle1m | The average time spent by the specified processor doing nothing for the system in the last one minute. |
IO Wait CPU | sys.global.host.cpu.iowait1m | The average time spent by the specified processor waiting for external I/O to complete for the system in the last one minute. |
IRQ CPU | sys.global.host.cpu.irq1m | The average time spent by the specified processor servicing hardware interrupts for the system in the last one minute. |
Soft IRQ CPU | sys.global.host.cpu.softirq1m.count | The average time spent by the specified processor servicing soft interrupts for the system in the last one minute. |
Stolen CPU | sys.global.host.cpu.stolen1m | The average time 'stolen' from the system in the last one minute. |
System CPU | sys.global.host.cpu.system1m | The average time spent by the specified processor servicing system calls for the system in the last one minute. |
User CPU | sys.global.host.cpu.user1m | The average time spent by the specified processor in user context for the system in the last one minute. |
-
disk
| Metric name | Metric key | Description |
|---|---|---|
Block size | sys.host.disk.block.size | The number of bytes in the specified partition. |
Total blocks | sys.host.disk.total.blocks | The number of total blocks in the specified partition. |
Free blocks | sys.host.disk.free.blocks | The number of total blocks in the specified partition. |
Free Disk (%) | sys.host.disk.free.percent | The percentage disk free (available) for a specific partition. |
Used Disk (%) | sys.host.disk.used.percent | The percentage disk used for a specific partition. |
Free Disk | sys.host.disk.free.byte | The total amount of free disk space for a specific partition. |
Used Disk | sys.host.disk.used.byte | The total amount of used disk space for a specific partition. |
-
interface
| Metric name | Metric key | Description |
|---|---|---|
Status | sys.interface.status | The current state of the specified interface. |
Bytes received | sys.interface.stat.bytes.in.count | The number of bytes received on the specified interface. |
Bytes transmitted | sys.interface.stat.bytes.out.count | The number of bytes transmitted out of the specified interface. |
Packets received | sys.interface.stat.pkts.in.count | The number of packets received on this interface. |
Packets transmitted | sys.interface.stat.pkts.out.count | The number of packets transmitted out of the specified interface. |
Dropped incoming packets | sys.interface.stat.drops.in.count | The number of packets dropped on ingress for various reasons on the specified interface. |
Dropped outgoing packets | sys.interface.stat.drops.out.count | The number of packets aged out or with excessive transmission delays due to multiple deferrals on the specified interface. |
Incoming errors | sys.interface.stat.errors.in.count | The number of received packets that are either undersized, oversized, or have FCS errors by the specified interface. |
Outgoing errors | sys.interface.stat.errors.out.count | The number of excessive collisions, incremented for each frame that experienced 16 collisions during transmission and was aborted on the specified interface. |
-
pool-basic
| Metric name | Metric key | Description |
|---|---|---|
Requests | pool.stat.tot.requests.count | The total number of requests to the specified pool. |
Connections | pool.stat.server.tot.conns.count | The total connections from server-side to the specified pool. |
Current sessions | pool.stat.cur.sessions | The current number of sessions to the specified pool. |
Active members | pool.active.member.cnt | The number of the current active members in the specified pool. |
Members | pool.member.cnt | The total number of members in the specified pool. |
Enabled state | pool.enablestate | The activity status of the specified pool, as specified by the user. Can be none (0), enabled (1), disabled (2), disabledbyparent(3). |
-
pool-advanced
| Metric name | Metric key | Description |
|---|---|---|
Bytes received | pool.stat.server.bytes.in.count | The number of bytes received by the specified pool from server-side. |
Bytes transmitted | pool.stat.server.bytes.out.count | The number of bytes sent to server-side from the specified pool. |
Packets received | pool.stat.server.pkts.in.count | The number of packets received by the specified pool from server-side. |
Packets transmitted | pool.stat.server.pkts.out.count | The number of packets sent to server-side from the specified pool. |
-
node-basic
| Metric name | Metric key | Description |
|---|---|---|
Monitor status | node.monitor.status | The hierarchical load balance state for the specified node address, including parent status - unchecked(0), checking(1), inband(2), up(3), addr-down(18), down(19), forced-down(20), maint(21), irule-down(22), inband-down(23), down-manual-resume(24) |
Enabled state | node.enablestate | The activity status of the specified pool member, as specified by the user. |
Availability state | node.availstate | The state of the specified pool member availability indicated in color. Mapped as none(0), green(1), yellow(2), red(3), blue(4), gray(5) |
Requests | node.stat.tot.requests.count | The total number of requests going through the specified pool member. |
Connections | node.stat.server.tot.conns.count | The total connections from server-side to the specified pool member. |
-
node-advanced
| Metric name | Metric key | Description |
|---|---|---|
Bytes received | node.stat.server.bytes.in.count | The number of bytes received by the specified pool member from server-side. |
Bytes transmitted | node.stat.server.bytes.out.count | The number of bytes sent to server-side from the specified pool member. |
Packets received | node.stat.server.pkts.in.count | The number of packets received by the specified pool member from server-side. |
Packets transmitted | node.stat.server.pkts.out.count | The number of packets sent to server-side from the specified pool member. |
-
virtualserver-basic
| Metric name | Metric key | Description |
|---|---|---|
Enabled state | virtualserver.enabled | The state indicating whether the specified virtual server is enabled or not. |
Enabled state | virtualserver.status.enablestate | The activity status of the specified virtual server, as specified by the user. |
Availability state | virtualserver.status.availstate | The availability of the specified virtual server indicated in color. none - error; green - available in some capacity; yellow - not currently available; red - not available; blue - availability is unknown; gray - unlicensed. |
Requests | virtualserver.stat.tot.requests.count | The total number of requests going through the specified virtual server. |
CPU Usage | virtualserver.stat.vs.usage.ratio1m | The percentage of time Virtual Server was busy over the last 1 minute. |
Connections | virtualserver.stat.client.tot.conns.count | The total connections from client-side to the specified virtual server. |
Ephemeral connections | virtualserver.stat.ephemeral.tot.conns.count | The total ephemeral connections to the specified virtual server. |
Slow connections killed | virtualserver.stat.client.slow.killed.count | The number of slow client-side connections that have been killed on the specified virtual server. |
Evicted connections | virtualserver.stat.client.evicted.conns.count | The number of client-side connections that have been evicted on the specified virtual server. |
Accepted syn cookies | virtualserver.stat.wl.syncookie.accepts.count | The number of allowlist syn cookies received that were accepted. |
Rejected syn cookies | virtualserver.stat.wl.syncookie.rejects.count | The number of allowlist syn cookies received that were rejected. |
-
virtualserver-advanced
| Metric name | Metric key | Description |
|---|---|---|
Bytes received | virtualserver.stat.client.bytes.in.count | The number of bytes received by the specified virtual server from client-side. |
Ephemeral bytes received | virtualserver.stat.ephemeral.bytes.in.count | The number of bytes received ephemeral by the specified virtual server. |
Bytes transmitted | virtualserver.stat.client.bytes.out.count | The number of bytes sent to client-side from the specified virtual server. |
Ephemeral bytes transmitted | virtualserver.stat.ephemeral.bytes.out.count | The number of bytes transmitted ephemeral from the specified virtual server. |
Packets received | virtualserver.stat.client.pkts.in.count | The number of packets received by the specified virtual server from client-side. |
Ephemeral packets received | virtualserver.stat.ephemeral.pkts.in.count | The number of packets received ephemeral by the specified virtual server. |
Packets transmitted | virtualserver.stat.client.pkts.out.count | The number of packets sent to client-side from the specified virtual server. |
Ephemeral packets transmitted | virtualserver.stat.ephemeral.pkts.out.count | The number of packets transmitted ephemeral from the specified virtual server. |
-
profile-serverssl
| Metric name | Metric key | Description |
|---|---|---|
Common connections | profile.server.ssl.stat.tot.compat.conns.count | The total number of concurrent compat connections with established SSL sessions being maintained by the filter. |
Native connections | profile.server.ssl.stat.tot.native.conns.count | The total number of concurrent native connections with established SSL sessions being maintained by the filter. |
Fatal alerts | profile.server.ssl.stat.fatal.alerts.count | The total number of the fatal alerts. |
Secure handshakes | profile.server.ssl.stat.secure.handshakes.count | The number of handshakes, including mid-stream re-negotiations, performed with peers supporting SSL secure renegotiation. |
Handshake failures | profile.server.ssl.stat.handshake.failures.count | The total number of handshake failures. |
Insecure handshakes accepted | profile.server.ssl.stat.insecure.handshake.accepts.count | The number of handshakes, including mid-stream re-negotiations, performed with peers not supporting SSL secure renegotiation. |
Insecure handshakes rejected | profile.server.ssl.stat.insecure.handshake.rejects.count | The number of rejected initial handshakes with peers not supporting SSL secure renegotiation. |
Insecure renegotiations rejected | profile.server.ssl.stat.insecure.renegotiation.rejects.count | The number of rejected renegotiation attempts by peers not supporting SSL secure renegotiation. |
DTLSv1 connections | profile.server.ssl.stat.dtlsv1.count | The total connections for SSL DTLS protocol version 1. |
DTLSv2 connections | profile.server.ssl.stat.sslv2.count | The total connections for SSL protocol version 2. |
SSLv3 connections | profile.server.ssl.stat.sslv3.count | The total connections for SSL protocol version 3. |
TLSv1.1 connections.count | profile.server.ssl.stat.tlsv11 | The total connections for SSL TLS protocol version 1.1. |
TLSv1.2 connections | profile.server.ssl.stat.tlsv12.count | The total connections for SSL TLS protocol version 1.2. |
TLSv1 connections | profile.server.ssl.stat.tlsv1.count | The total connections for SSL TLS protocol version 1. |
Common connections | profile.client.ssl.stat.tot.compat.conns.count | The total number of concurrent compat connections with established SSL sessions being maintained by the filter. |
Native connections | profile.client.ssl.stat.tot.native.conns.count | The total number of concurrent native connections with established SSL sessions being maintained by the filter. |