OS services monitoring
OneAgent version 1.239+
Dynatrace version 1.240+
Dynatrace provides out-of-the-box availability monitoring of OS services.
Requirements
To monitor Linux services, systemd version 230+ is required on the monitored host.
Monitor a service
To monitor an OS service, perform the following steps.
Access OS services monitoring

Add service monitoring policy

Select services you want to monitor

Add custom properties

Access OS services monitoring
In Dynatrace, go to OS services monitoring for the level you are configuring.
- Go to Hosts or Hosts Classic (latest Dynatrace).
Find and select your host to display the host overview page.
- In the upper-right corner of the host overview page, select More (…) > Settings.
- In the host settings, select OS services monitoring.
- Go to Deployment Status and then select OneAgents.
- On the OneAgent deployment page, turn off Show new OneAgent deployments.
- Filter the table by
Host groupand select the host group you want to configure.This displays the OneAgent deployment page filtered by the selected host group. Each listed host has a Host group:The Host group property is not displayed when the selected host doesn't belong to any host group.
<group name>link, where<group name>is the name of the host group that you want to configure. - Select the host group name in any row.
As you have filtered by host group, all displayed hosts go to the same host group.
- In the host group settings, select OS services monitoring.
Go to Settings > Monitoring > OS services monitoring.
Add service monitoring policy
Based on the service state and the rules, the service monitoring policy defines the way Dynatrace is monitoring your service. By default, Dynatrace comes with Auto-start Windows OS Services and Auto-start Linux OS Services policies for auto-started Windows and Linux services with failed status.
The order of service monitoring policies is important. Policies that are higher on the list will proceed before those on lower positions until they are fulfilled. This allows for the creation of selective alerts or monitoring with minimal policies. If you want to monitor all auto-started services and not just those created by Microsoft, you need to add a policy with disabled alerting and/or monitoring that will verify if the manufacturer is Microsoft.
-
On OS services monitoring for the level you are configuring based on your OS, select Add policy and define the policy, which is a collection of rules.
-
System: select your operating system.
-
Rule name: enter the name that will be displayed in the Summary field.
-
Monitor: decide whether you want to monitor service availability using the OS service availability (
builtin:osservice.availability) metric. If available, the metric sends the service status every 10 seconds. The status is carried by the Service status (dt.osservice.status) dimension.
Note that the metric consumes DDUs. For more information, see DDU consumption. -
Alert: decide whether you want alerting for your policy.
-
OneAgent version 1.257+ Alert if service is not installed: whether you want to receive alerts about OS services that are not installed on the host.
-
Service status: set the service status for which an alert should be triggered.
-
optional OneAgent version 1.257+ Alerting delay: the number of 10-second measurement cycles for a service to be in configured state before an event is generated.
Next, you need to select which services you want to monitor based on service properties.
Select services you want to monitor
-
Select Add rule.
-
optional Rule scope: select either OS Service or Host. By default, the OS Service option is selected.
If you selected Host:
-
OneAgent version 1.277+ Custom metadata used for matching:
-
Key specifies the metadata key you want to match
-
Condition in which you can define a string that:
$contains(production)– Matches if production appears anywhere in the host metadata value.$eq(production)– Matches if production matches the host metadata value exactly.$prefix(production)– Matches if production matches the prefix of the host metadata value.$suffix(production)– Matches if production matches the suffix of the host metadata value.
Available logic operations:
$not($eq(production))– Matches if the host metadata value is different from production.$and($prefix(production),$suffix(main))– Matches if host metadata value starts with production and ends with main.$or($prefix(production),$suffix(main))– Matches if host metadata value starts with production or ends with main.
When including special characters such as brackets
(and)within your matching expressions, escape these characters with a tilde~. For example, to match a metadata value that includes brackets, likemy(amazing)property, you would write$eq(my~(amazing~)property).
-
If you selected OS Service, proceed according to your operating system.
Add custom properties optional
OneAgent version 1.247+
Dynatrace version 1.247+
-
Select Add property to specify a custom key-value property for the policy.
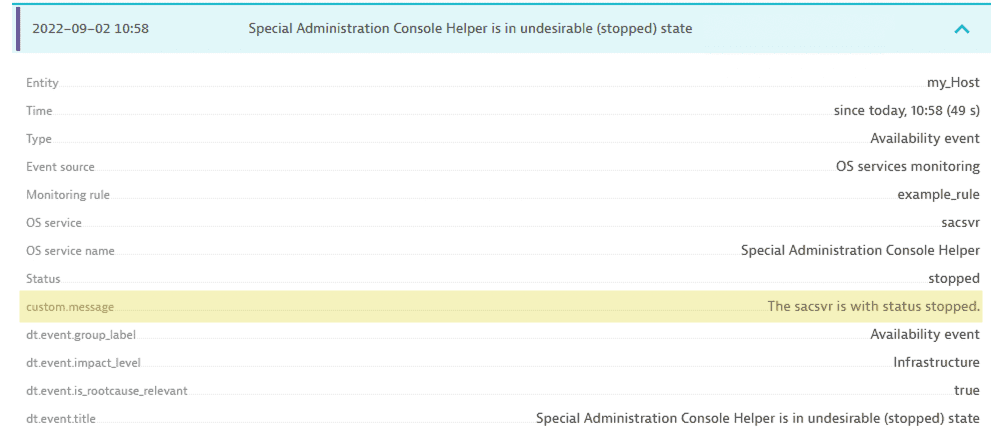
For example, a property with a Key set to
custom.messageand Value set toThe {dt.osservice.name} is with status {dt.osservice.status}(including placeholders{dt.osservice.name}and{dt.osservice.status}) will extract the OS service name and status values once the rule is triggered. If the placeholder substitution fails, both the key and the value will be unavailable.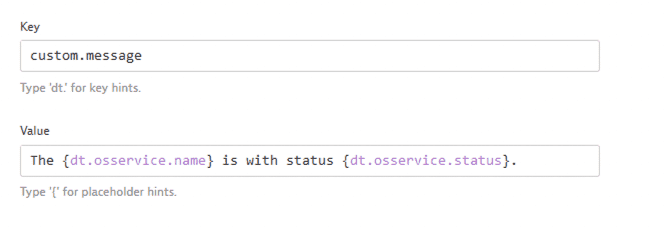
For OneAgent version 1.255+, the
{dt.osservice.display_name}placeholder is available. -
Select Save changes.
Configure automatically applied tags and management zones
Dynatrace version 1.257+
You need to manually configure automatically applied tags and management zones for OS service entities, as Dynatrace no longer automatically associates OS services with their respective hosts.
Manage monitored OS services
To manage the OS services
-
In Dynatrace, go to OS services monitoring for the level you are configuring.
- Go to Hosts or Hosts Classic (latest Dynatrace).
Find and select your host to display the host overview page.
- In the upper-right corner of the host overview page, select More (…) > Settings.
- In the host settings, select OS services monitoring.
- Go to Deployment Status and then select OneAgents.
- On the OneAgent deployment page, turn off Show new OneAgent deployments.
- Filter the table by
Host groupand select the host group you want to configure.This displays the OneAgent deployment page filtered by the selected host group. Each listed host has a Host group:The Host group property is not displayed when the selected host doesn't belong to any host group.
<group name>link, where<group name>is the name of the host group that you want to configure. - Select the host group name in any row.
As you have filtered by host group, all displayed hosts go to the same host group.
- In the host group settings, select OS services monitoring.
Go to Settings > Monitoring > OS services monitoring.
-
The OS services you monitor are displayed in a table under the Add policy button.
- To stop monitoring a listed service, turn the Enabled setting off.
- To delete a service from the table, select the delete button in the Delete column
- To view and edit details, select the expand control in the Details column.
Monitor service availability
Dynatrace version 1.243+
OneAgent version 1.243+
The Host overview page contains the OS services analysis section listing the OS services for which any policy (with active alerting or monitoring) is fulfilled.
- Go to Hosts or Hosts Classic (latest Dynatrace).
- In the OS services analysis section, select the service name to open the Service overview page.
For more information, see Host monitoring with Dynatrace
Configure at scale using Settings API
You can use the Settings API to configure your service availability monitoring at scale.
- To learn the schema, use GET a schema with
builtin:os-services-monitoringas the schemaId. - Based on the
builtin:os-services-monitoringschema, create your configuration object. - To create your configuration, use POST an object.