Monitor Prometheus metrics
Prometheus is an open-source monitoring and alerting toolkit which is popular in the Kubernetes community. Prometheus scrapes metrics from a number of HTTP(s) endpoints that expose metrics in the OpenMetrics format. See the list of available exporters in the Prometheus documentation.
Supported metric types
Dynatrace integrates gauge, counter, and summary metrics from Prometheus exporters in Kubernetes and makes them available for charting, alerting, and analysis. There is a limited support for histogram metrics.
Dynatrace ingests Prometheus counter metrics using delta encoding, i.e. the difference between previous and current metric values. The first data point serves as a starting point for this calculation and is not ingested itself. Only subsequent differences to previous values are ingested. As such, the value displayed in Dynatrace does not reflect the actual counter value, but instead its change over time. In order to receive the true value of a metric, a gauge metric should be used instead.
This process results in a counter metric appearing one minute after a gauge metric if scraping for both metrics started simultaneously. For details, see Metric ingestion protocol reference.
A summary datatype is ingested as three metrics:
- A gauge-based metric with the same name as the original exported metric (for example,
go_gc_duration_seconds), containing the buckets as dimensions - A counter-based metric for the sum, suffixed with
_sum.count(for example,go_gc_duration_seconds_sum.count) - A counter-based metric for the count, suffixed with
_count(for example,go_gc_duration_seconds_count)
For histogram support, a lightweight solution is provided, where a histogram datatype is ingested as two metrics:
- A counter-based metric for the sum, suffixed with
_sum.count(for example,pilot_proxy_convergence_time_sum.count) - A counter-based metric for the count, suffixed with
_count(for example,pilot_proxy_convergence_time_count)
Dynatrace does not support the following:
info, gaugehistogram, or stateset metrics
exemplars
Prerequisites
We recommend using an ActiveGate that is running inside the Kubernetes cluster which you want to scrape Prometheus metrics from. If the ActiveGate is running outside the monitored cluster (for example, in a virtual machine or in a different Kubernetes cluster), it won't be able to scrape any Prometheus endpoints on pods which require authentication (such as RBAC or client authentication). ActiveGates running inside the clusters will also provide performance improvements.
-
In Dynatrace, go to your Kubernetes cluster monitoring settings page and enable
- Monitor Kubernetes namespaces, services, workloads, and pods
- Monitor annotated Prometheus exporters
-
Annotated pod definitions. For details, see below.
-
Verify that your network policies allow the ActiveGate to connect to the exporters.
For example, if you deployed the ActiveGate in your Kubernetes cluster using the Dynatrace Operator and you have annotated Prometheus exporters in the namespace
online-boutique, and you also have a network policy defined for this namespace, you need to make sure that the ActiveGate pod, located in thedynatracenamespace, can connect to the annotated Prometheus exporters in theonline-boutiquenamespace.
Annotate Prometheus exporter pods
Dynatrace collects metrics from any pods that are annotated with a metrics.dynatrace.com/scrape property set to true in the pod definition. This functionality applies to all pods across the entire Kubernetes cluster, regardless of whether the pod is running in a namespace that matches the Dynakube's namespace selector.
Depending on the actual exporter in a pod, you might need to set additional annotations to the pod definition in order to allow Dynatrace to properly ingest those metrics.
Enable metrics scraping required
Set metrics.dynatrace.com/scrape to true to enable Dynatrace to collect Prometheus metrics exposed for this pod.
Metrics port required
By default, Prometheus metrics are available at the first exposed TCP port of the pod. Set metrics.dynatrace.com/port to the respective port.
To determine the port value, see Default port allocations for a list of common ports for known exporters.
Path to metrics endpoint optional
Use metrics.dynatrace.com/path to override the default (/metrics) Prometheus endpoint.
HTTP/HTTPS optional
Set metrics.dynatrace.com/secure to true if you want to collect metrics that are exposed by an exporter via HTTPS. The default value is false, because most exporters expose their metrics via HTTP.
If you want to skip verification of the TLS certificate (for example, if you use self-signed certificates), you can set the annotation
metrics.dynatrace.com/insecure_skip_verify to true. This annotation, however, is only considered when using an ActiveGate deployed inside the monitored cluster and the Kubernetes connection settings configured to monitor the local Kubernetes API endpoint.
Filter metrics optional
Use metrics.dynatrace.com/filter to define a filter that allows you to include ("mode": "include") or exclude ("mode": "exclude") a list of metrics. If no filter annotation is defined, all metrics are collected.
The filter syntax also supports the asterisk (*). This symbol allows you to filter metrics keys that begin with, end with, or contain a particular sequence, such as:
redis_db*filters all metrics starting withredis_db*insights*filters all metrics containinginsights*bytesfilters all metrics ending withbytes
Using the * symbol within a filter, such as redis_*_bytes, is not supported.
This example shows a simple pod definition with annotations.
The values of metrics.dynatrace.com/path, metrics.dynatrace.com/port, and metrics.dynatrace.com/secure depend on the exporter being used; adapt them to your requirements. To determine the port value, see Default port allocations for a list of common ports for known exporters.
apiVersion: v1kind: Podmetadata:name: mypodannotations:metrics.dynatrace.com/scrape: 'true'metrics.dynatrace.com/path: '/path/to-metrics'metrics.dynatrace.com/port: '9001'metrics.dynatrace.com/secure: 'false'metrics.dynatrace.com/filter: |{"mode": "include","names": ["redis_db_keys","*insights*","*bytes"]}spec:containers:- name: mycontainerimage: myregistry/myimage:mytag
Client authentication optional
Requirements: Add the permissions to access secrets and configmaps for the dynatrace-kubernetes-monitoring ClusterRole.
Some systems require extra authentication before Dynatrace can scrape them. For such cases, you can set the following additional annotations:
metrics.dynatrace.com/tls.ca.crtmetrics.dynatrace.com/tls.crtmetrics.dynatrace.com/tls.key
The required certificates/keys are automatically loaded from secret/configmaps specified in the annotation value.
The schema for the annotation values is <configmap|secret>:<namespace>:<resource_name>:<field_name_in_data_section>.
For example, the annotations could look as follows:
apiVersion: v1kind: Podmetadata:name: mypodannotations:metrics.dynatrace.com/scrape: 'true'metrics.dynatrace.com/path: '/path/to-metrics'metrics.dynatrace.com/port: '9001'metrics.dynatrace.com/secure: 'false'metrics.dynatrace.com/tls.ca.crt: 'configmap:kubernetes-config:etcd-metric-serving-ca:ca-bundle.crt'metrics.dynatrace.com/tls.crt: 'secret:kubernetes-config:etcd-metric-client:tls.crt'metrics.dynatrace.com/tls.key: 'secret:kubernetes-config:etcd-metric-client:tls.key'spec:containers:- name: mycontainerimage: myregistry/myimage:mytag
Ingesting metrics from exporters requiring client authentication is only possible with an ActiveGate deployed inside the monitored cluster and the Kubernetes connection settings configured to monitor the local Kubernetes API endpoint.
HTTP - Basic authentication optional
For systems that require basic HTTP authentication before scraping, you can apply the following additional annotations.
metrics.dynatrace.com/http.auth.basic.usernamemetrics.dynatrace.com/http.auth.basic.password
The following example shows two secrets created in the default namespace – one for a username and one for a password.
The aforementioned annotations are then used on a pod, with the secrets referenced in the annotation values.
apiVersion: v1kind: Secretmetadata:name: user-secretdata:username: bXktdXNlcm5hbWUtc2VjcmV0Cg==---apiVersion: v1kind: Secretmetadata:name: password-secretdata:password: bXktcGFzc3dvcmQtc2VjcmV0Cg==
apiVersion: v1kind: Podmetadata:name: mypodannotations:metrics.dynatrace.com/scrape: 'true'metrics.dynatrace.com/path: '/path/to-metrics'metrics.dynatrace.com/port: '9001'metrics.dynatrace.com/secure: 'false'metrics.dynatrace.com/http.auth.basic.username: 'secret:default:user-secret:username'metrics.dynatrace.com/http.auth.basic.password: 'secret:default:password-secret:password'spec:containers:- name: mycontainerimage: myregistry/myimage:mytag
Ingesting metrics from exporters requiring basic HTTP authentication is only possible with an ActiveGate deployed inside the monitored cluster and the Kubernetes connection settings configured to monitor the local Kubernetes API endpoint.
Role-based access control (RBAC) authorization for metric ingestion
Exporter pods such as node-exporter, kube-state-metrics, and openshift-state-metrics require RBAC authorization. For these pods, add the annotation:
metrics.dynatrace.com/http.auth: 'builtin:default'
This annotation applies the token from the dynatrace-kubernetes-monitoring service account as an authorization header for requests to the exporter.
Ingesting metrics from exporters requiring RBAC authorization is only possible with an ActiveGate deployed inside the monitored cluster and the Kubernetes connection settings configured to monitor the local Kubernetes API endpoint.
For more information on how to annotate pods, see annotations best practices.
Annotate Kubernetes services
Requirements: Add the permission to access services for the dynatrace-kubernetes-monitoring ClusterRole (not needed for Dynatrace Operator users, as this is enabled by default in clusterrole-kubernetes-monitoring.yaml).
You can also annotate services instead of pods. Pods corresponding to the Kubernetes services are automatically discovered via the service label selector, causing scraping of all pods belonging to the service.
The service and its corresponding pods must be located in the same namespace.
- The
metrics.dynatrace.com/portannotation should specify the target port of the container pod within the service, not the service's own port, since the service is not used for proxying the scraping process.
For more information on how to annotate services, see Annotation best practices.
Annotation best practices
There are multiple ways to place annotations on pods or services. See below to decide which approach fits your scenario best.
Recommended if you have full control
If you have full control over the pod template or service definition, we recommend adding the annotations by editing these files. This is the most reliable way to ensure persistency of annotations. We recommend editing the pod template over editing the service definition, as this requires fewer permissions (for example, if you don't have access to services).
Pro: Annotations are persistent, so they don't need to be recreated if a pod is removed.
Options if you don't have full control
If you don't have full control over the pod template, you have the following options:
-
Annotate an existing service (in YAML)
Requirements: Have control over an existing YAML and permission to edit the existing Kubernetes service object.
Pro: Annotations are persistent.
Con: None.
Example:kind: ServiceapiVersion: v1metadata:name: dynatrace-monitoring-node-exporternamespace: kubernetes-monitoringannotations:metrics.dynatrace.com/port: '12071'metrics.dynatrace.com/scrape: 'true'metrics.dynatrace.com/secure: 'true'metrics.dynatrace.com/path: '/metrics'spec:ports:- name: dynatrace-monitoring-node-exporter-portport: 9100targetPort: 12071selector:app.kubernetes.io/name: node-exporter -
Create a new service (in YAML)
Requirements: The new service should be created with a name that preferably starts with thedynatrace-monitoring-prefix. This service must be in the same namespace as the pods, and have permission to create a Kubernetes service object. The service is preferably headless (clusterIPis set toNone) since it emphasizes that the service is not used for proxying.Pro: You have control over the original workload/service.
Con: A label selector sync is required. We support only the label selector.
Example:kind: ServiceapiVersion: v1metadata:name: dynatrace-monitoring-node-exporternamespace: kubernetes-monitoringannotations:metrics.dynatrace.com/port: '12071'metrics.dynatrace.com/scrape: 'true'metrics.dynatrace.com/secure: 'true'metrics.dynatrace.com/path: '/metrics'spec:ports:- name: dynatrace-monitoring-node-exporter-portport: 12071selector:app.kubernetes.io/name: node-exporterclusterIP: None -
Annotate an existing service (in CLI)
Requirements: Have permission to edit the existing Kubernetes service object.
Pro: No label selector sync is required.
Con: Annotations aren't persistent, so changes will overwrite the annotations. We support only the label selector. -
Annotate existing pods (in CLI)
Requirements: None.
Pro: You can quickly test metric ingestion.
Con: Annotations aren't persistent, so changes will overwrite the annotations.
View metrics on a dashboard
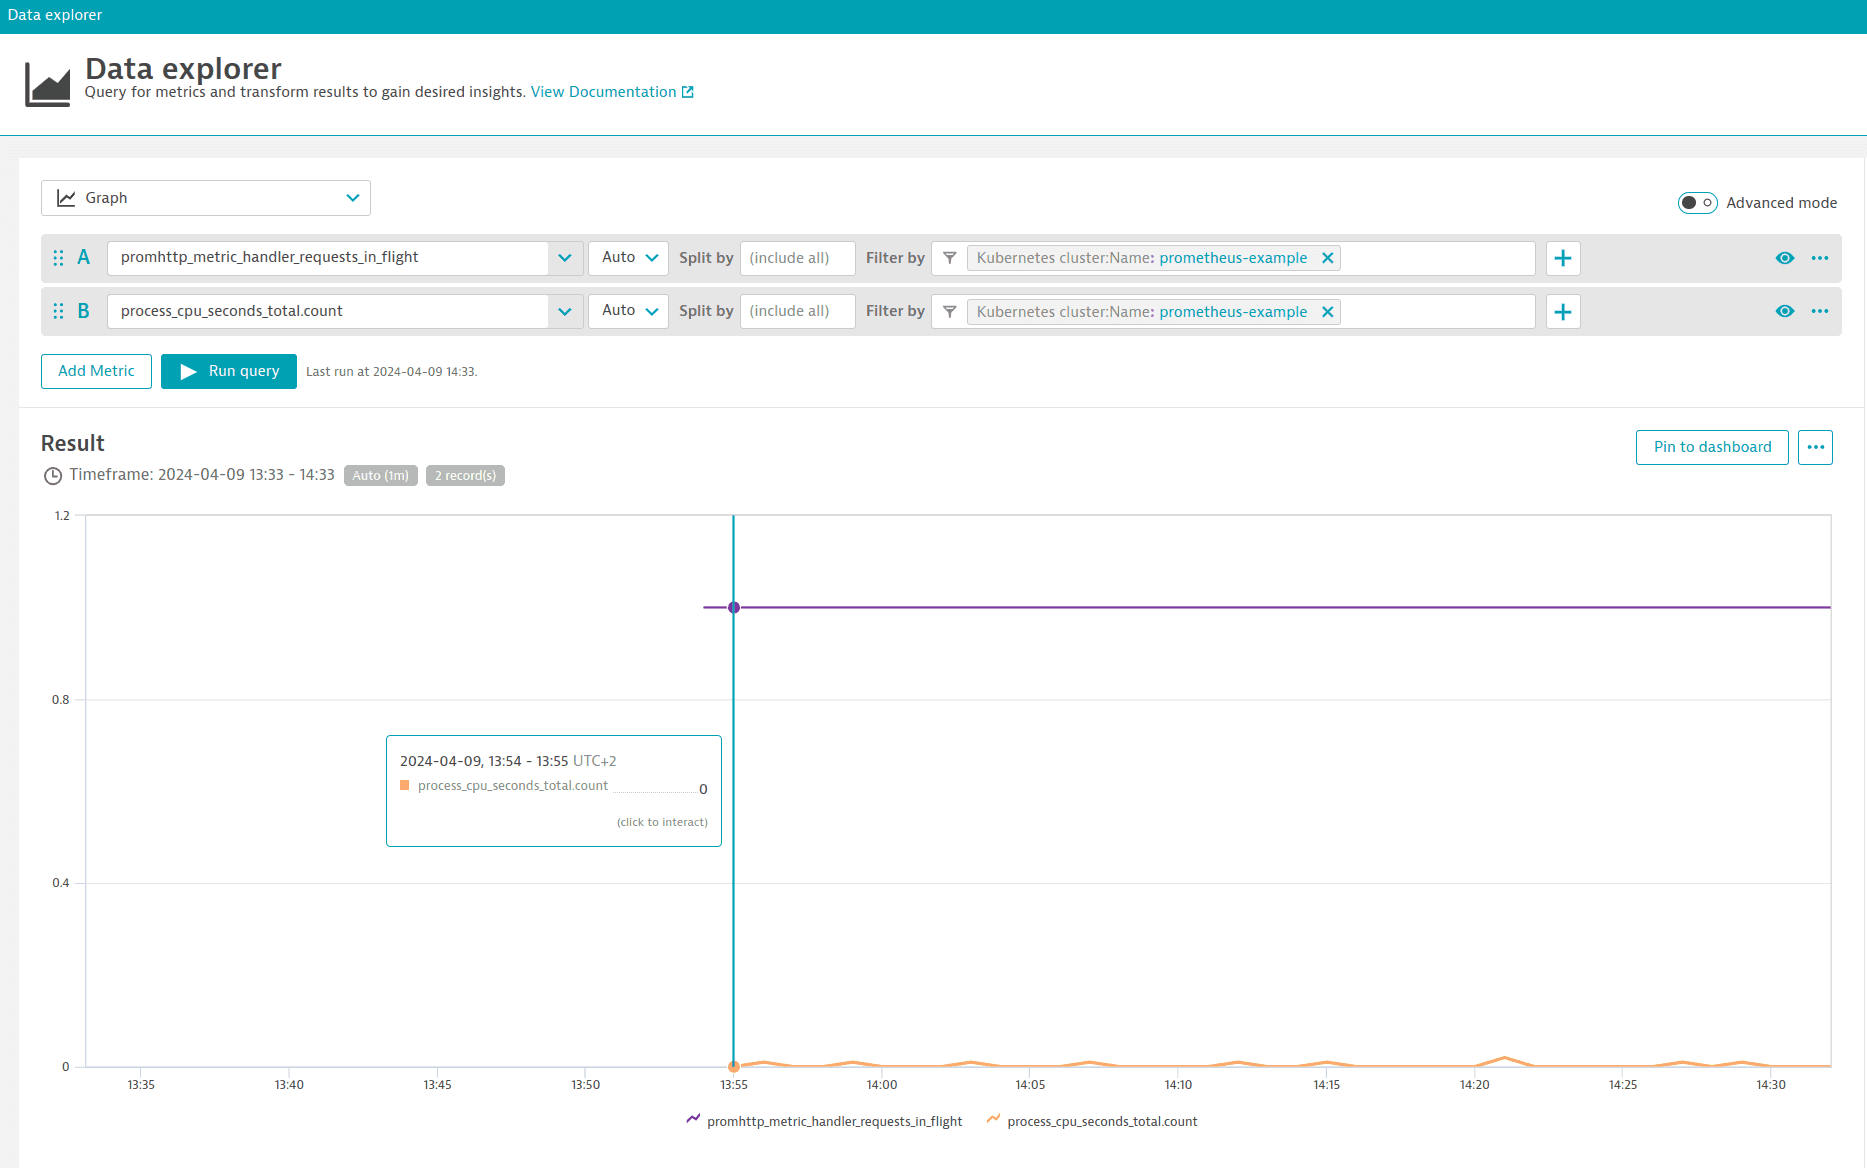
Metrics from Prometheus exporters are available in Data Explorer for custom charting. Select Create custom chart and select Try it out in the top banner. For more information, see Data Explorer.
You can simply search for metric keys of all available metrics and define how you’d like to analyze and chart your metrics. After that you can pin your charts on a dashboard.
Metric alerts
You can also create custom alerts based on the Prometheus scraped metrics. Go to Settings > Anomaly detection > Metric events and select Add metric event. In the Add metric event page, search for a Prometheus metric using its key and define your alert. For more information, see Metric events for alerting.
Limitations
The current limitations of the Prometheus metrics integration are as follows:
Multiple exporters in a pod
Multiple exporters currently aren't supported; you can only select the exporter that is being used with the metrics.dynatrace.com/port annotation.
Number of pods, metrics, and metric data points
This integration supports a maximum of
-
1,000 exporter pods
-
1,000 metrics per pod
-
200,000 metric data points per minute
Even though larger datasets are allowed, these can lead to ingestion gaps, as Dynatrace collects all metrics every minute before sending them to the cluster.
Monitoring methods
There are two distinct methods of monitoring technologies:
-
The first method involves using the Extensions 2.0 framework, which supports a handful of extensions for Prometheus exporters out of the box.
This method provides comprehensive monitoring features, including technology-specific dashboards, alerting capabilities, topology visualization, and entity pages. However, this method operates outside of Kubernetes.
-
The second method involves annotating Prometheus pods within Kubernetes to scrape Prometheus exporters.
While this method provides a more Kubernetes-native approach, it currently offers minimal functional overlap with the features provided by the Extensions 2.0 framework.
These two methods serve different contexts, work independently from each other, and don't share the same metrics.
Monitoring consumption
If you have DPS licensing, you can get more information about your environment's custom metric consumption from our licensing documentation.
- Full-Stack Monitoring includes a fixed number of custom metric data points for each GiB that contributes to your environment's GiB-hour consumption for containers with code-modules.
If you have Classic licensing, Prometheus metrics in Kubernetes environments are subject to DDU consumption.
- Prometheus metrics from exporters running on hosts monitored by OneAgent are first deducted from your quota of included metrics per host unit. After this quota is exceeded, any additional metrics consume DDUs.
- Prometheus metrics from exporters running on hosts not monitored by OneAgent always consume DDUs.
Troubleshoot
To troubleshoot Prometheus integration issues, download the Kubernetes Monitoring Statistics extension. For more information, see the community article on How to troubleshoot missing Prometheus metrics.