Alert on common Kubernetes/OpenShift issues
Dynatrace version 1.254+
ActiveGate version 1.253+
To alert on common Kubernetes platform issues, follow the instructions below.
Configure
There are three ways to configure alerts for common Kubernetes/OpenShift issues.
Configuring an alert on a different level is only intended to simplify the configuration of multiple entities at once. It does not change the behavior of an alert.
For example, enabling a workload CPU usage saturation alert will still evaluate and raise problems for each Kubernetes workload separately, even if it has been configured on the Kubernetes cluster level.
For further details on the settings hierarchy, see Settings documentation.
View alerts
You can view alerts
-
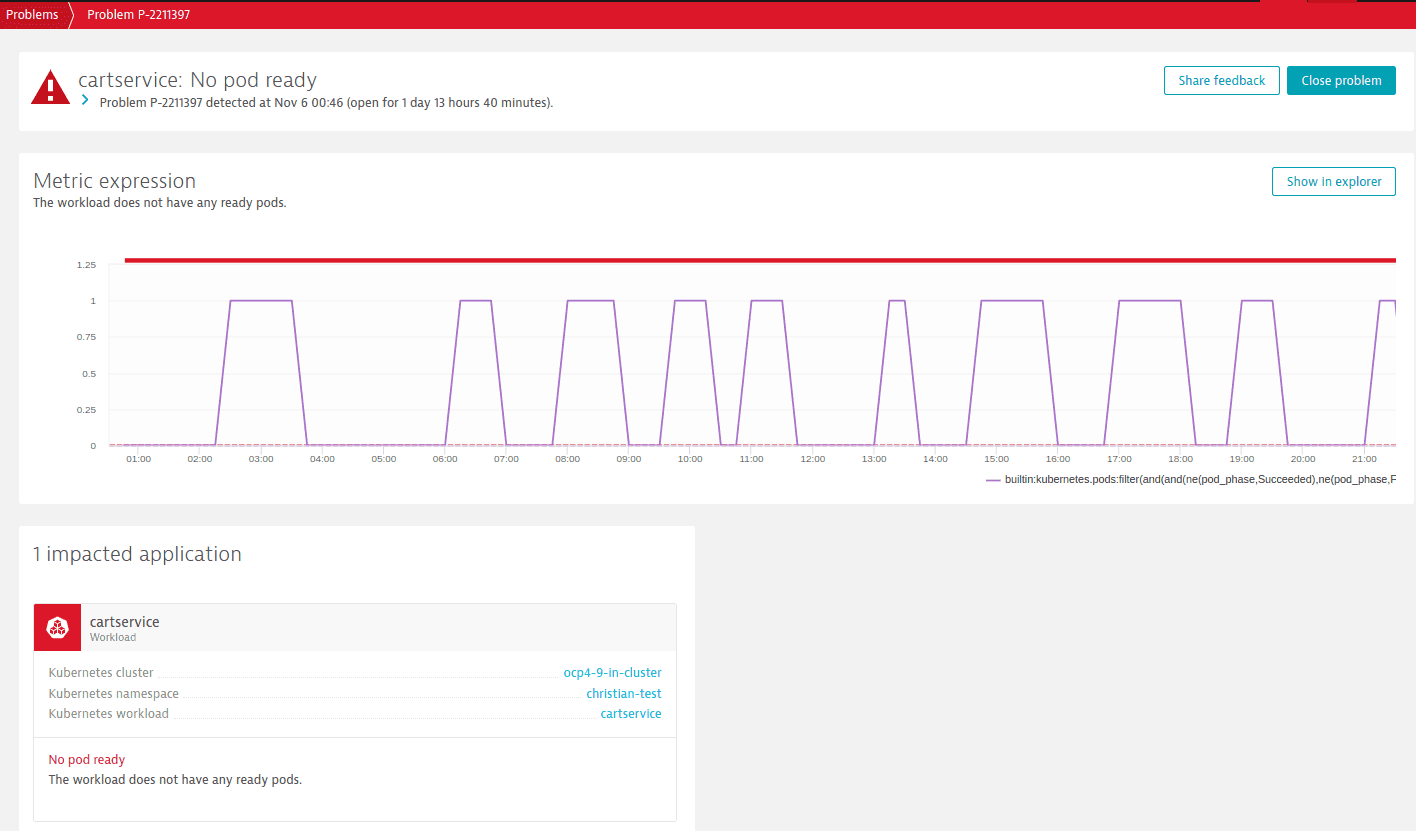
On the Problems page.
Example problem:
-
In the Events section of a cluster details page.
Example event:
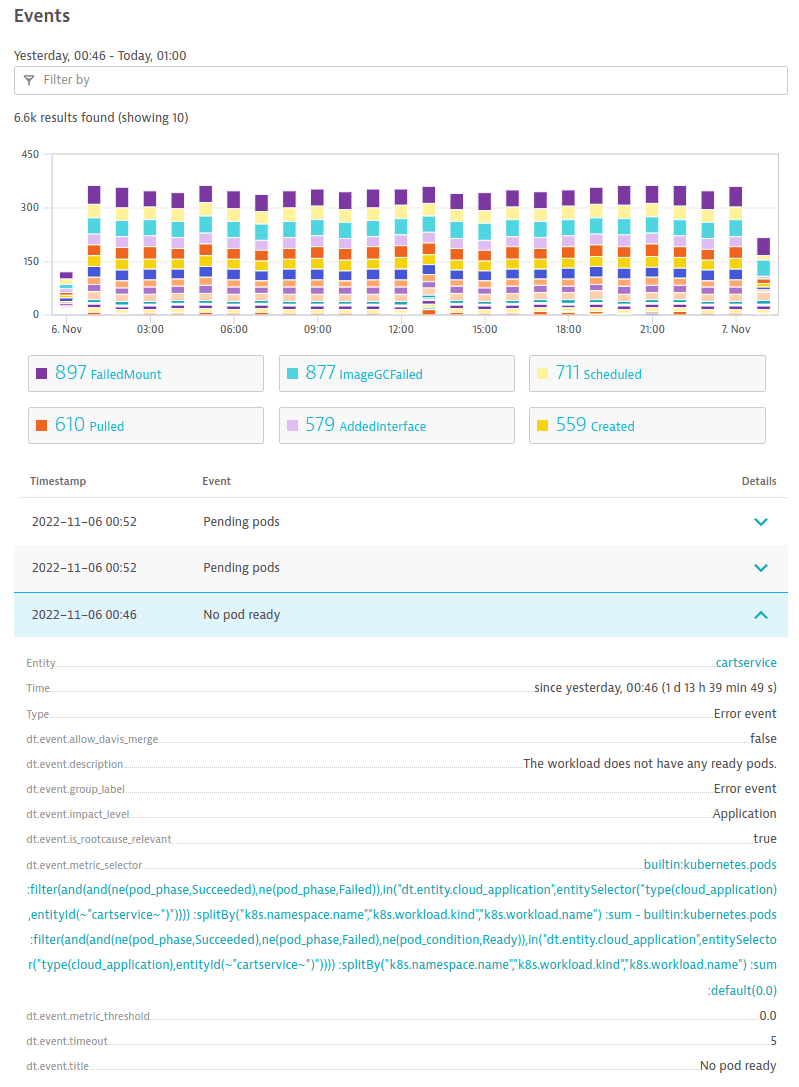
Select the event to navigate to Data Explorer for more information about the metric that generated the event.
Available alerts
See below for a list of available alerts.
Cluster alerts
| Alert name | Dynatrace version | Problem type | Problem title | Problem description | De-alerts after | Calculation | Supported in |
|---|---|---|---|---|---|---|---|
| Detect cluster CPU-request saturation | 1.254 | RESOURCE_CONTENTION_EVENT | CPU-request saturation on cluster | CPU-request saturation exceeds the specified threshold. | 5 minutes | Node CPU requests / Node CPU allocatable | Kubernetes Classic, Kubernetes app |
| Detect cluster memory-request saturation | 1.254 | RESOURCE_CONTENTION_EVENT | Memory-request saturation on cluster | Memory-request saturation exceeds the specified threshold. | 5 minutes | Node memory requests / Node memory allocatable | Kubernetes Classic, Kubernetes app |
| Detect cluster pod-saturation | 1.258 | RESOURCE_CONTENTION_EVENT | Pod saturation on cluster | Cluster pod-saturation exceeds the specified threshold. | 5 minutes | Sum of ready pods / Sum of allocatable pods | Kubernetes Classic, Kubernetes app |
| Detect cluster readiness issues | 1.254 | AVAILABILITY_EVENT | Cluster not ready | Readyz endpoint indicates that this cluster is not ready. | 5 minutes | Cluster readyz metric | Kubernetes Classic, Kubernetes app |
| Detect monitoring issues | 1.258 | AVAILABILITY_EVENT | Monitoring not available | Dynatrace API monitoring is not available. | 5 minutes | Kubernetes Classic, Kubernetes app |
Detect cluster CPU-request saturation
| Type | Expression |
|---|---|
| Metric expression | builtin:kubernetes.node.requests_cpu:splitBy():sum/builtin:kubernetes.node.cpu_allocatable:splitBy():sum*100.0 |
| DQL | timeseries o1=sum(dt.kubernetes.container.requests_cpu, rollup: avg), nonempty:true, filter: {(dt.kubernetes.container.type=="app")}, by: {}| join [timeseries operand=sum(dt.kubernetes.node.cpu_allocatable, rollup: avg), nonempty:true, by: {}], on: {interval}, fields: {o2=operand}| fieldsAdd result=o1[]/o2[]* 100.0| fieldsRemove {o1,o2} |
Detect cluster memory-request saturation
| Type | Expression |
|---|---|
| Metric expression | builtin:kubernetes.node.requests_memory:splitBy():sum/builtin:kubernetes.node.memory_allocatable:splitBy():sum*100.0 |
| DQL | timeseries o1=sum(dt.kubernetes.container.requests_memory, rollup: avg), nonempty:true, filter: {(dt.kubernetes.container.type=="app")}, by: {}| join [timeseries operand=sum(dt.kubernetes.node.memory_allocatable, rollup: avg), nonempty:true, by: {}], on: {interval}, fields: {o2=operand}| fieldsAdd result=o1[]/o2[]* 100.0| fieldsRemove {o1,o2} |
Detect cluster pod-saturation
| Type | Expression |
|---|---|
| Metric expression | (builtin:kubernetes.node.pods:filter(and(eq(pod_condition,Ready))):splitBy():sum/builtin:kubernetes.node.pods_allocatable:splitBy():sum):default(0.0)*100.0 |
| DQL | timeseries o1=sum(dt.kubernetes.pods, rollup: avg), nonempty:true, filter: {((pod_condition=="Ready"))}, by: {}| join [timeseries operand=sum(dt.kubernetes.node.pods_allocatable, rollup: avg), nonempty:true, by: {}], on: {interval}, fields: {o2=operand}| fieldsAdd result=if(isNull(o1[]/o2[]), 0.0, else: o1[]/o2[])* 100.0| fieldsRemove {o1,o2} |
Detect cluster readiness issues
| Type | Expression |
|---|---|
| Metric expression | builtin:kubernetes.cluster.readyz:splitBy():sum |
| DQL | timeseries {sum(dt.kubernetes.cluster.readyz, rollup: avg)}, by: {} |
Detect monitoring issues
| Type | Expression |
|---|---|
| Metric expression | (no metric expression) |
| DQL | (no DQL) |
Namespace alerts
| Alert name | Dynatrace version | Problem type | Problem title | Problem description | De-alerts after | Calculation | Supported in |
|---|---|---|---|---|---|---|---|
| Detect namespace CPU-limit quota saturation | 1.254 | RESOURCE_CONTENTION_EVENT | CPU-limit quota saturation | CPU-limit quota saturation exceeds the specified threshold. | 5 minutes | Sum of resource quota CPU used / Sum of resource quota CPU limits | Kubernetes Classic, Kubernetes app |
| Detect namespace CPU-request quota saturation | 1.254 | RESOURCE_CONTENTION_EVENT | CPU-request quota saturation | CPU-request quota saturation exceeds the specified threshold. | 5 minutes | Sum of resource quota CPU used / Sum of resource quota CPU requests | Kubernetes Classic, Kubernetes app |
| Detect namespace memory-limit quota saturation | 1.254 | RESOURCE_CONTENTION_EVENT | Memory-limit quota saturation | Memory-limit quota saturation exceeds the specified threshold. | 5 minutes | Sum of resource quota memory used / Sum of resource quota memory limits | Kubernetes Classic, Kubernetes app |
| Detect namespace memory-request quota saturation | 1.254 | RESOURCE_CONTENTION_EVENT | Memory-request quota saturation | Memory-request quota saturation exceeds the specified threshold. | 5 minutes | Sum of resource quota memory used / Sum of resource quota memory requests | Kubernetes Classic, Kubernetes app |
| Detect namespace pod quota saturation | 1.254 | RESOURCE_CONTENTION_EVENT | Pod quota saturation | Pod quota saturation exceeds the specified threshold. | 5 minutes | Sum of resource quota pods used / Sum of resource quota pods limit | Kubernetes Classic, Kubernetes app |
Detect namespace CPU-limit quota saturation
| Type | Expression |
|---|---|
| Metric expression | builtin:kubernetes.resourcequota.limits_cpu_used:splitBy(k8s.namespace.name):sum/builtin:kubernetes.resourcequota.limits_cpu:splitBy(k8s.namespace.name):sum*100.0 |
| DQL | timeseries {o1=sum(dt.kubernetes.resourcequota.limits_cpu_used, rollup: avg), o2=sum(dt.kubernetes.resourcequota.limits_cpu, rollup: avg)}, by: {k8s.namespace.name}| fieldsAdd result=o1[]/o2[]* 100.0| fieldsRemove {o1,o2} |
Detect namespace CPU-request quota saturation
| Type | Expression |
|---|---|
| Metric expression | builtin:kubernetes.resourcequota.requests_cpu_used:splitBy(k8s.namespace.name):sum/builtin:kubernetes.resourcequota.requests_cpu:splitBy(k8s.namespace.name):sum*100.0 |
| DQL | timeseries {o1=sum(dt.kubernetes.resourcequota.requests_cpu_used, rollup: avg), o2=sum(dt.kubernetes.resourcequota.requests_cpu, rollup: avg)}, by: {k8s.namespace.name}| fieldsAdd result=o1[]/o2[]* 100.0| fieldsRemove {o1,o2} |
Detect namespace memory-limit quota saturation
| Type | Expression |
|---|---|
| Metric expression | builtin:kubernetes.resourcequota.limits_memory_used:splitBy(k8s.namespace.name):sum/builtin:kubernetes.resourcequota.limits_memory:splitBy(k8s.namespace.name):sum*100.0 |
| DQL | timeseries {o1=sum(dt.kubernetes.resourcequota.limits_memory_used, rollup: avg), o2=sum(dt.kubernetes.resourcequota.limits_memory, rollup: avg)}, by: {k8s.namespace.name}| fieldsAdd result=o1[]/o2[]* 100.0| fieldsRemove {o1,o2} |
Detect namespace memory-request quota saturation
| Type | Expression |
|---|---|
| Metric expression | builtin:kubernetes.resourcequota.requests_memory_used:splitBy(k8s.namespace.name):sum/builtin:kubernetes.resourcequota.requests_memory:splitBy(k8s.namespace.name):sum*100.0 |
| DQL | timeseries {o1=sum(dt.kubernetes.resourcequota.requests_memory_used, rollup: avg), o2=sum(dt.kubernetes.resourcequota.requests_memory, rollup: avg)}, by: {k8s.namespace.name}| fieldsAdd result=o1[]/o2[]* 100.0| fieldsRemove {o1,o2} |
Detect namespace pod quota saturation
| Type | Expression |
|---|---|
| Metric expression | builtin:kubernetes.resourcequota.pods_used:splitBy(k8s.namespace.name):sum/builtin:kubernetes.resourcequota.pods:splitBy(k8s.namespace.name):sum*100.0 |
| DQL | timeseries {o1=sum(dt.kubernetes.resourcequota.pods_used, rollup: avg), o2=sum(dt.kubernetes.resourcequota.pods, rollup: avg)}, by: {k8s.namespace.name}| fieldsAdd result=o1[]/o2[]* 100.0| fieldsRemove {o1,o2} |
Node alerts
| Alert name | Dynatrace version | Problem type | Problem title | Problem description | De-alerts after | Calculation | Supported in |
|---|---|---|---|---|---|---|---|
| Detect node CPU-request saturation | 1.254 | RESOURCE_CONTENTION_EVENT | CPU-request saturation on node | CPU-request saturation exceeds the specified threshold. | 5 minutes | Sum of node CPU requests / Sum of node CPU allocatable | Kubernetes Classic, Kubernetes app |
| Detect node memory-request saturation | 1.254 | RESOURCE_CONTENTION_EVENT | Memory-request saturation on node | Memory-request saturation exceeds the specified threshold. | 5 minutes | Sum of node memory requests / Sum of node memory allocatable | Kubernetes Classic, Kubernetes app |
| Detect node pod-saturation | 1.254 | RESOURCE_CONTENTION_EVENT | Pod saturation on node | Pod saturation exceeds the specified threshold. | 5 minutes | Sum of running pods on node / Node pod limit | Kubernetes Classic, Kubernetes app |
| Detect node readiness issues | 1.254 | AVAILABILITY_EVENT | Node not ready | Node is not ready. | 5 minutes | Node condition metric filtered by 'not ready' | Kubernetes Classic, Kubernetes app |
| Detect problematic node conditions | 1.264 | ERROR_EVENT | Problematic node condition | Node has one or more problematic conditions out of the following: ContainerRuntimeProblem, ContainerRuntimeUnhealthy, CorruptDockerOverlay2, DiskPressure, FilesystemCorruptionProblem, FrequentContainerdRestart, FrequentDockerRestart, FrequentGcfsSnapshotterRestart, FrequentGcfsdRestart, FrequentKubeletRestart, FrequentUnregisterNetDevice, GcfsSnapshotterMissingLayer, GcfsSnapshotterUnhealthy, GcfsdUnhealthy, KernelDeadlock, KubeletProblem, KubeletUnhealthy, MemoryPressure, NetworkUnavailable, OutOfDisk, PIDPressure, ReadonlyFilesystem | 5 minutes | Nodes condition metric | Kubernetes Classic, Kubernetes app |
Detect node CPU-request saturation
| Type | Expression |
|---|---|
| Metric expression | builtin:kubernetes.node.requests_cpu:splitBy(dt.kubernetes.node.system_uuid,k8s.node.name):sum/builtin:kubernetes.node.cpu_allocatable:splitBy(dt.kubernetes.node.system_uuid,k8s.node.name):sum*100.0 |
| DQL | timeseries o1=sum(dt.kubernetes.container.requests_cpu, rollup: avg), nonempty:true, filter: {(dt.kubernetes.container.type=="app")}, by: {dt.kubernetes.node.system_uuid,k8s.node.name}| join [timeseries operand=sum(dt.kubernetes.node.cpu_allocatable, rollup: avg), nonempty:true, by: {dt.kubernetes.node.system_uuid,k8s.node.name}], on: {interval}, fields: {o2=operand}| fieldsAdd result=o1[]/o2[]* 100.0| fieldsRemove {o1,o2} |
Detect node memory-request saturation
| Type | Expression |
|---|---|
| Metric expression | builtin:kubernetes.node.requests_memory:splitBy(dt.kubernetes.node.system_uuid,k8s.node.name):sum/builtin:kubernetes.node.memory_allocatable:splitBy(dt.kubernetes.node.system_uuid,k8s.node.name):sum*100.0 |
| DQL | timeseries o1=sum(dt.kubernetes.container.requests_memory, rollup: avg), nonempty:true, filter: {(dt.kubernetes.container.type=="app")}, by: {dt.kubernetes.node.system_uuid,k8s.node.name}| join [timeseries operand=sum(dt.kubernetes.node.memory_allocatable, rollup: avg), nonempty:true, by: {dt.kubernetes.node.system_uuid,k8s.node.name}], on: {interval}, fields: {o2=operand}| fieldsAdd result=o1[]/o2[]* 100.0| fieldsRemove {o1,o2} |
Detect node pod-saturation
| Type | Expression |
|---|---|
| Metric expression | builtin:kubernetes.node.pods:filter(and(eq(pod_phase,Running))):splitBy(dt.kubernetes.node.system_uuid,k8s.node.name):sum/builtin:kubernetes.node.pods_allocatable:splitBy(dt.kubernetes.node.system_uuid,k8s.node.name):sum*100.0 |
| DQL | timeseries o1=sum(dt.kubernetes.pods, rollup: avg), nonempty:true, filter: {((pod_phase=="Running"))}, by: {dt.kubernetes.node.system_uuid,k8s.node.name}| join [timeseries operand=sum(dt.kubernetes.node.pods_allocatable, rollup: avg), nonempty:true, by: {dt.kubernetes.node.system_uuid,k8s.node.name}], on: {interval}, fields: {o2=operand}| fieldsAdd result=o1[]/o2[]* 100.0| fieldsRemove {o1,o2} |
Detect node readiness issues
| Type | Expression |
|---|---|
| Metric expression | builtin:kubernetes.node.conditions:filter(and(eq(node_condition,Ready),ne(condition_status,True))):splitBy(dt.kubernetes.node.system_uuid,k8s.node.name):sum |
| DQL | timeseries {sum(dt.kubernetes.node.conditions, rollup: avg)}, filter: {((node_condition=="Ready")AND(condition_status!=true))}, by: {dt.kubernetes.node.system_uuid,k8s.node.name} |
Detect problematic node conditions
| Type | Expression |
|---|---|
| Metric expression | builtin:kubernetes.node.conditions:filter(and(or(eq(node_condition,ContainerRuntimeProblem),eq(node_condition,ContainerRuntimeUnhealthy),eq(node_condition,CorruptDockerOverlay2),eq(node_condition,DiskPressure),eq(node_condition,FilesystemCorruptionProblem),eq(node_condition,FrequentContainerdRestart),eq(node_condition,FrequentDockerRestart),eq(node_condition,FrequentGcfsSnapshotterRestart),eq(node_condition,FrequentGcfsdRestart),eq(node_condition,FrequentKubeletRestart),eq(node_condition,FrequentUnregisterNetDevice),eq(node_condition,GcfsSnapshotterMissingLayer),eq(node_condition,GcfsSnapshotterUnhealthy),eq(node_condition,GcfsdUnhealthy),eq(node_condition,KernelDeadlock),eq(node_condition,KubeletProblem),eq(node_condition,KubeletUnhealthy),eq(node_condition,MemoryPressure),eq(node_condition,NetworkUnavailable),eq(node_condition,OutOfDisk),eq(node_condition,PIDPressure),eq(node_condition,ReadonlyFilesystem)),eq(condition_status,True))):splitBy(dt.kubernetes.node.system_uuid,k8s.node.name):sum |
| DQL | timeseries {sum(dt.kubernetes.node.conditions, rollup: avg)}, filter: {(((node_condition=="ContainerRuntimeProblem")OR(node_condition=="ContainerRuntimeUnhealthy")OR(node_condition=="CorruptDockerOverlay2")OR(node_condition=="DiskPressure")OR(node_condition=="FilesystemCorruptionProblem")OR(node_condition=="FrequentContainerdRestart")OR(node_condition=="FrequentDockerRestart")OR(node_condition=="FrequentGcfsSnapshotterRestart")OR(node_condition=="FrequentGcfsdRestart")OR(node_condition=="FrequentKubeletRestart")OR(node_condition=="FrequentUnregisterNetDevice")OR(node_condition=="GcfsSnapshotterMissingLayer")OR(node_condition=="GcfsSnapshotterUnhealthy")OR(node_condition=="GcfsdUnhealthy")OR(node_condition=="KernelDeadlock")OR(node_condition=="KubeletProblem")OR(node_condition=="KubeletUnhealthy")OR(node_condition=="MemoryPressure")OR(node_condition=="NetworkUnavailable")OR(node_condition=="OutOfDisk")OR(node_condition=="PIDPressure")OR(node_condition=="ReadonlyFilesystem"))AND(condition_status==true))}, by: {dt.kubernetes.node.system_uuid,k8s.node.name} |
Persistent volume claims alerts
| Alert name | Dynatrace version | Problem type | Problem title | Problem description | De-alerts after | Calculation | Supported in |
|---|---|---|---|---|---|---|---|
| Detect low disk space (%) | 1.262 | RESOURCE_CONTENTION_EVENT | Kubernetes PVC: Low disk space % | Available disk space for a persistent volume claim is below the threshold. | 5 minutes | Volume stats available bytes / Volume stats capacity bytes | Kubernetes Classic, Kubernetes app |
| Detect low disk space (MB) | 1.262 | RESOURCE_CONTENTION_EVENT | Kubernetes PVC: Low disk space | Available disk space for a persistent volume claim is below the threshold. | 5 minutes | Kubelet volume stats available bytes metric | Kubernetes Classic, Kubernetes app |
Detect low disk space (%)
| Type | Expression |
|---|---|
| Metric expression | kubelet_volume_stats_available_bytes:splitBy(k8s.namespace.name,persistentvolumeclaim):avg/kubelet_volume_stats_capacity_bytes:splitBy(k8s.namespace.name,persistentvolumeclaim):avg*100.0 |
| DQL | timeseries {o1=avg(kubelet_volume_stats_available_bytes), o2=avg(kubelet_volume_stats_capacity_bytes)}, by: {k8s.namespace.name,persistentvolumeclaim}| fieldsAdd result=o1[]/o2[]* 100.0| fieldsRemove {o1,o2} |
Detect low disk space (MB)
| Type | Expression |
|---|---|
| Metric expression | kubelet_volume_stats_available_bytes:splitBy(k8s.namespace.name,persistentvolumeclaim):avg |
| DQL | timeseries {avg(kubelet_volume_stats_available_bytes)}, by: {k8s.namespace.name,persistentvolumeclaim} |
Workload alerts
| Alert name | Dynatrace version | Problem type | Problem title | Problem description | De-alerts after | Calculation | Supported in |
|---|---|---|---|---|---|---|---|
| Detect CPU usage saturation | 1.264 | RESOURCE_CONTENTION_EVENT | CPU usage close to limits | The CPU usage exceeds the threshold in terms of the defined CPU limit. | 5 minutes | Sum of workload CPU usage / Sum of workload CPU limits | Kubernetes Classic, Kubernetes app |
| Detect container restarts | 1.254 | ERROR_EVENT | Container restarts | Observed container restarts exceed the specified threshold. | 5 minutes | Container restarts metric | Kubernetes Classic, Kubernetes app |
| Detect high CPU throttling | 1.264 | RESOURCE_CONTENTION_EVENT | High CPU throttling | The CPU throttling to usage ratio exceeds the specified threshold. | 5 minutes | Sum of workload CPU throttled / Sum of workload CPU usage | Kubernetes Classic, Kubernetes app |
| Detect job failure events | 1.268 | ERROR_EVENT | Job failure event | Events with reason 'BackoffLimitExceeded', 'DeadlineExceeded', or 'PodFailurePolicy' have been detected. | 60 minutes | Event metric filtered by reason and workload kind | Kubernetes Classic, Kubernetes app |
| Detect memory usage saturation | 1.264 | RESOURCE_CONTENTION_EVENT | Memory usage close to limits | The memory usage (working set memory) exceeds the threshold in terms of the defined memory limit. | 5 minutes | Sum of workload working set memory / Sum of workload memory limits | Kubernetes Classic, Kubernetes app |
| Detect out-of-memory kills | 1.268 | ERROR_EVENT | Out-of-memory kills | Out-of-memory kills have been observed for pods of this workload. | 5 minutes | Out-of-memory kills metric | Kubernetes Classic, Kubernetes app |
| Detect pod backoff events | 1.268 | ERROR_EVENT | Backoff event | Events with reason 'BackOff' have been detected for pods of this workload. Check for pods with status 'ImagePullBackOff' or 'CrashLoopBackOff'. | 15 minutes | Event metric filtered by reason | Kubernetes Classic, Kubernetes app |
| Detect pod eviction events | 1.268 | ERROR_EVENT | Pod eviction event | Events with reason 'Evicted' have been detected for pods of this workload. | 60 minutes | Event metric filtered by reason | Kubernetes Classic, Kubernetes app |
| Detect pod preemption events | 1.268 | ERROR_EVENT | Preemption event | Events with reasons 'Preempted' or 'Preempting' have been detected for pods of this workload. | 60 minutes | Event metric filtered by reason | Kubernetes Classic, Kubernetes app |
| Detect pods stuck in pending | 1.254 | RESOURCE_CONTENTION_EVENT | Pods stuck in pending | Workload has pending pods. | 5 minutes | Pods metric filtered by phase 'Pending' | Kubernetes Classic, Kubernetes app |
| Detect pods stuck in terminating | 1.260 | RESOURCE_CONTENTION_EVENT | Pods stuck in terminating | Workload has pods stuck in terminating. | 5 minutes | Pods metric filtered by status 'Terminating' | Kubernetes Classic, Kubernetes app |
| Detect stuck deployments | 1.260 | ERROR_EVENT | Deployment stuck | Deployment is stuck and therefore is no longer progressing. | 5 minutes | Workload condition metric filtered by 'not progressing' | Kubernetes Classic, Kubernetes app |
| Detect workloads with non-ready pods | 1.258 | ERROR_EVENT | Not all pods ready | Workload has pods that are not ready. | 5 minutes | Sum of non-failed pods - Sum of non-failed and non-ready pods | Kubernetes Classic, Kubernetes app |
| Detect workloads without ready pods | 1.254 | ERROR_EVENT | No pod ready | Workload does not have any ready pods. | 5 minutes | Sum of non-failed pods - Sum of non-failed and non-ready pods | Kubernetes Classic, Kubernetes app |
Detect CPU usage saturation
| Type | Expression |
|---|---|
| Metric expression | (builtin:kubernetes.workload.cpu_usage:splitBy(k8s.namespace.name,k8s.workload.kind,k8s.workload.name):sum/builtin:kubernetes.workload.limits_cpu:splitBy(k8s.namespace.name,k8s.workload.kind,k8s.workload.name):sum):default(0.0)*100.0 |
| DQL | timeseries o1=sum(dt.kubernetes.container.cpu_usage, rollup: avg), nonempty:true, by: {k8s.namespace.name,k8s.workload.kind,k8s.workload.name}| join [timeseries operand=sum(dt.kubernetes.container.limits_cpu, rollup: avg), nonempty:true, filter: {(dt.kubernetes.container.type=="app")}, by: {k8s.namespace.name,k8s.workload.kind,k8s.workload.name}], on: {interval}, fields: {o2=operand}| fieldsAdd result=if(isNull(o1[]/o2[]), 0.0, else: o1[]/o2[])* 100.0| fieldsRemove {o1,o2} |
Detect container restarts
| Type | Expression |
|---|---|
| Metric expression | builtin:kubernetes.container.restarts:splitBy(k8s.namespace.name,k8s.workload.kind,k8s.workload.name):sum:default(0.0) |
| DQL | timeseries {sum(dt.kubernetes.container.restarts, default:0.0, rollup: avg)}, by: {k8s.namespace.name,k8s.workload.kind,k8s.workload.name} |
Detect high CPU throttling
| Type | Expression |
|---|---|
| Metric expression | (builtin:kubernetes.workload.cpu_throttled:splitBy(k8s.namespace.name,k8s.workload.kind,k8s.workload.name):sum/builtin:kubernetes.workload.cpu_usage:splitBy(k8s.namespace.name,k8s.workload.kind,k8s.workload.name):sum):default(0.0)*100.0 |
| DQL | timeseries {o1=sum(dt.kubernetes.container.cpu_throttled, rollup: avg), o2=sum(dt.kubernetes.container.cpu_usage, rollup: avg)}, by: {k8s.namespace.name,k8s.workload.kind,k8s.workload.name}| fieldsAdd result=if(isNull(o1[]/o2[]), 0.0, else: o1[]/o2[])* 100.0| fieldsRemove {o1,o2} |
Detect job failure events
| Type | Expression |
|---|---|
| Metric expression | builtin:kubernetes.events:filter(and(or(eq(k8s.event.reason,BackoffLimitExceeded),eq(k8s.event.reason,DeadlineExceeded),eq(k8s.event.reason,PodFailurePolicy)),or(eq(k8s.workload.kind,job),eq(k8s.workload.kind,cronjob)))):splitBy(k8s.namespace.name,k8s.workload.kind,k8s.workload.name):sum:default(0.0) |
| DQL | timeseries {sum(dt.kubernetes.events, default:0.0, rollup: avg)}, filter: {(((k8s.event.reason=="BackoffLimitExceeded")OR(k8s.event.reason=="DeadlineExceeded")OR(k8s.event.reason=="PodFailurePolicy"))AND((k8s.workload.kind=="job")OR(k8s.workload.kind=="cronjob")))}, by: {k8s.namespace.name,k8s.workload.kind,k8s.workload.name} |
Detect memory usage saturation
| Type | Expression |
|---|---|
| Metric expression | (builtin:kubernetes.workload.memory_working_set:splitBy(k8s.namespace.name,k8s.workload.kind,k8s.workload.name):sum/builtin:kubernetes.workload.limits_memory:splitBy(k8s.namespace.name,k8s.workload.kind,k8s.workload.name):sum):default(0.0)*100.0 |
| DQL | timeseries o1=sum(dt.kubernetes.container.memory_working_set, rollup: avg), nonempty:true, by: {k8s.namespace.name,k8s.workload.kind,k8s.workload.name}| join [timeseries operand=sum(dt.kubernetes.container.limits_memory, rollup: avg), nonempty:true, filter: {(dt.kubernetes.container.type=="app")}, by: {k8s.namespace.name,k8s.workload.kind,k8s.workload.name}], on: {interval}, fields: {o2=operand}| fieldsAdd result=if(isNull(o1[]/o2[]), 0.0, else: o1[]/o2[])* 100.0| fieldsRemove {o1,o2} |
Detect out-of-memory kills
| Type | Expression |
|---|---|
| Metric expression | builtin:kubernetes.container.oom_kills:splitBy(k8s.namespace.name,k8s.workload.kind,k8s.workload.name):sum:default(0.0) |
| DQL | timeseries {sum(dt.kubernetes.container.oom_kills, default:0.0, rollup: avg)}, by: {k8s.namespace.name,k8s.workload.kind,k8s.workload.name} |
Detect pod backoff events
| Type | Expression |
|---|---|
| Metric expression | builtin:kubernetes.events:filter(and(eq(k8s.event.reason,BackOff))):splitBy(k8s.namespace.name,k8s.workload.kind,k8s.workload.name):sum:default(0.0) |
| DQL | timeseries {sum(dt.kubernetes.events, default:0.0, rollup: avg)}, filter: {((k8s.event.reason=="BackOff"))}, by: {k8s.namespace.name,k8s.workload.kind,k8s.workload.name} |
Detect pod eviction events
| Type | Expression |
|---|---|
| Metric expression | builtin:kubernetes.events:filter(and(eq(k8s.event.reason,Evicted))):splitBy(k8s.namespace.name,k8s.workload.kind,k8s.workload.name):sum:default(0.0) |
| DQL | timeseries {sum(dt.kubernetes.events, default:0.0, rollup: avg)}, filter: {((k8s.event.reason=="Evicted"))}, by: {k8s.namespace.name,k8s.workload.kind,k8s.workload.name} |
Detect pod preemption events
| Type | Expression |
|---|---|
| Metric expression | builtin:kubernetes.events:filter(or(eq(k8s.event.reason,Preempted),eq(k8s.event.reason,Preempting))):splitBy(k8s.namespace.name,k8s.workload.kind,k8s.workload.name):sum:default(0.0) |
| DQL | timeseries {sum(dt.kubernetes.events, default:0.0, rollup: avg)}, filter: {((k8s.event.reason=="Preempted")OR(k8s.event.reason=="Preempting"))}, by: {k8s.namespace.name,k8s.workload.kind,k8s.workload.name} |
Detect pods stuck in pending
| Type | Expression |
|---|---|
| Metric expression | builtin:kubernetes.pods:filter(and(eq(pod_phase,Pending))):splitBy(k8s.namespace.name,k8s.workload.kind,k8s.workload.name):sum |
| DQL | timeseries {sum(dt.kubernetes.pods, rollup: avg)}, filter: {((pod_phase=="Pending"))}, by: {k8s.namespace.name,k8s.workload.kind,k8s.workload.name} |
Detect pods stuck in terminating
| Type | Expression |
|---|---|
| Metric expression | builtin:kubernetes.pods:filter(and(eq(pod_status,Terminating))):splitBy(k8s.namespace.name,k8s.workload.kind,k8s.workload.name):sum |
| DQL | timeseries {sum(dt.kubernetes.pods, rollup: avg)}, filter: {((pod_status=="Terminating"))}, by: {k8s.namespace.name,k8s.workload.kind,k8s.workload.name} |
Detect stuck deployments
| Type | Expression |
|---|---|
| Metric expression | builtin:kubernetes.workload.conditions:filter(and(eq(workload_condition,Progressing),eq(condition_status,False))):splitBy(k8s.namespace.name,k8s.workload.kind,k8s.workload.name):sum |
| DQL | timeseries {sum(dt.kubernetes.workload.conditions, rollup: avg)}, filter: {((workload_condition=="Progressing")AND(condition_status==false))}, by: {k8s.namespace.name,k8s.workload.kind,k8s.workload.name} |
Detect workloads with non-ready pods
| Type | Expression |
|---|---|
| Metric expression | builtin:kubernetes.pods:filter(and(ne(pod_phase,Failed),ne(pod_phase,Succeeded),ne(k8s.workload.kind,job),ne(k8s.workload.kind,cronjob),ne(pod_status,Terminating))):splitBy(k8s.namespace.name,k8s.workload.kind,k8s.workload.name):sum-builtin:kubernetes.pods:filter(and(ne(pod_phase,Failed),ne(pod_phase,Succeeded),ne(k8s.workload.kind,job),ne(k8s.workload.kind,cronjob),eq(pod_condition,Ready),ne(pod_status,Terminating))):splitBy(k8s.namespace.name,k8s.workload.kind,k8s.workload.name):sum:default(0.0) |
| DQL | timeseries o1=sum(dt.kubernetes.pods, rollup: avg), filter: {((pod_phase!="Failed")AND(pod_phase!="Succeeded")AND(k8s.workload.kind!="job")AND(k8s.workload.kind!="cronjob")AND(pod_status!="Terminating"))}, by: {k8s.namespace.name,k8s.workload.kind,k8s.workload.name}| join [timeseries operand=sum(dt.kubernetes.pods, default:0.0, rollup: avg), nonempty:true, filter: {((pod_phase!="Failed")AND(pod_phase!="Succeeded")AND(k8s.workload.kind!="job")AND(k8s.workload.kind!="cronjob")AND(pod_condition=="Ready")AND(pod_status!="Terminating"))}, by: {k8s.namespace.name,k8s.workload.kind,k8s.workload.name}], on: {interval}, fields: {o2=operand}| fieldsAdd result=o1[]-o2[]| fieldsRemove {o1,o2} |
Detect workloads without ready pods
| Type | Expression |
|---|---|
| Metric expression | builtin:kubernetes.pods:filter(and(ne(pod_phase,Failed),ne(pod_phase,Succeeded),ne(k8s.workload.kind,job),ne(k8s.workload.kind,cronjob))):splitBy(k8s.namespace.name,k8s.workload.kind,k8s.workload.name):sum-builtin:kubernetes.pods:filter(and(ne(pod_phase,Failed),ne(pod_phase,Succeeded),ne(k8s.workload.kind,job),ne(k8s.workload.kind,cronjob),ne(pod_condition,Ready))):splitBy(k8s.namespace.name,k8s.workload.kind,k8s.workload.name):sum:default(0.0) |
| DQL | timeseries o1=sum(dt.kubernetes.pods, rollup: avg), filter: {((pod_phase!="Failed")AND(pod_phase!="Succeeded")AND(k8s.workload.kind!="job")AND(k8s.workload.kind!="cronjob"))}, by: {k8s.namespace.name,k8s.workload.kind,k8s.workload.name}| join [timeseries operand=sum(dt.kubernetes.pods, default:0.0, rollup: avg), nonempty:true, filter: {((pod_phase!="Failed")AND(pod_phase!="Succeeded")AND(k8s.workload.kind!="job")AND(k8s.workload.kind!="cronjob")AND(pod_condition!="Ready"))}, by: {k8s.namespace.name,k8s.workload.kind,k8s.workload.name}], on: {interval}, fields: {o2=operand}| fieldsAdd result=o1[]-o2[]| fieldsRemove {o1,o2} |