New: User session analysis
Dynatrace version 1.224+
While analysis of individual user sessions can be useful in some situations, such analysis is often incomplete. The users of your application behave in unexpected ways, perform different tasks with different goals in mind, reside in various geographic regions, and use countless combinations of devices, operating systems, and browsers.
Dynatrace supports user session segmentation through a powerful filtering mechanism. Dynatrace user session analysis enables you to slice, dice, and combine your application's user sessions into meaningful segments based on shared characteristics of individual user sessions—operating system, browser type, location, or user tag. For example, you might segment your analysis based on the following browser types: desktop, mobile, or synthetic. In this way, you can drill deeply into aggregate results to discover meaningful insights into performance problems that may only be experienced by a small subset of your users.
Analyze a user session
To analyze a user session
-
Go to Session Segmentation.
-
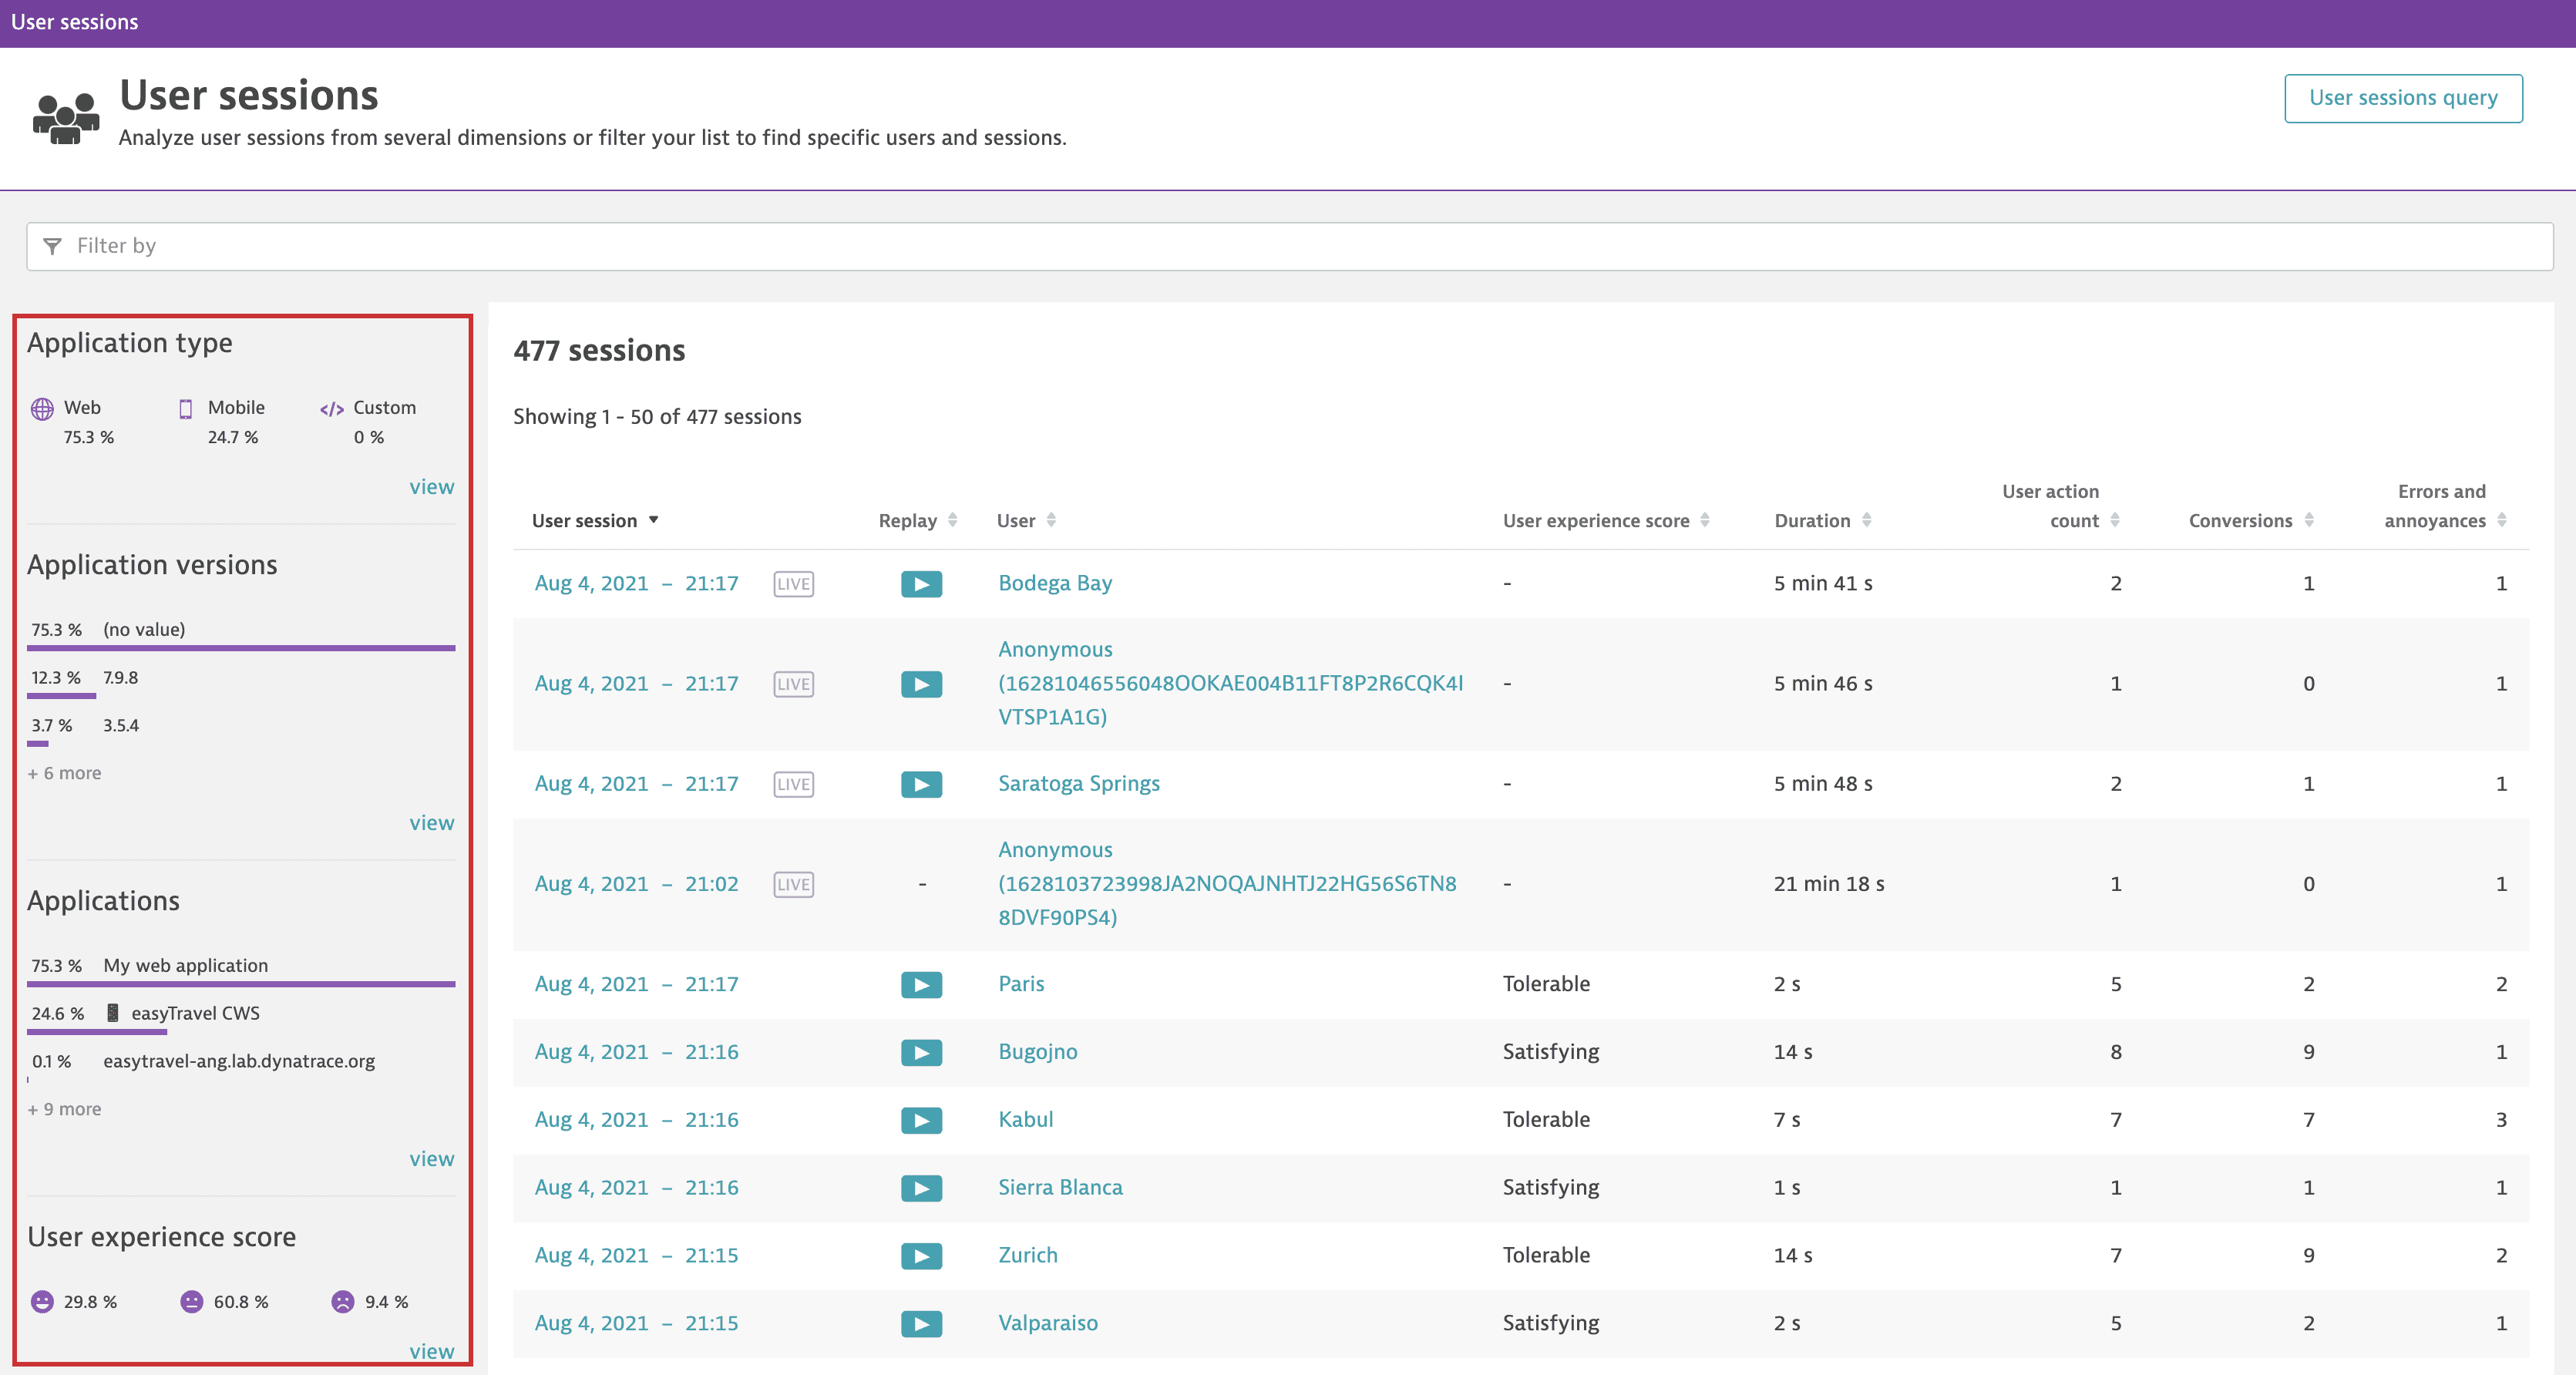
Click the text field at the top of the page (see 1 in the example below), and select one of the available filtering attributes. Once you select an attribute, the available values for that filter are displayed in a list.
Attribute category Attribute Description Applications Application Select the name of the application you want to analyze. Application type Specify whether you want to analyze the sessions of web, mobile, or custom applications. Browser monitor Select the name of the browser monitor used for Synthetic Monitoring. Browser Browser type Filter sessions based on whether they were performed with a desktop, tablet, or mobile browser or virtually via synthetic agent or bots. Browser family Filter sessions based on the browser that was used. Browser version Use this attribute if you want to filter sessions based not only on a specific browser but also on a specific browser version. Screen width Filter user sessions based on a specific screen width. Screen height Filter user sessions based on a specific screen height. Operating system Operating system family Filter sessions based on operating system family (Windows, Linux, iOS, etc). Operating system version Select a specific OS version. Location Continent Filter sessions based on the continent where the sessions originate. Country Filter sessions based on the country where the sessions originate. Region Filter sessions based on the geographical region where the sessions originate. City Filter sessions based on the city where the sessions originate. Mobile Application version Use this filter to view sessions for a specific version of your mobile app. Crashes Select YesorNoto filter sessions that have or haven't experienced a crash.Device Filter sessions based on the type of mobile device used to access the application. Manufacturer Filter user sessions based on a specific mobile device manufacturer. Rooted or jailbroken Select YesorNoto filter mobile sessions where the device is rooted/jailbroken or genuine. If the device status is unknown or undefined, sessions have the value ofnulland don't appear in the results. Custom applications always report unknown or undefined.User User tag Select a user tag to analyze the sessions of a specific user. Internal user ID Filter sessions based on the unique ID of the user that triggered the user session. User type Choose whether you want to analyze user sessions of robots, synthetic users, or real users. New user Select YesorNoto filter sessions based on whether users are new or returning users.Session Live Select YesorNoto show either live or completed sessions.Session Replay Select YesorNoto show user session with or without Session Replay.Bounced Select YesorNoto filter sessions that either were or weren't bounced sessions (bounced sessions are sessions that are immediately abandoned). A bounce is a special type of user session composed of only a single user action. High bounce rates are undesirable.Converted Select YesorNoto analyze those user sessions where the associated conversion goal was or was not achieved.Session conversion count Filter sessions based on the number of times a session reaches any of the session conversion goals. Conversion goal Select a specific conversion goal to examine those user sessions where this goal was achieved. Has errors Select either YesorNoto explicitly filter sessions that did or didn't encounter errors.Error count Specify a range of error occurrences. Use this to focus on user sessions that have more than a certain number of errors (if you leave the upper bound empty), less than or equal to a value (if you leave the lower bound empty), or fall within a specific value range. Error type Specify whether you want to analyze the sessions that have request, reported, custom, or JavaScript errors. IP Filter sessions based on IP addresses. IPS Filter sessions based on a specific Internet Service Provider. Duration Specify a session duration in minutes. Use this to filter sessions that have a duration longer than or equal to a value (if you leave the upper bound empty), shorter than or equal to a value (if you leave the lower bound empty), or fall within a specific value range. Session properties Session date properties Filter user sessions based on a particular session date property and its value. Session double properties Filter user sessions based on a particular session double property and its value. Session long properties Filter user sessions based on a particular session long property and its value. Session string properties Filter user sessions based on a particular session string property and its value. User actions User action count Specify a range of integers that represent the number of user actions performed within one session. This can help you to identify, for example, sessions that have a high number of actions. User action name Specify a user action so that you can analyze all sessions that include at least one instance of that action. User action date properties Filter user sessions based on a particular user action date property and its value. User action double properties Filter user sessions based on a particular user action double property and its value. User action string properties Filter user sessions based on a particular user action string property and its value. User action long properties Filter user sessions based on a particular user action long property and its value. Pages Page name Display sessions where a user accessed the specified page. Page group Display sessions where a user accessed the page from the specified page group. Usability Rage click count Specify a range of rage click occurrences. Use this to focus on user sessions that have more than a certain number of rage clicks (if you leave the upper bound empty), less than or equal to a value (if you leave the lower bound empty), or fall within a specific value range. User experience score Show user sessions with Satisfying, Tolerable, or Frustrating user experience score. Rage tap count Specify a range of rage tap occurrences. Use this to focus on mobile user sessions that have more than a certain number of rage taps (if you leave the upper bound empty), less than or equal to a value (if you leave the lower bound empty), or fall within a specific value range. In filters, the tilde operator (
~) doesn't work as theLIKEkeyword in USQL. -
Select the attribute value you're interested in. Some attributes provide text fields that you can use for free-text search. You can also select multiple values of one attribute; this works as an
ORoperator for that attribute. -
Repeat this process for as many attributes as you are interested in. Once you've defined your filter, click anywhere outside the text box.
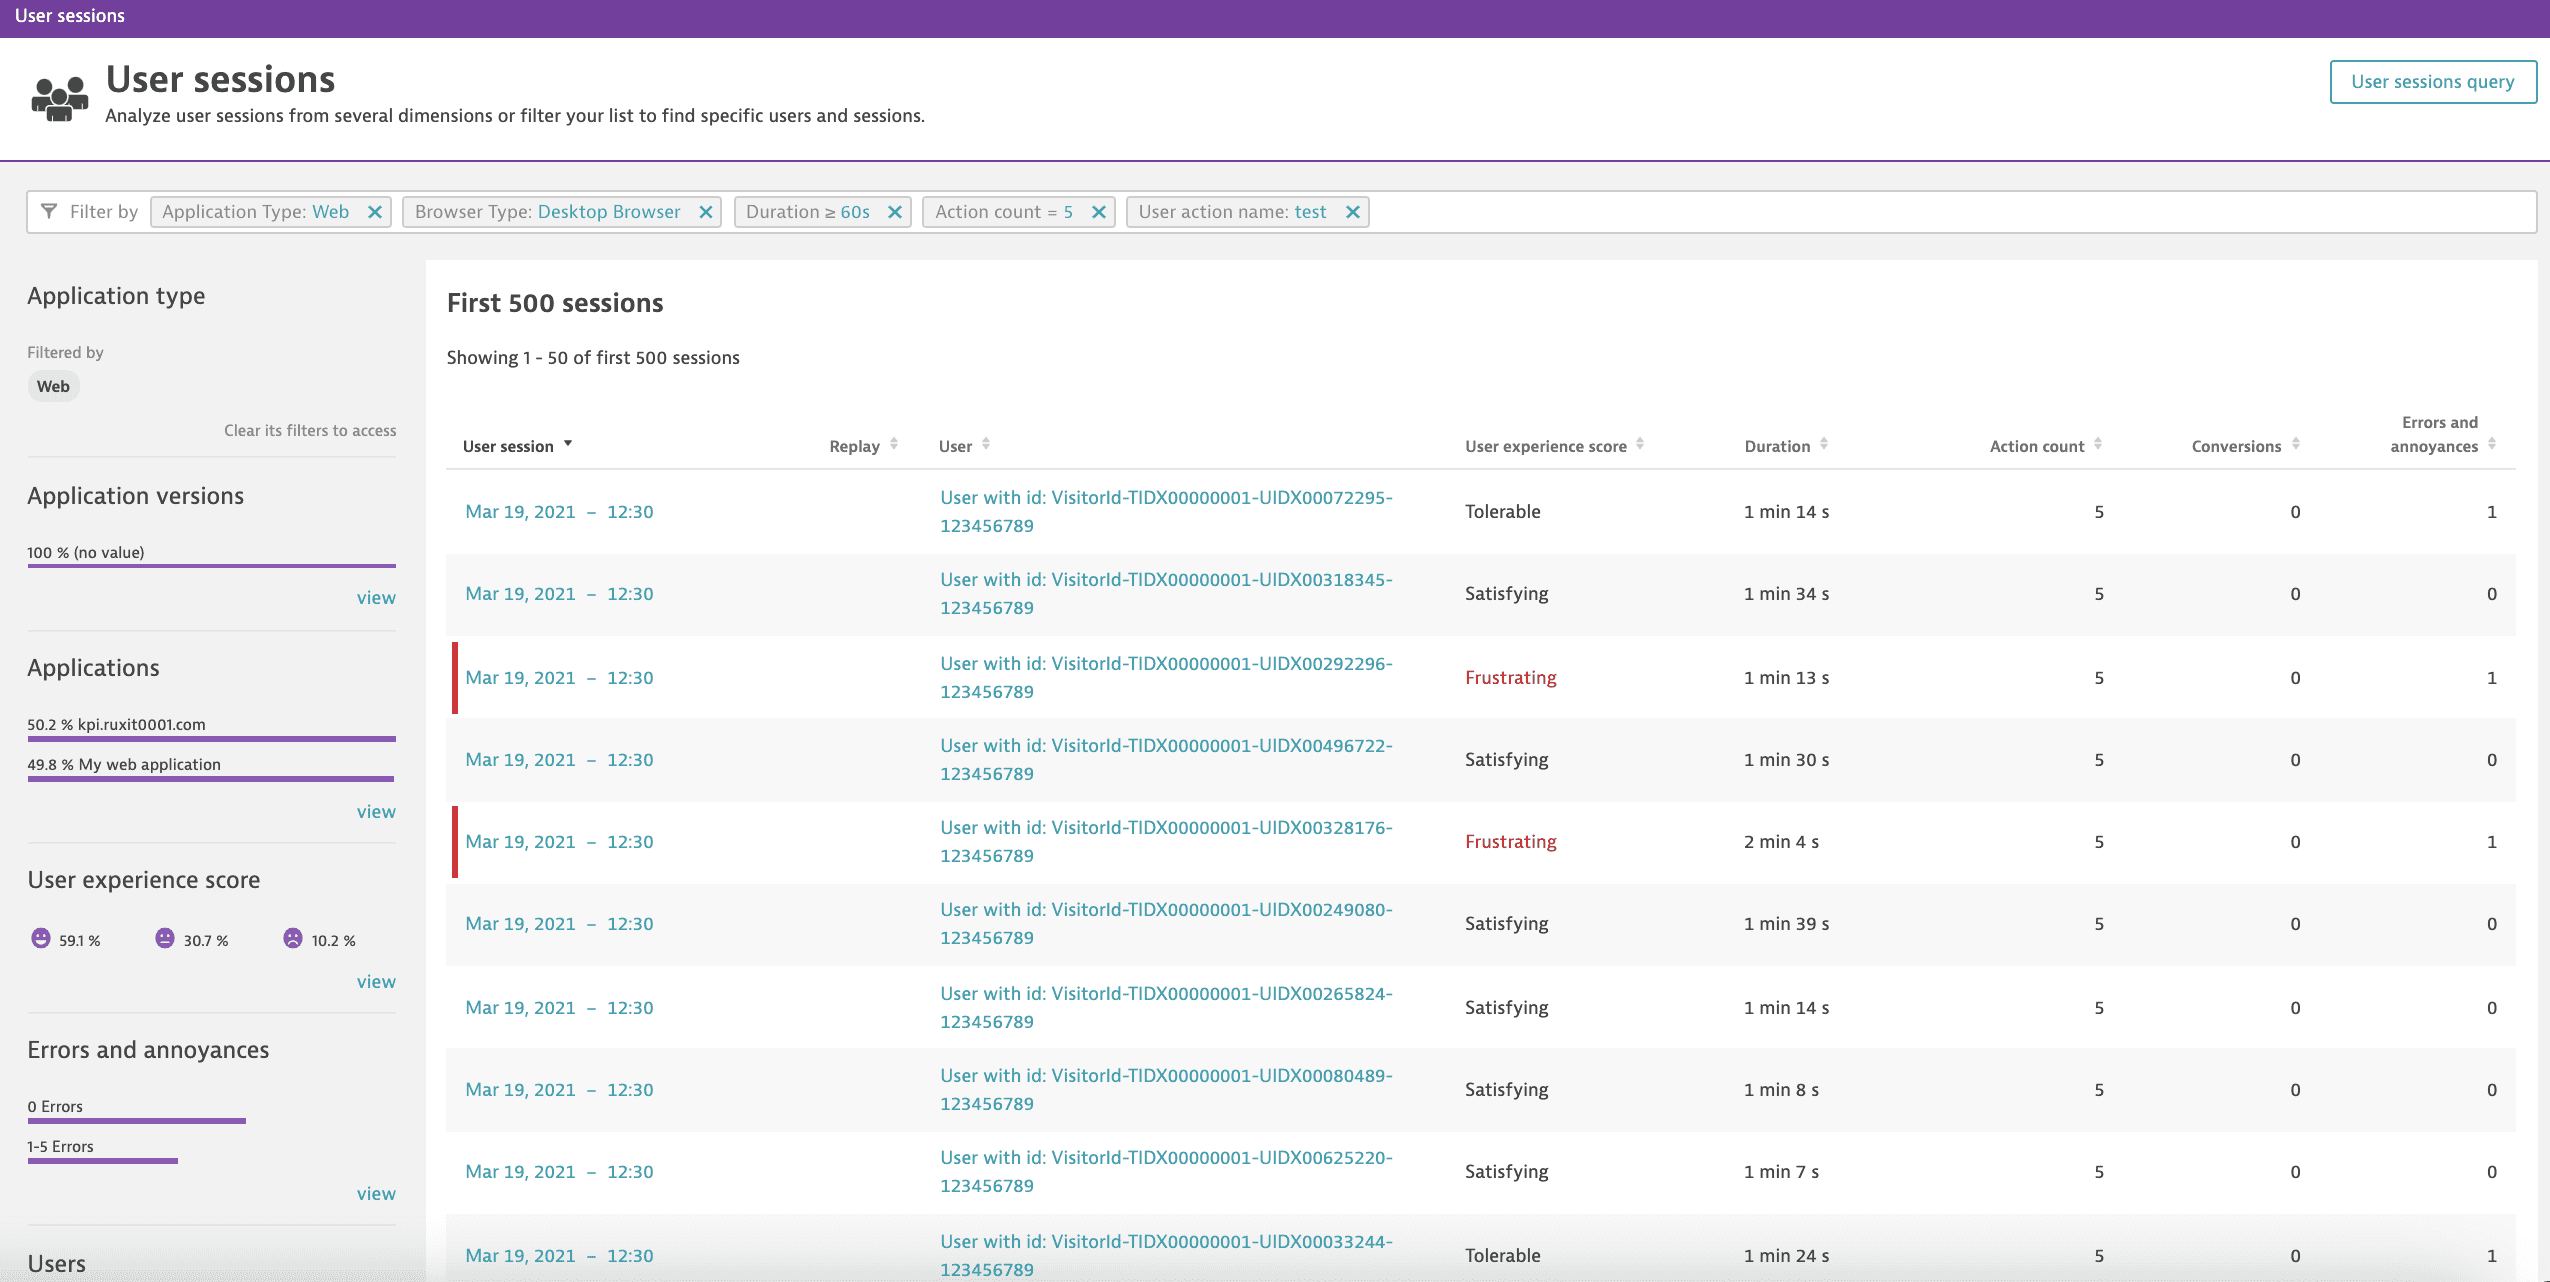
The result of the defined filters provides a list of the first 500 sessions, which are ordered by the start time of the newest session. To change the order, sort the table columns in ascending or descending order.
-
Select a session timestamp (see 3 in the example below) to go to the user session details page. Alternatively, to analyze the sessions of a single user, select a username (see 2 in the example below) to navigate to that user's details page.

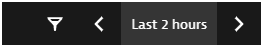
Use the timeframe selector in the menu bar to adjust the analysis timeframe of your user session analysis.
The global timeframe selector serves as a time filter that, in most cases, enables you to select a specific analysis timeframe that persists across all product pages and views as you navigate through your analysis.
-
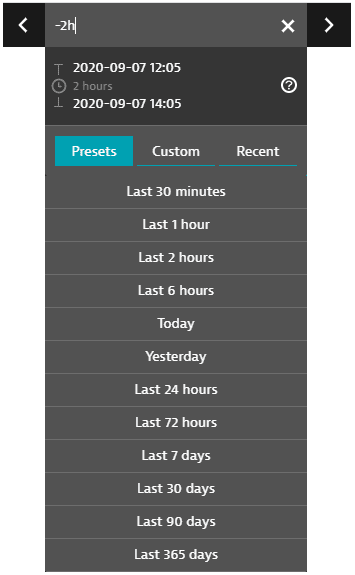
The Presets tab lists all standard timeframes available. Select one to change your timeframe to that preset.
-
The Custom tab displays a calendar. Click a start day, click an end day, and then click Apply to select that range of days as your timeframe.
- Selected calendar intervals are set to end on start of the next day (with the time set to
00:00). For example, if you select September 3 to September 4 on the calendar, the timeframe starts on September 3 at time00:00and ends on September 5 at time00:00, so you never miss the last minute of the time range. You can edit these displayed times.
- Selected calendar intervals are set to end on start of the next day (with the time set to
-
The Recent tab displays recently used timeframes. Select one to revert to that timeframe.
-
The < and > controls shift the timerange forward or backward in time. The increment is the length of the original timerange. For example, if the current timerange is
Last 2 hours(the two-hour range ending now), click < to shift the timerange two hours back, to-4h to -2h(the two-hour range ending two hours ago). -
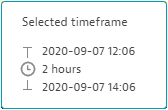
Hover over the timeframe to see the start time, duration, and end time.
If you select the current timeframe in the menu bar, an editable timeframe expression is displayed.
- Reading from left to right, a timeframe expression has a start time, a
tooperator, and an end time. - If there is no explicit end time, the
toandnoware implied. For example,-2his the same-2h to now. - Supported units:
s,m,h,d,w,M,q,y(you can also use whole words such asminutesandquarter)
| Example timeframe expressions | Meaning |
|---|---|
| From the beginning of today to the beginning of tomorrow. |
| From the beginning of yesterday to the beginning of today. Like |
| From the beginning of yesterday to the current time today. |
| The previous seven whole days. If today is Monday, you get the previous Monday through the previous Sunday (yesterday). |
| The current calendar year, from January 1 of this year at |
| The last 42 days (6 weeks * 7 days) ending now. Equivalent to |
| From 2 hours (120 minutes) ago to the current time ( |
| From 4 days (96 hours) ago to 1.5 hours ago. |
| The last 7 days (168 hours), from this time 7 days ago to the current time ( |
| From the beginning of the previous calendar week to the current time (now).
In general, |
| Starting from the beginning of last week plus 8 hours (8:00 AM Monday).
|
| Business hours yesterday, from 09:00 - 17:00 (9 AM to 5 PM). |
| An absolute range consisting of absolute start and end dates and times in
|
| Unix epoch millisecond timestamps. |
User sessions that are live within the timeframe set in the timeframe selector are shown in the session list. The Analysis over time finding, on the contrary, shows only those sessions that started within the set timeframe.
For instance, if the timeframe is set for 12:00–12:05, and a session that started at 11:55 is still live during that timeframe, that session is shown in the session list but isn't considered for the Analysis over time finding. This is because the session started before the set timeframe.
Drill down using findings
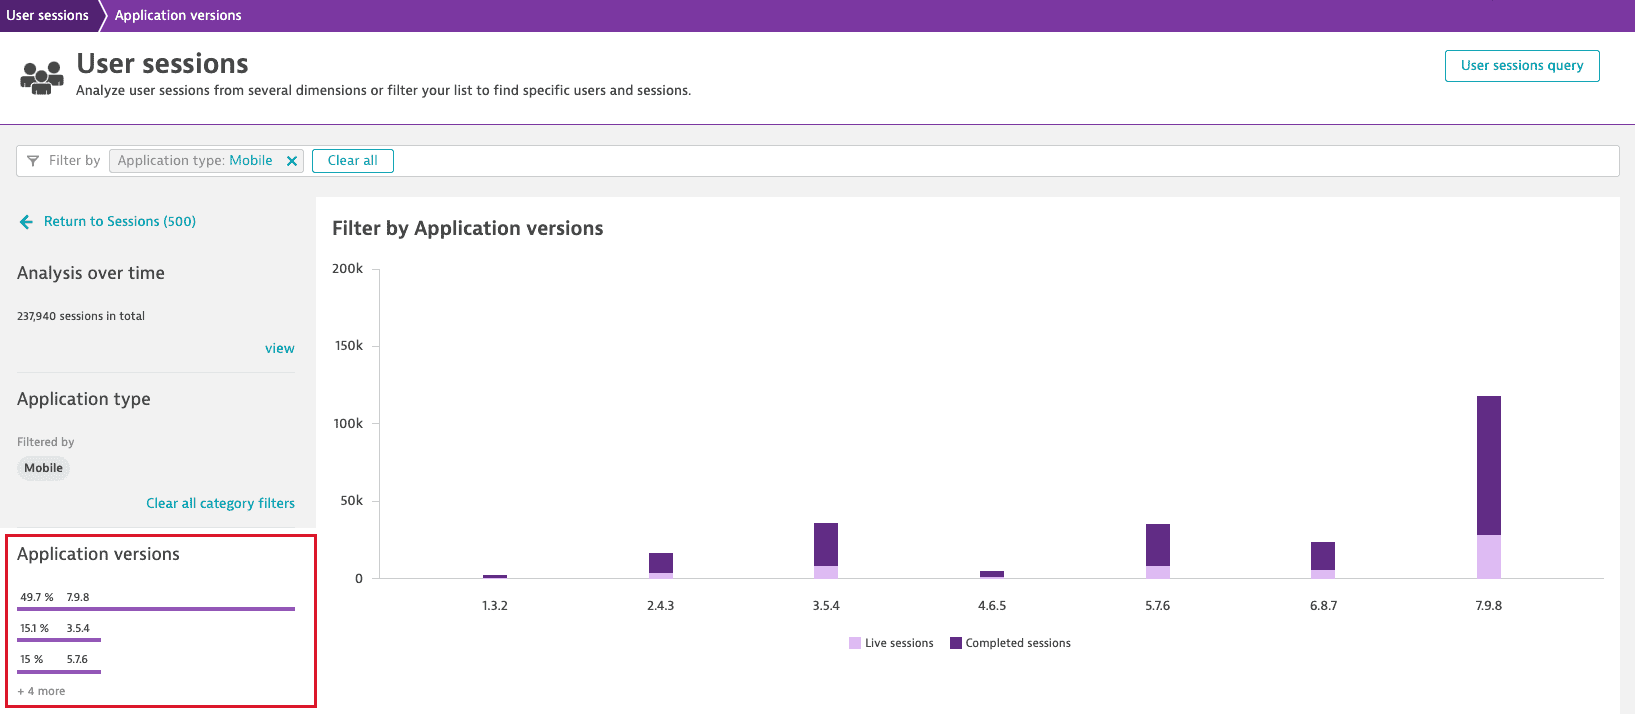
The findings panel is located on the left side of the User sessions page. This panel contains out-of-the-box findings and different visualizations for various attributes. For example, select the Application versions category to see which of your application version has more user sessions, or select the Applications category to see data on aggregated sessions for each of your applications.
Focus on sessions of an individual user
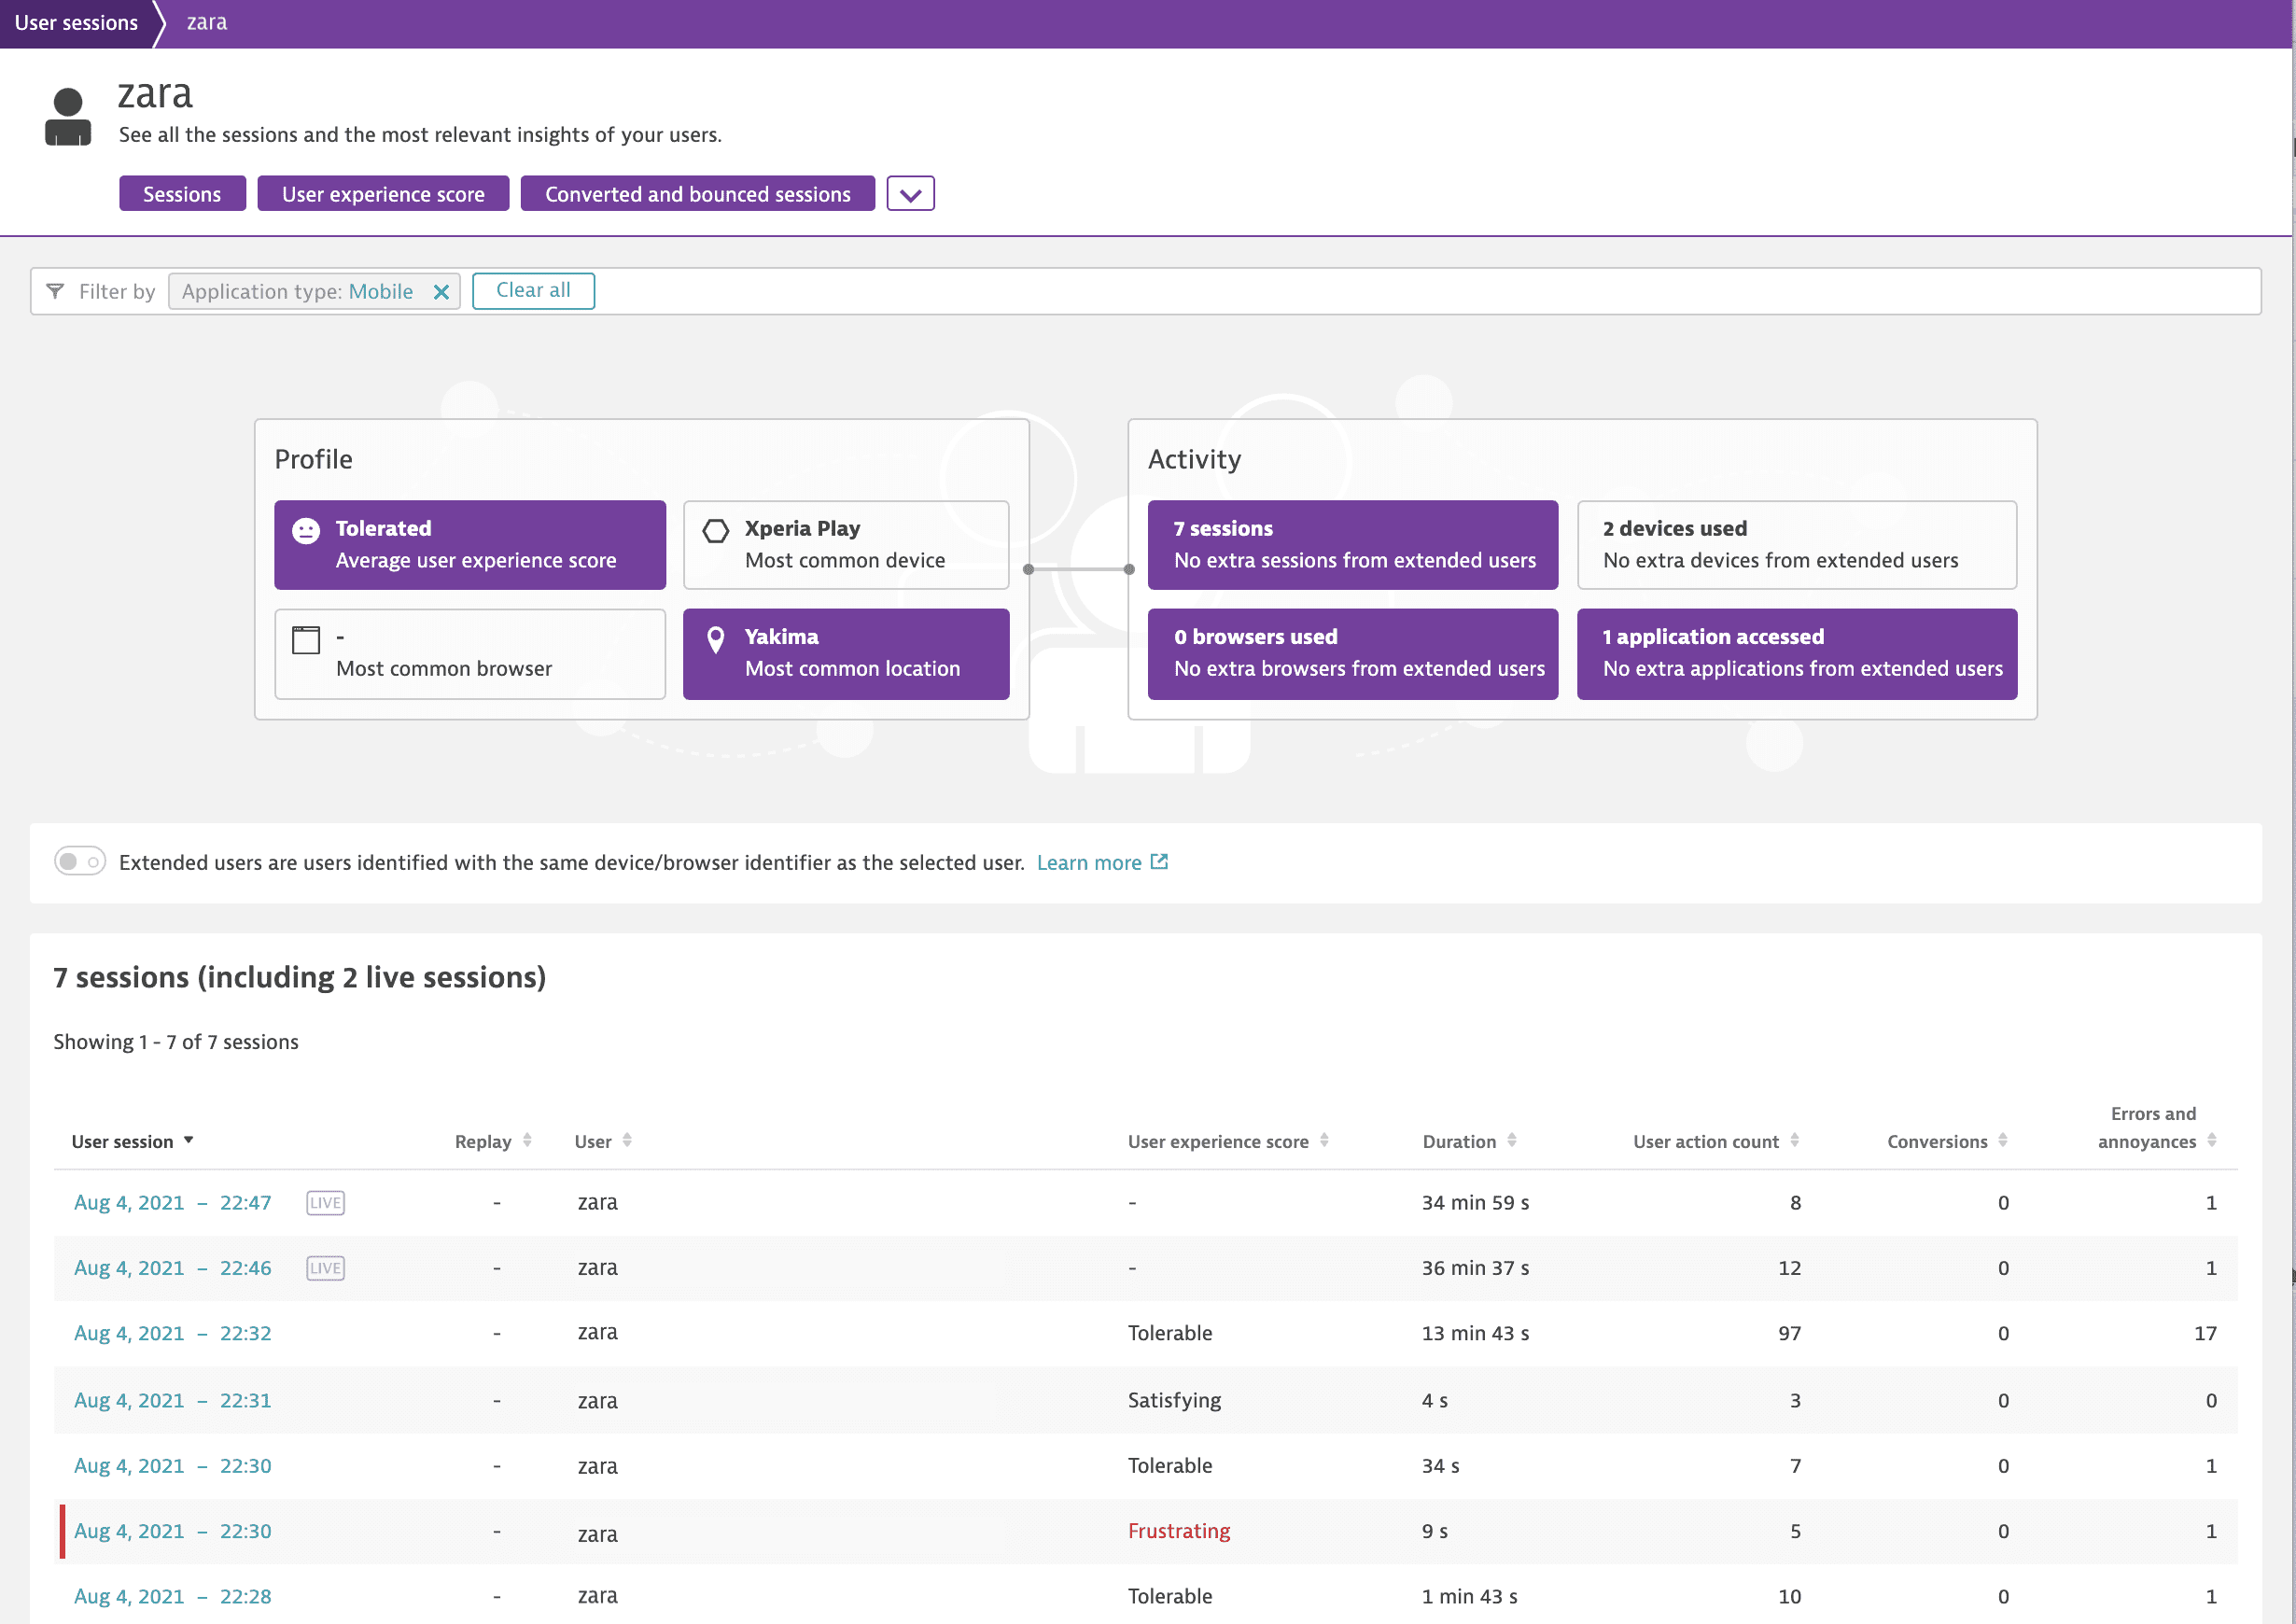
You can focus on the user sessions of a specific user. Select a user from the User column to navigate to that user's overview page.
To search for user sessions of a specific user, select User tag in the Filter by box and then choose the user you're interested in. For example, to display user sessions of a user named Zara, add the User tag: Zara filter. Then select Zara in the User column to navigate to this user's overview page.
To learn how to tag each user of your application with a unique user name, check the following pages depending on your application type and operating system:
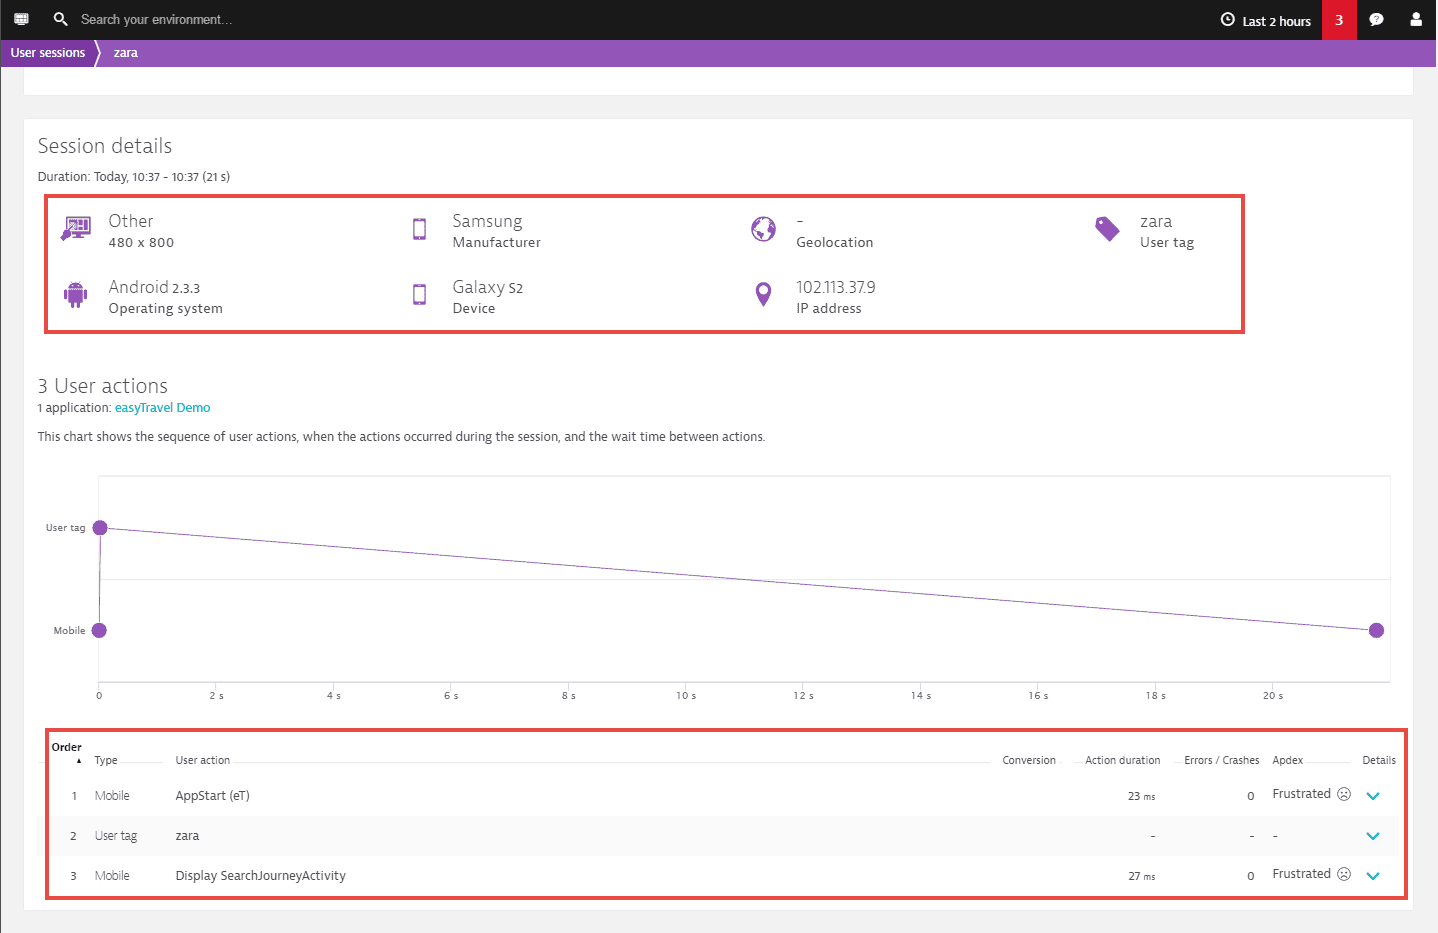
Select one of Zara's sessions to view further details. For example, you can check all actions that the Zara user performed during the selected session. The session details contain important device-related information such as the device resolution, manufacturer, operating system, geolocation, and IP address.
View error details
You can also leverage session analysis to get to the details of errors that occur in your application.
To view the error details page
-
Go to Session Segmentation.
-
In the Filter by box, set Error type to one of the following values depending on your application type:
Error type Description Web Mobile Custom Request error Detected by the browser and OneAgent on your servers 
Reported error Manually reported via dedicated "report an error" API method 
Custom error Manually reported via the RUM JavaScript API JavaScript error JavaScript exceptions thrown by the browser -
Select the user session you're interested in to open the session details page.
-
Under Events and actions, expand the user action that contains an error, and select Perform waterfall analysis.
-
Perform one of the following actions depending on the application type:
- Web applications On the Waterfall analysis page, select the Error tile, and then select the error. The error details page opens.
- Mobile and custom applications Scroll down to the Web request errors or Reported errors section and select the error. The error details page opens.
Error details page
The error details page provides valuable information about your application's errors.
This displays error details such as the estimated error count, provider (for a request error), technology (for a reported error), and more. The page also lists affected user sessions and affected user actions—select a user action or user session to view its details. The distribution breakdown displays information on the relative frequencies of operating systems, OS versions, application versions, and devices, while the country breakdown shows all affected countries and their corresponding error rate.
Check sessions with rage events
When your application doesn't respond quickly, a text label looks like a button, or a toggle is hidden under another toggle, users might repeatedly click or tap the affected UI control in frustration. Dynatrace detects such behavior as a rage event: a rage click or a rage tap.
To view user sessions with rage events
- Go to Session Segmentation.
- Set Filter by to Rage click count:
≥1or Rage tap count:≥1. Select the user session you're interested in to open the session details page.
- Scroll down to the Events and actions section, and expand the rage click or rage tap event to view its details.
Examine crashes
Mobile and custom applications
When a user session ends in a crash, you can leverage session analysis to view the complete sequence of user actions that preceded the crash. You can also open a crash report to get all the code-level information and quickly trace the root causes of that crash.
-
Go to Session Segmentation.
-
Set Filter by to the following filters:
- Application type:
Mobileto display only mobile user sessions or Application type:Customto get user sessions captured in custom applications - Crashes:
Yesto show sessions ended with a crash - Mobile applications Session Replay:
Yesto display sessions recorded with Session Replay on crashes for Android or iOS applications
- Application type:
-
Select the user session you're interested in to open its session details page.
-
Mobile applications To watch the Session Replay recording, go to the Session Replay tab, and select Play
 .
.
The last event of the session is the crash, which is represented by a red dot in the timeline. Use the Session Replay controls to analyze the crash in detail.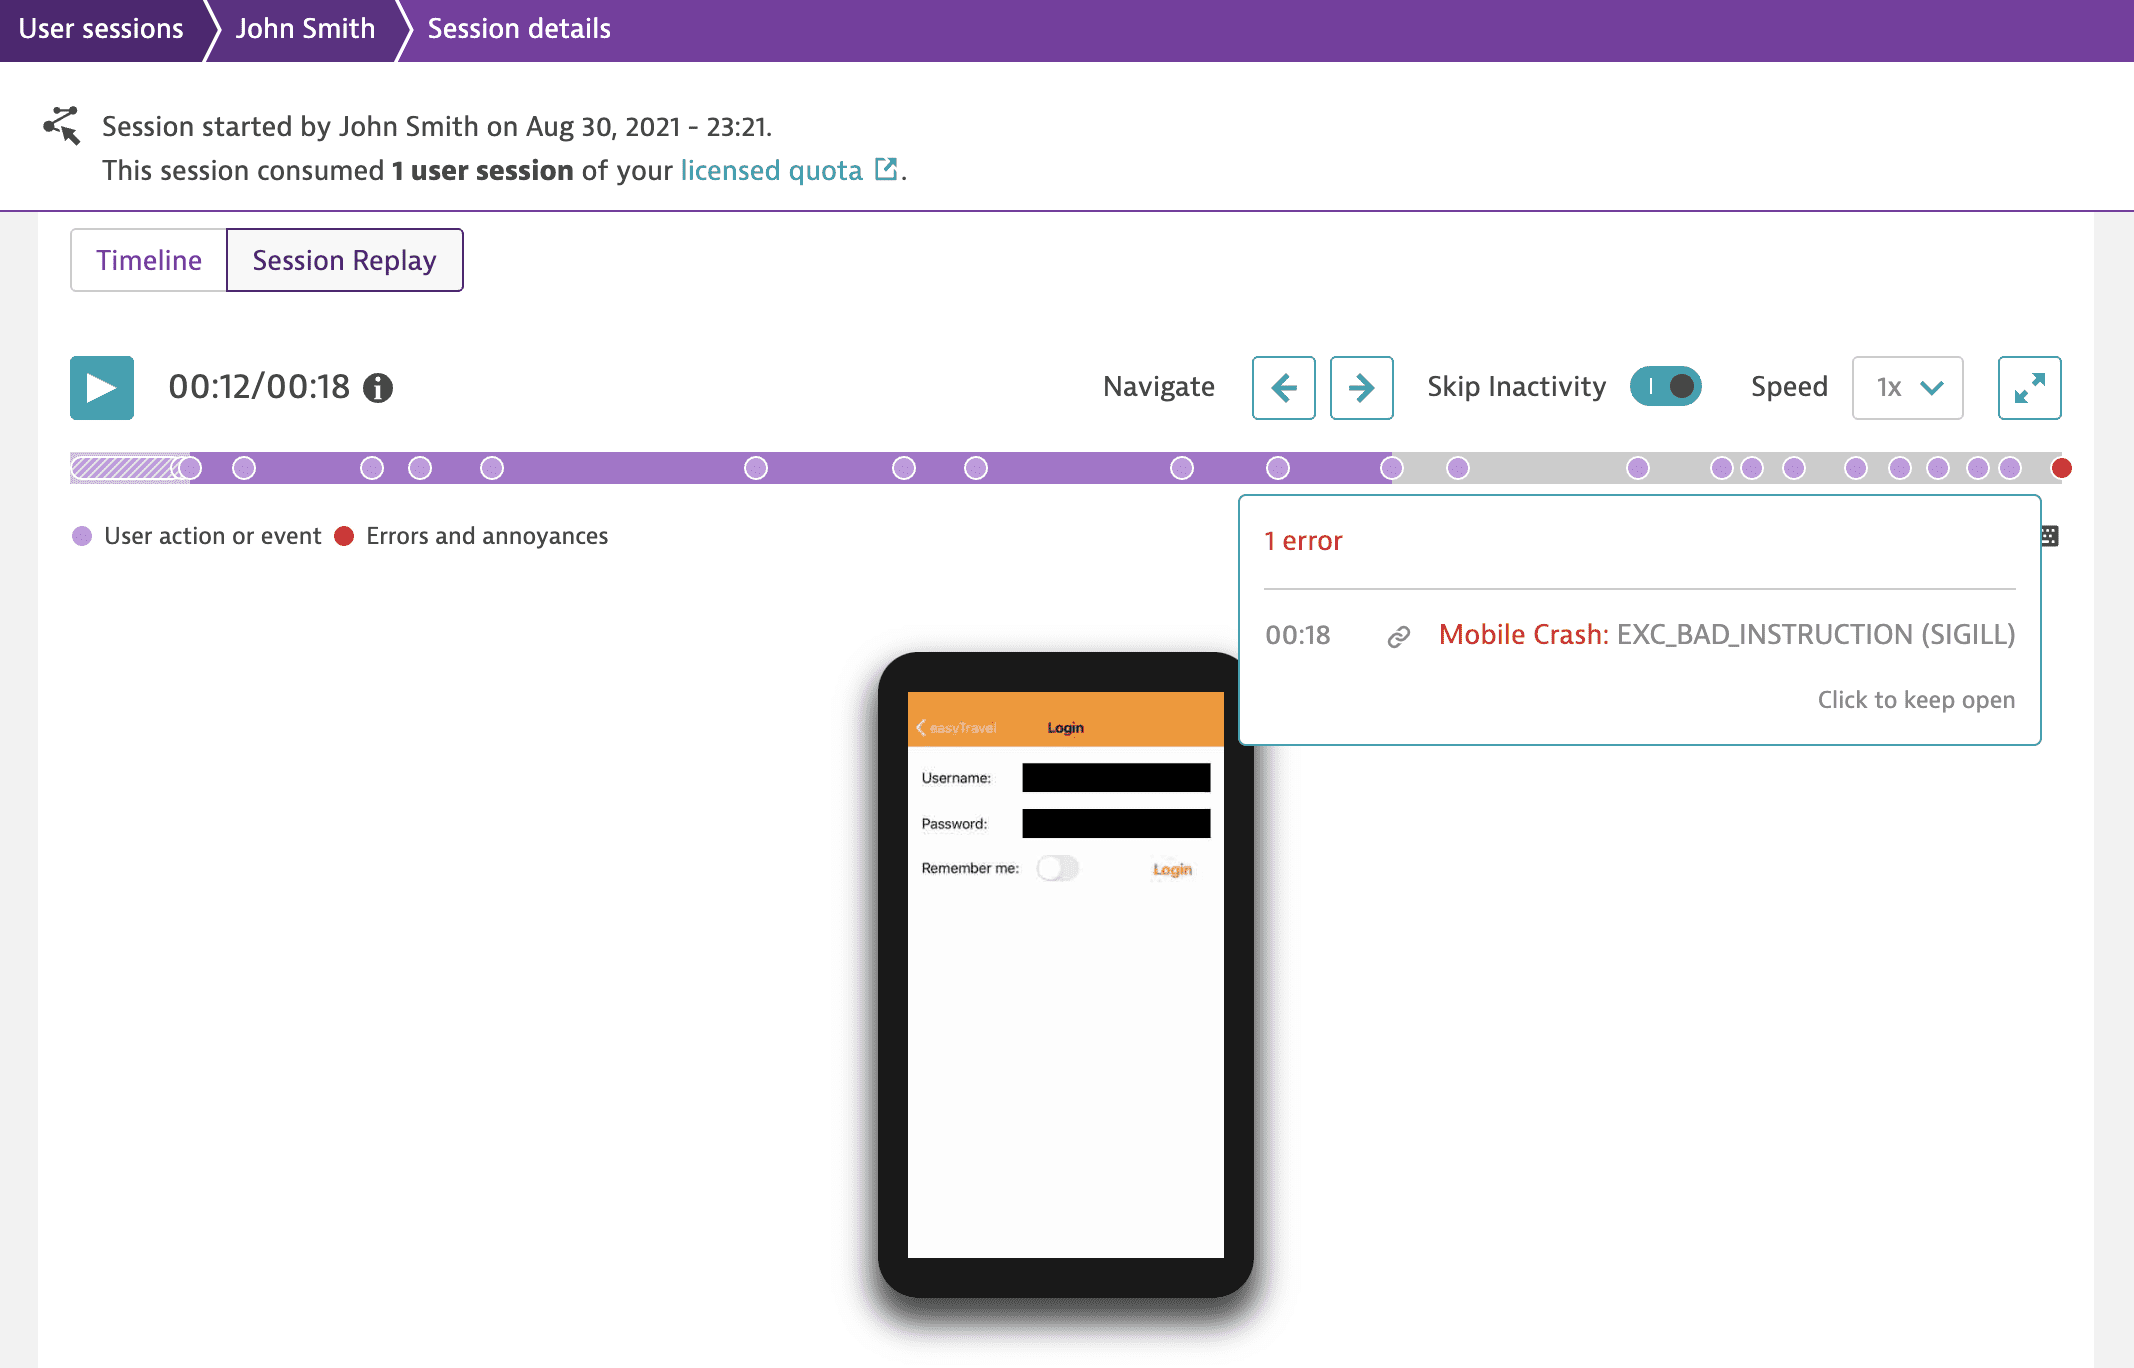
-
To view all user actions and events that preceded the crash, scroll down to the Events and actions section.
-
To view the crash report, expand the crash event, and then select Open crash details.
The crash report provides you with the user's device information and stack trace. You can also analyze the crash groups for your mobile and custom applications or download the crash stack trace.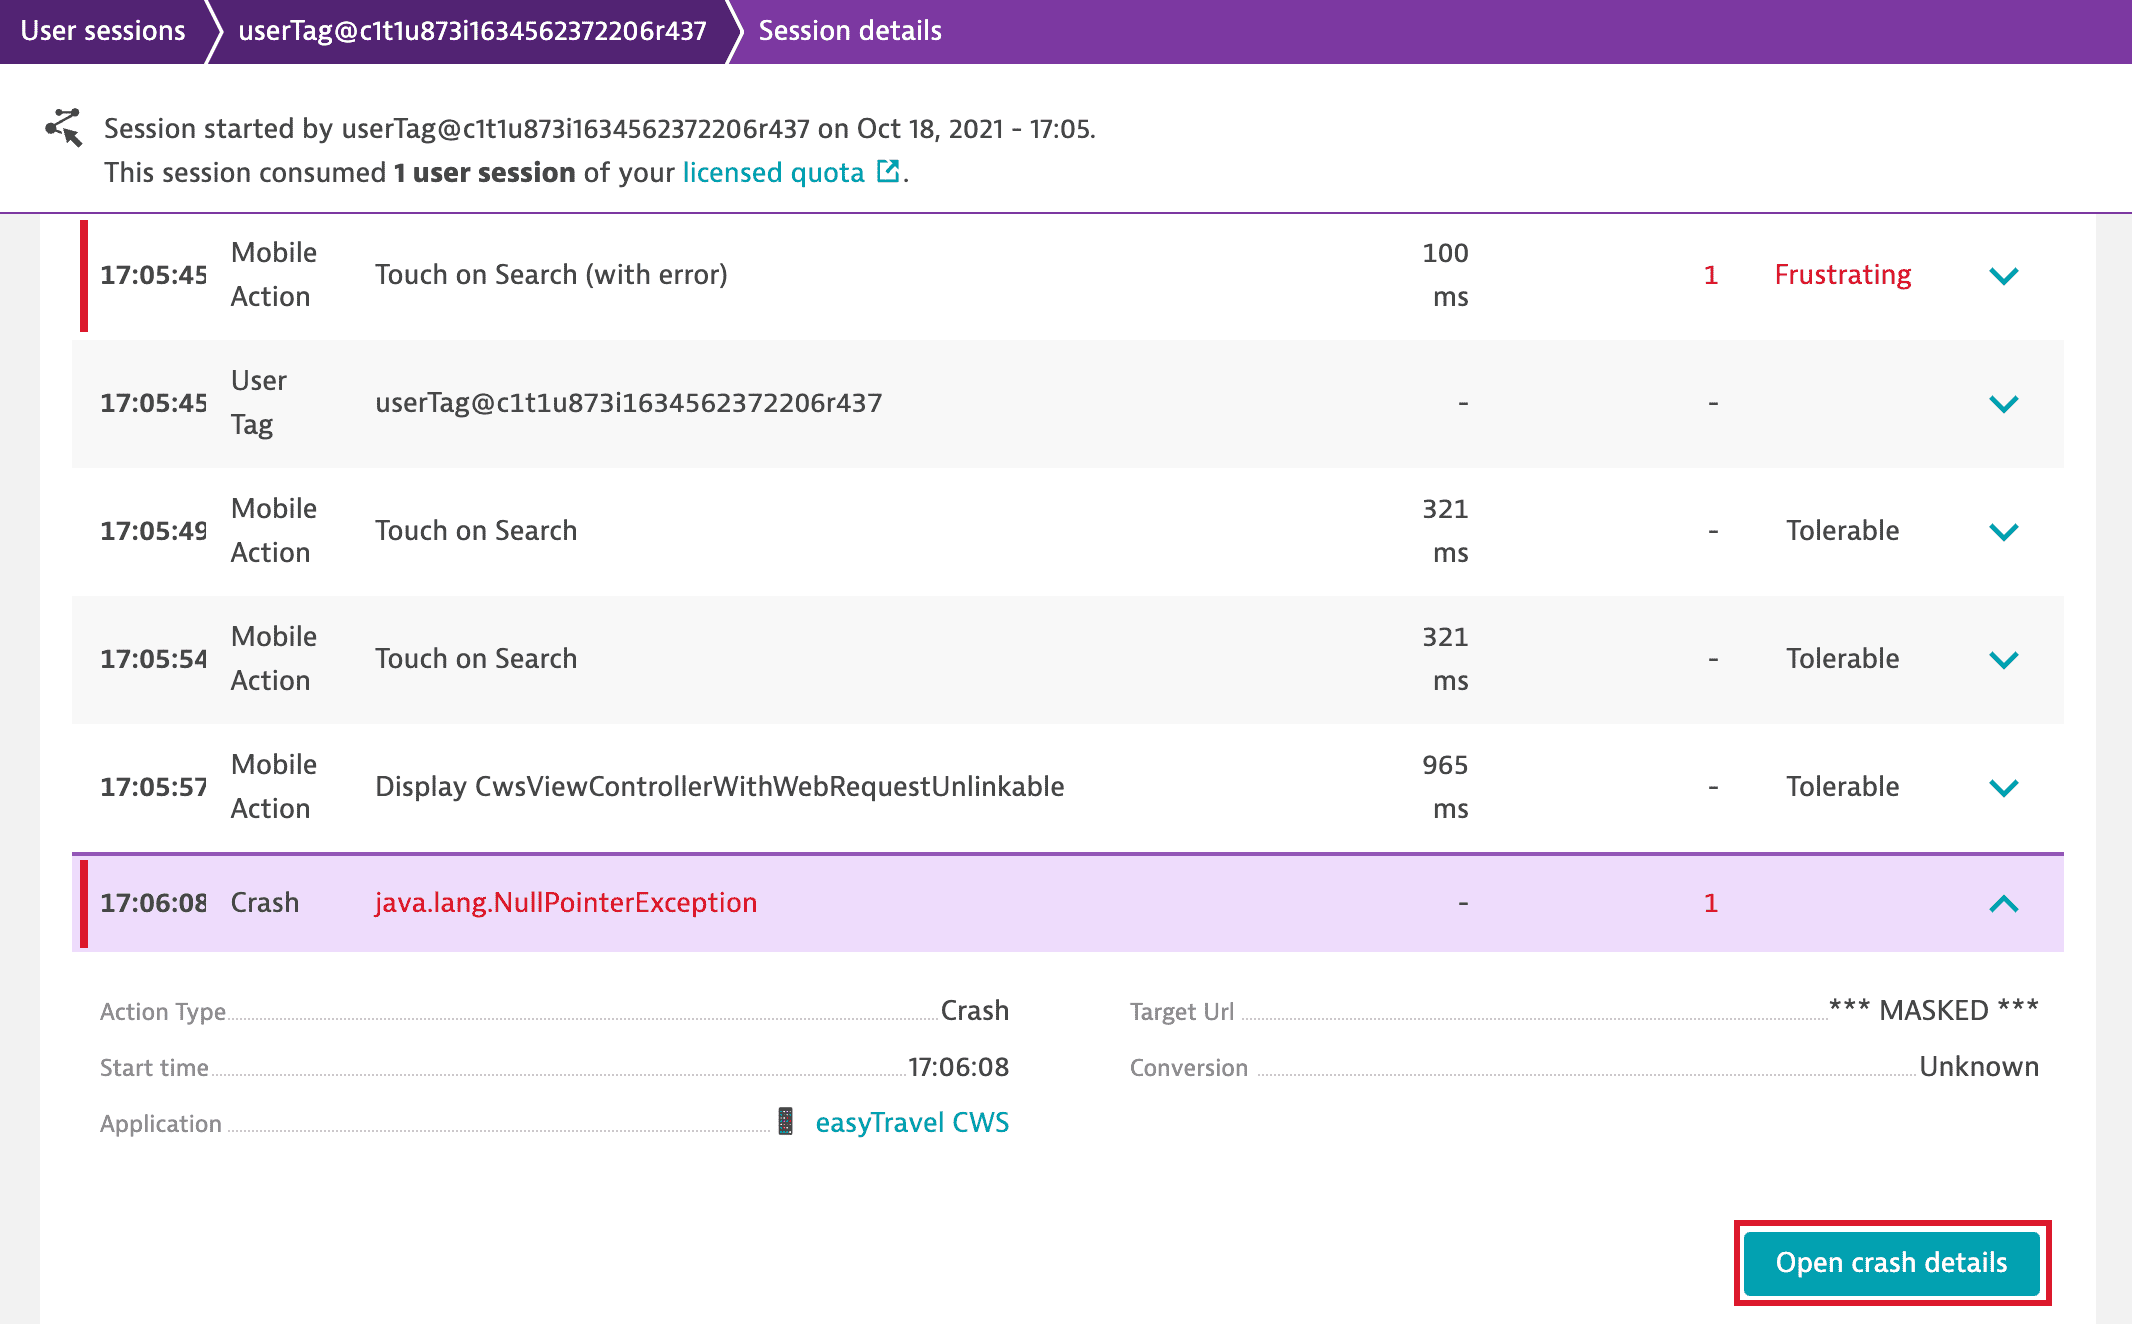
Analysis of a single session across different domains
For technical and security reasons, you cannot analyze a single user session across different domains.
Suppose your user visits two completely different domains during a single "session". How would Dynatrace capture this, given that both domains are instrumented with Dynatrace?
You'd actually see two separate user sessions:
The first session starts with the page load for the web page of the first domain, and it ends when the user clicks a link that leads them to a web page with a different domain (the second domain).
- The second session starts with the first page load on the second domain, and it ends when any of the criteria for ending a user session is met.
This happens for the following reasons:
- Technical reason: Cookies can't be shared across domains, except for subdomains.
- Security reason: It's a security feature of browsers and a limitation that all vendors share.
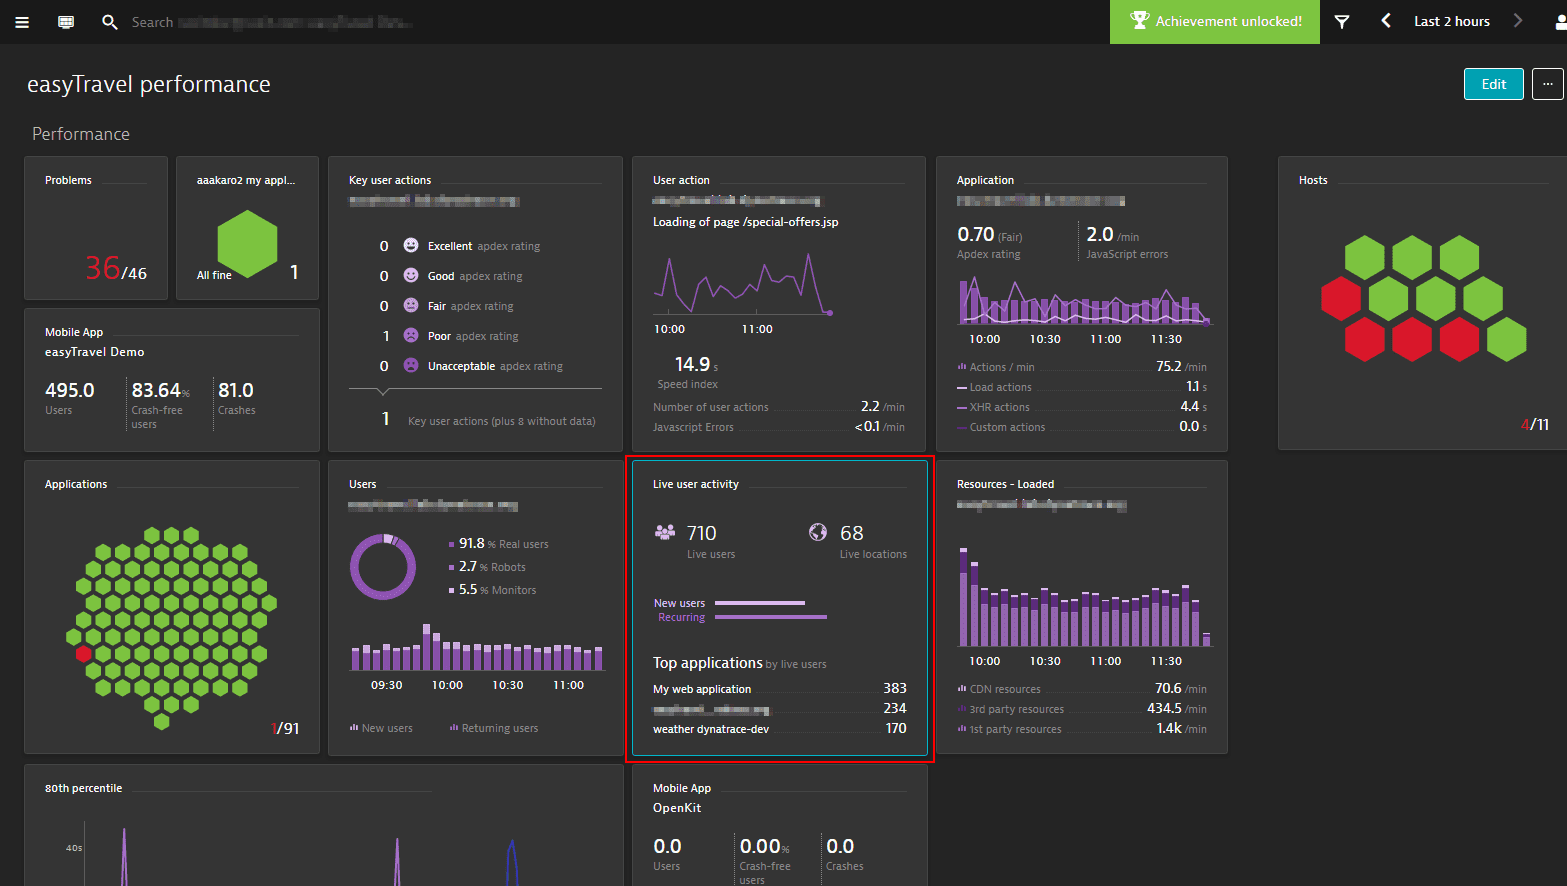
Real-time analysis
- Access live user sessions through the Live user activity tile on the dashboard.
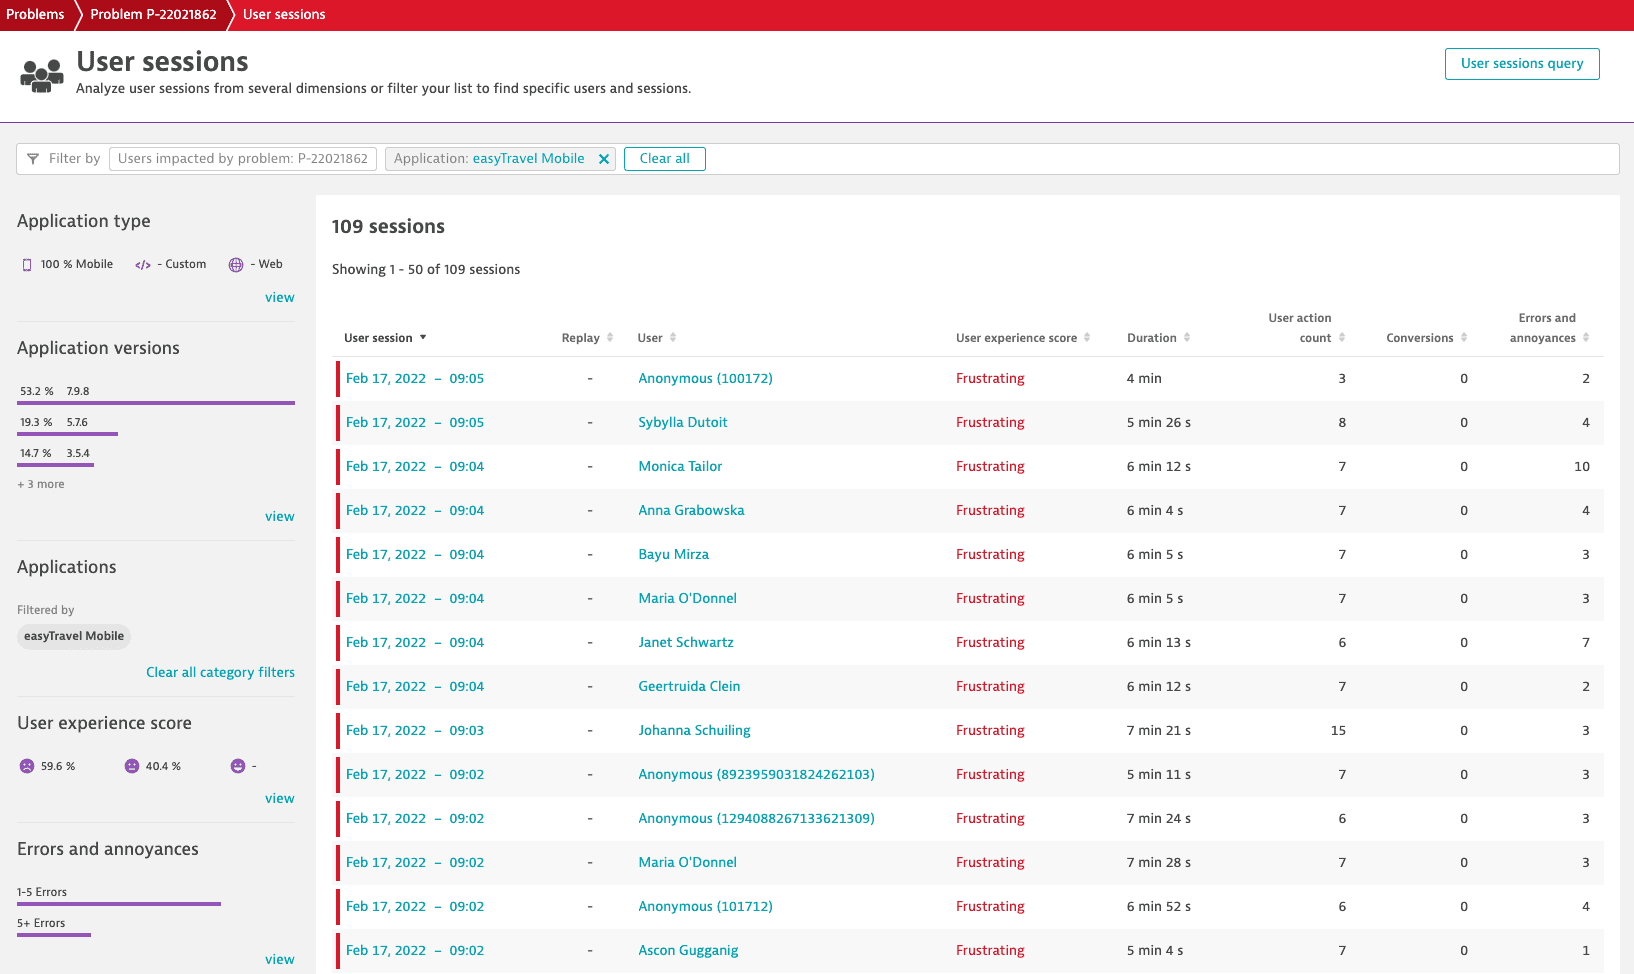
- Go to one of the problem pages, and select See user sessions sample.
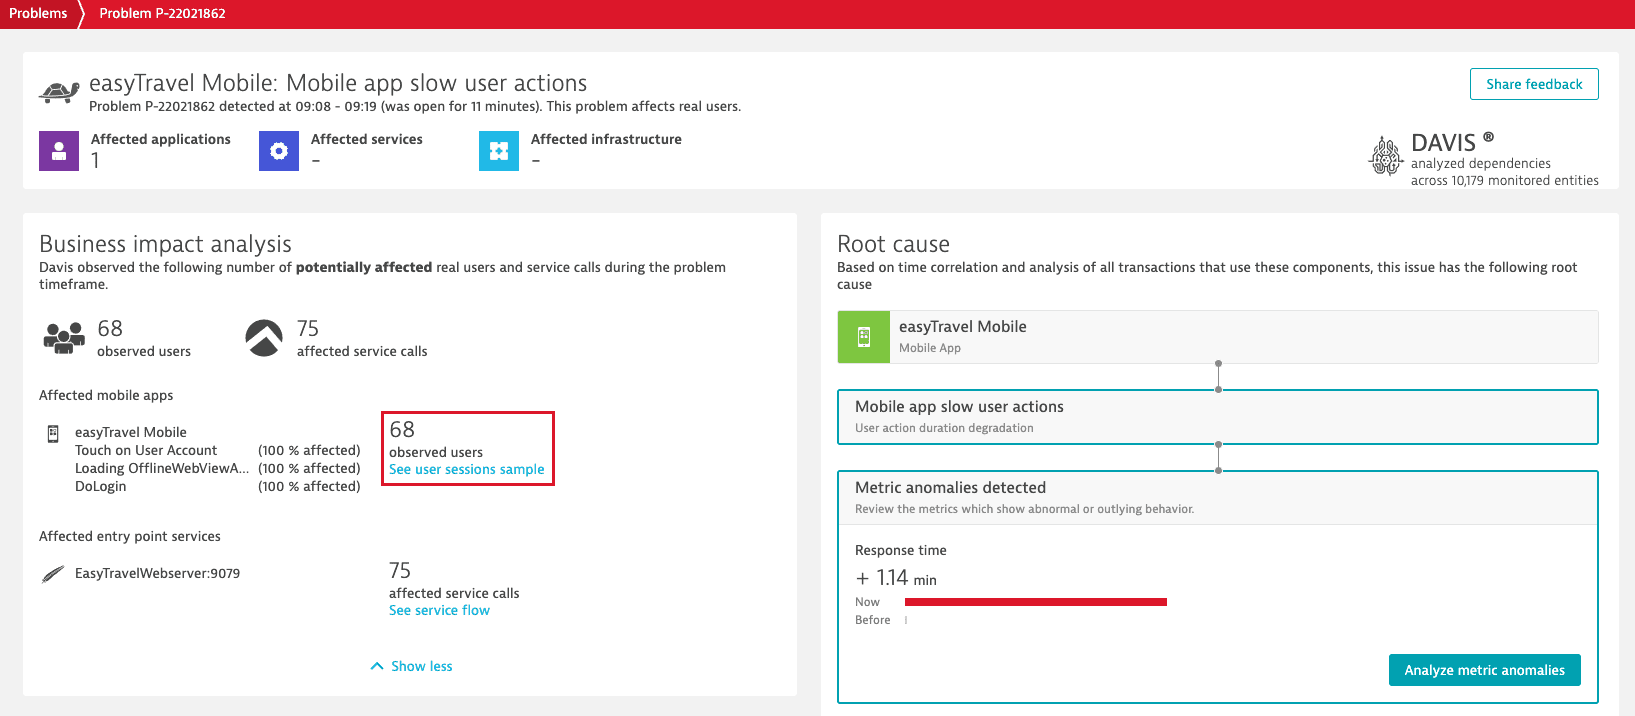
Affected sessions can also be directly accessed from one of the problem pages.
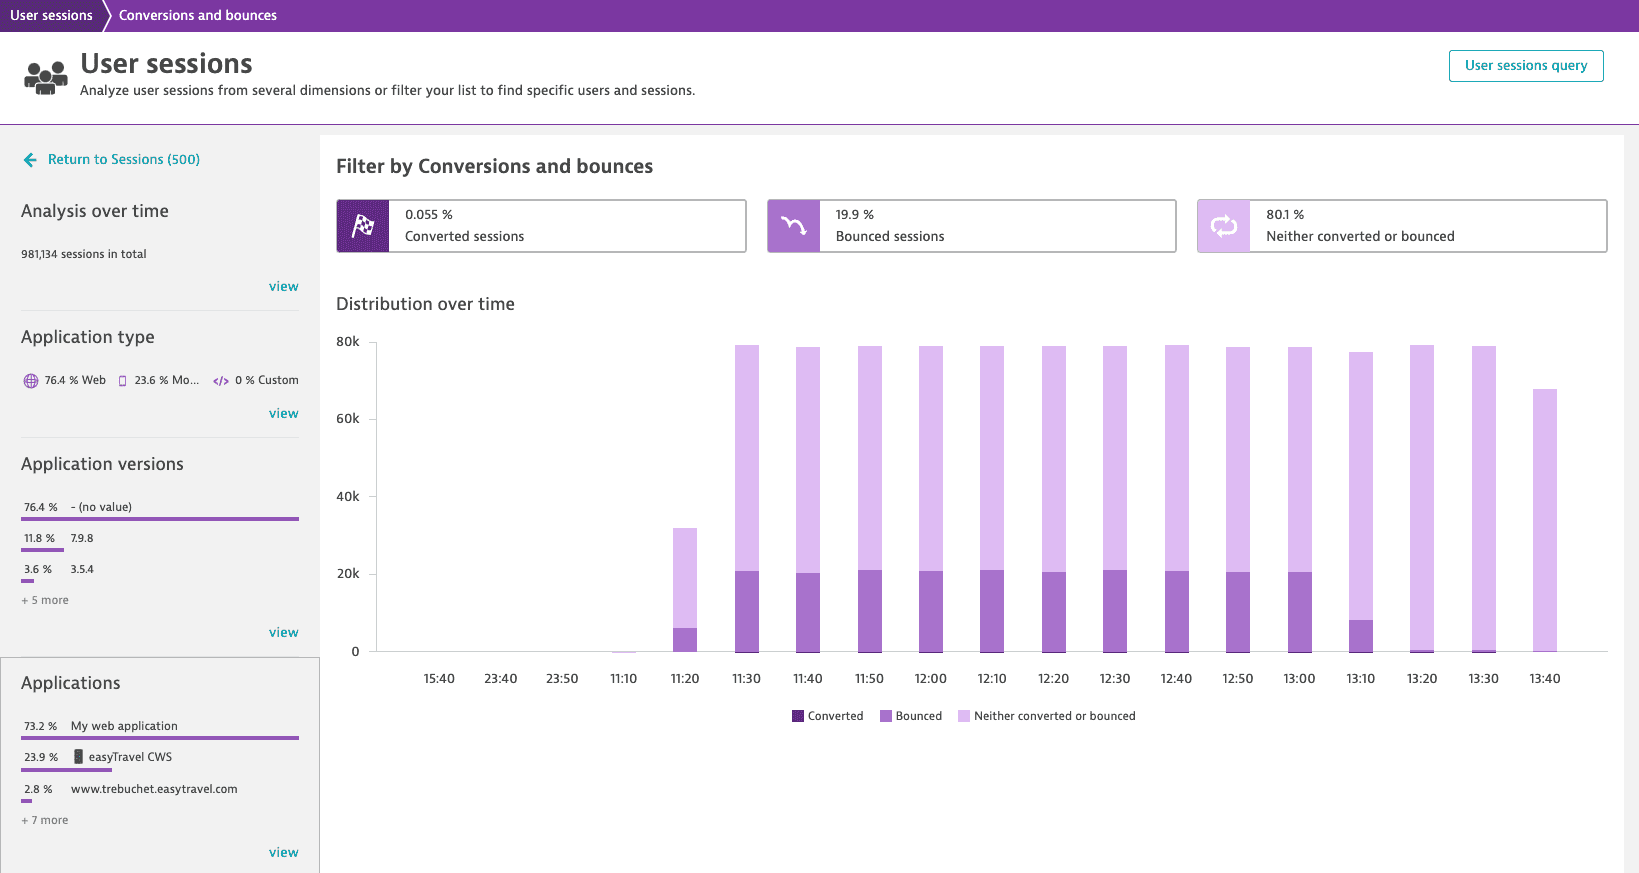
Bounces and conversions are available for completed user sessions.
Examples
These examples show how you can gain insight into your users' behavior through Dynatrace user session analysis.
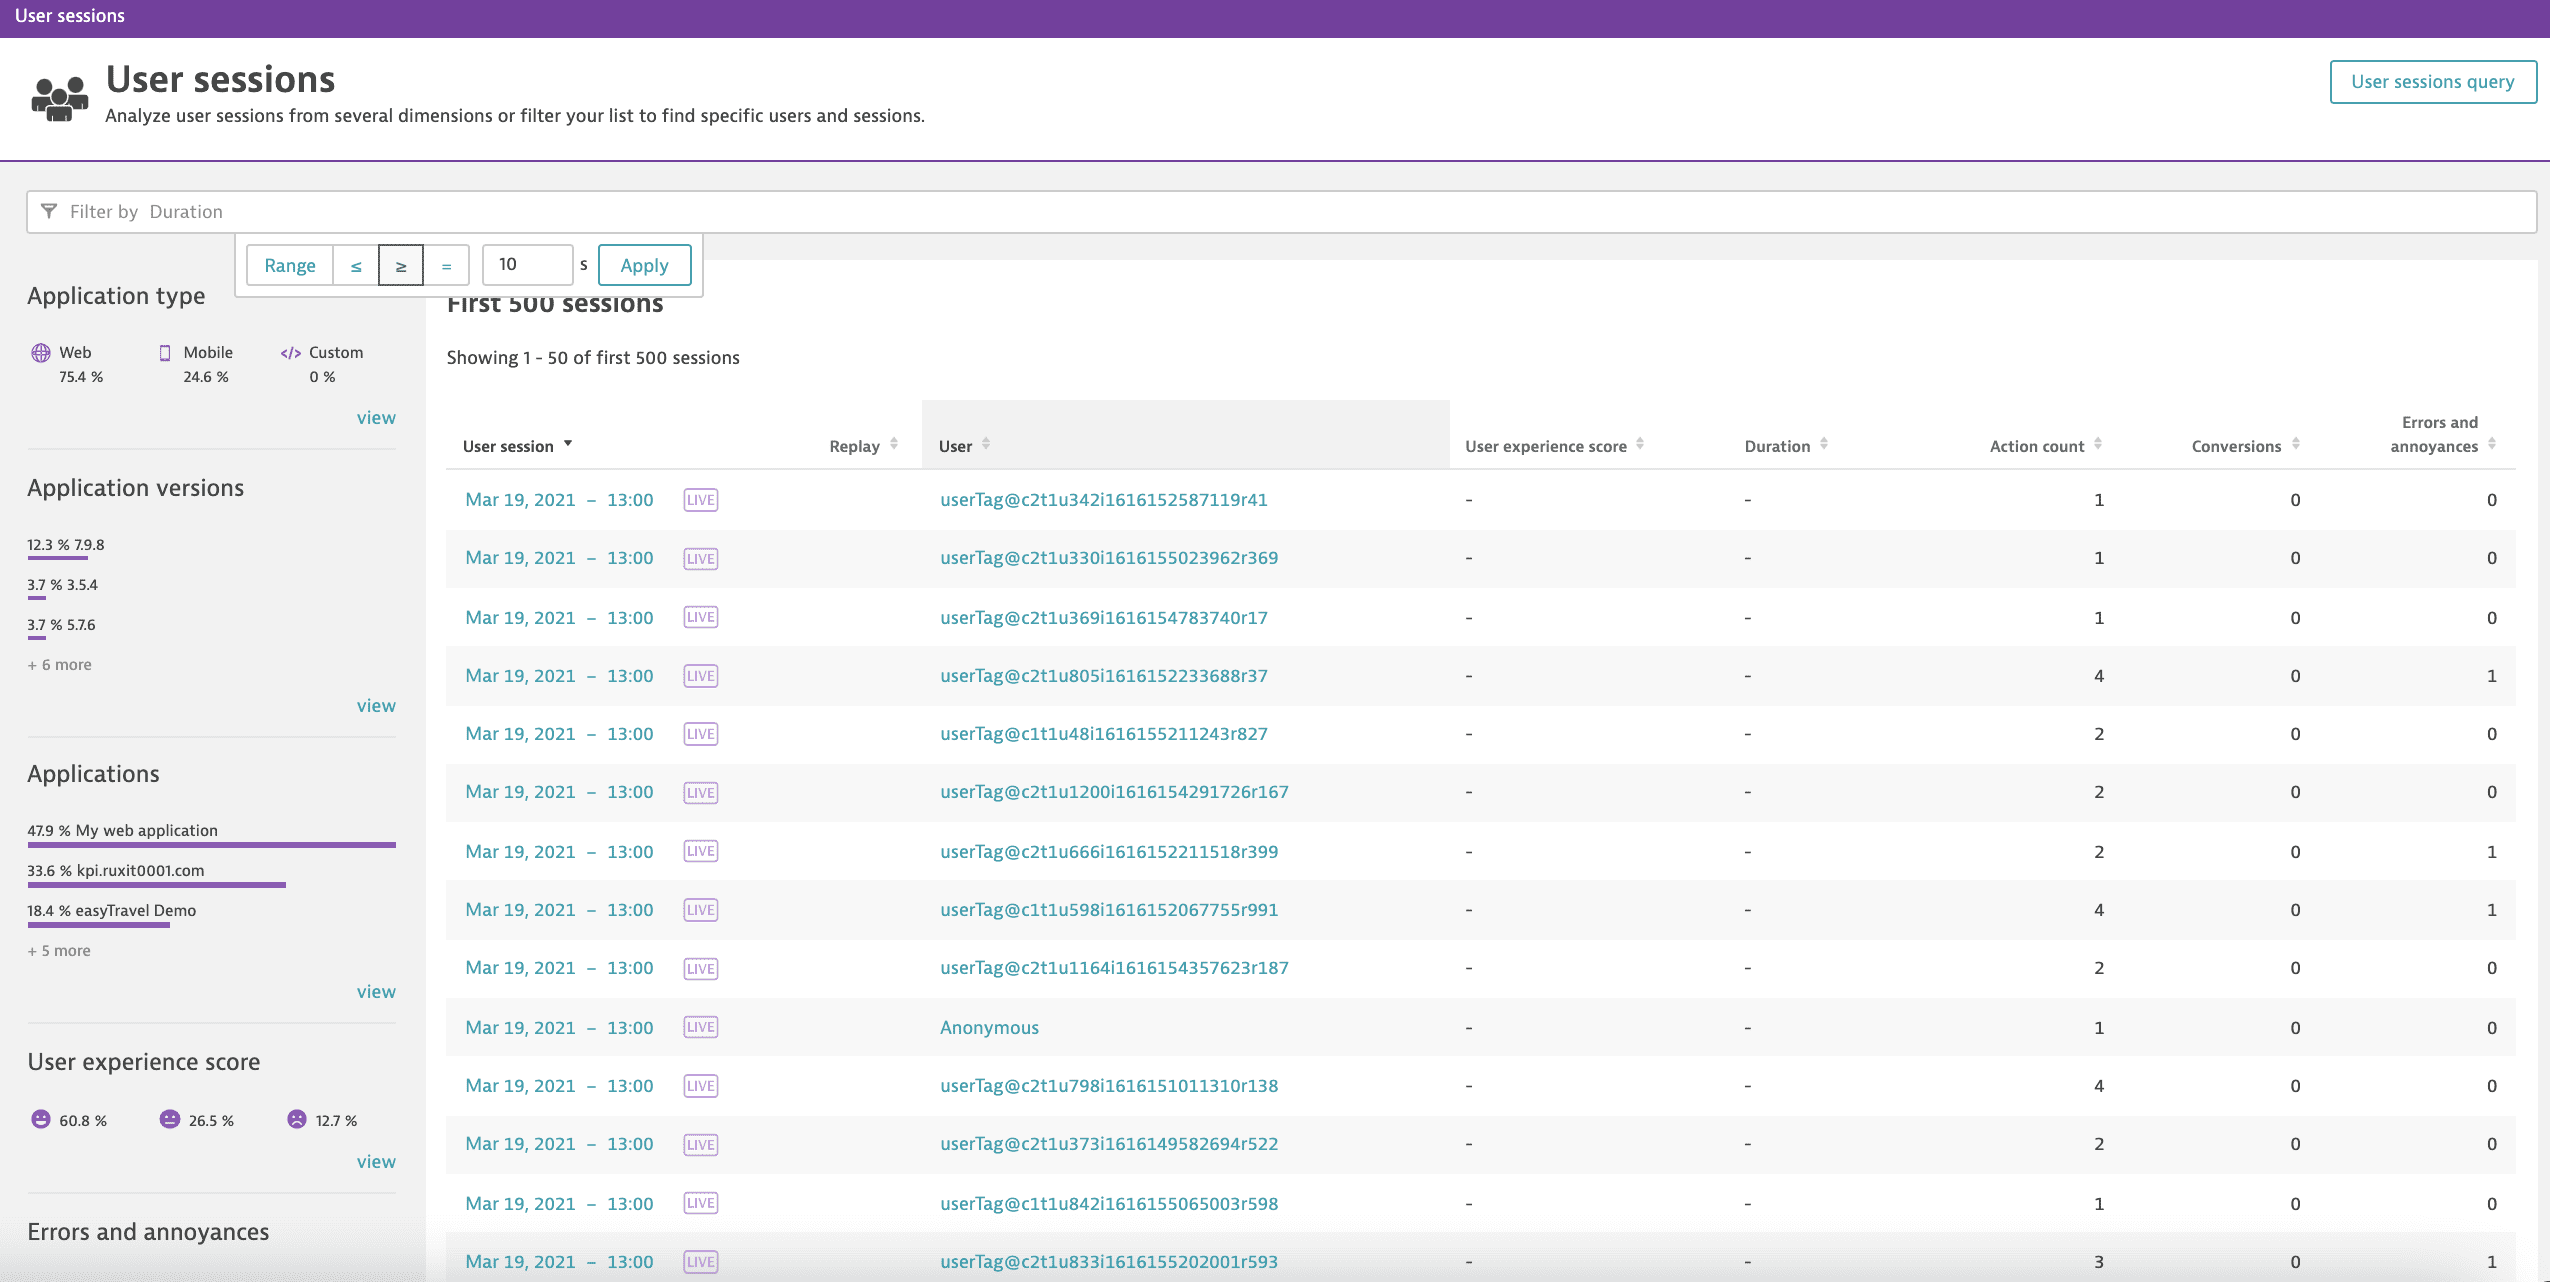
You can filter user sessions by duration: longer or shorter than a certain value or within a certain range. In the screenshot below, user sessions that have a duration of at least 10 seconds are displayed.
You can search for all user sessions that include at least one instance of any one of multiple user actions in their clickpaths.
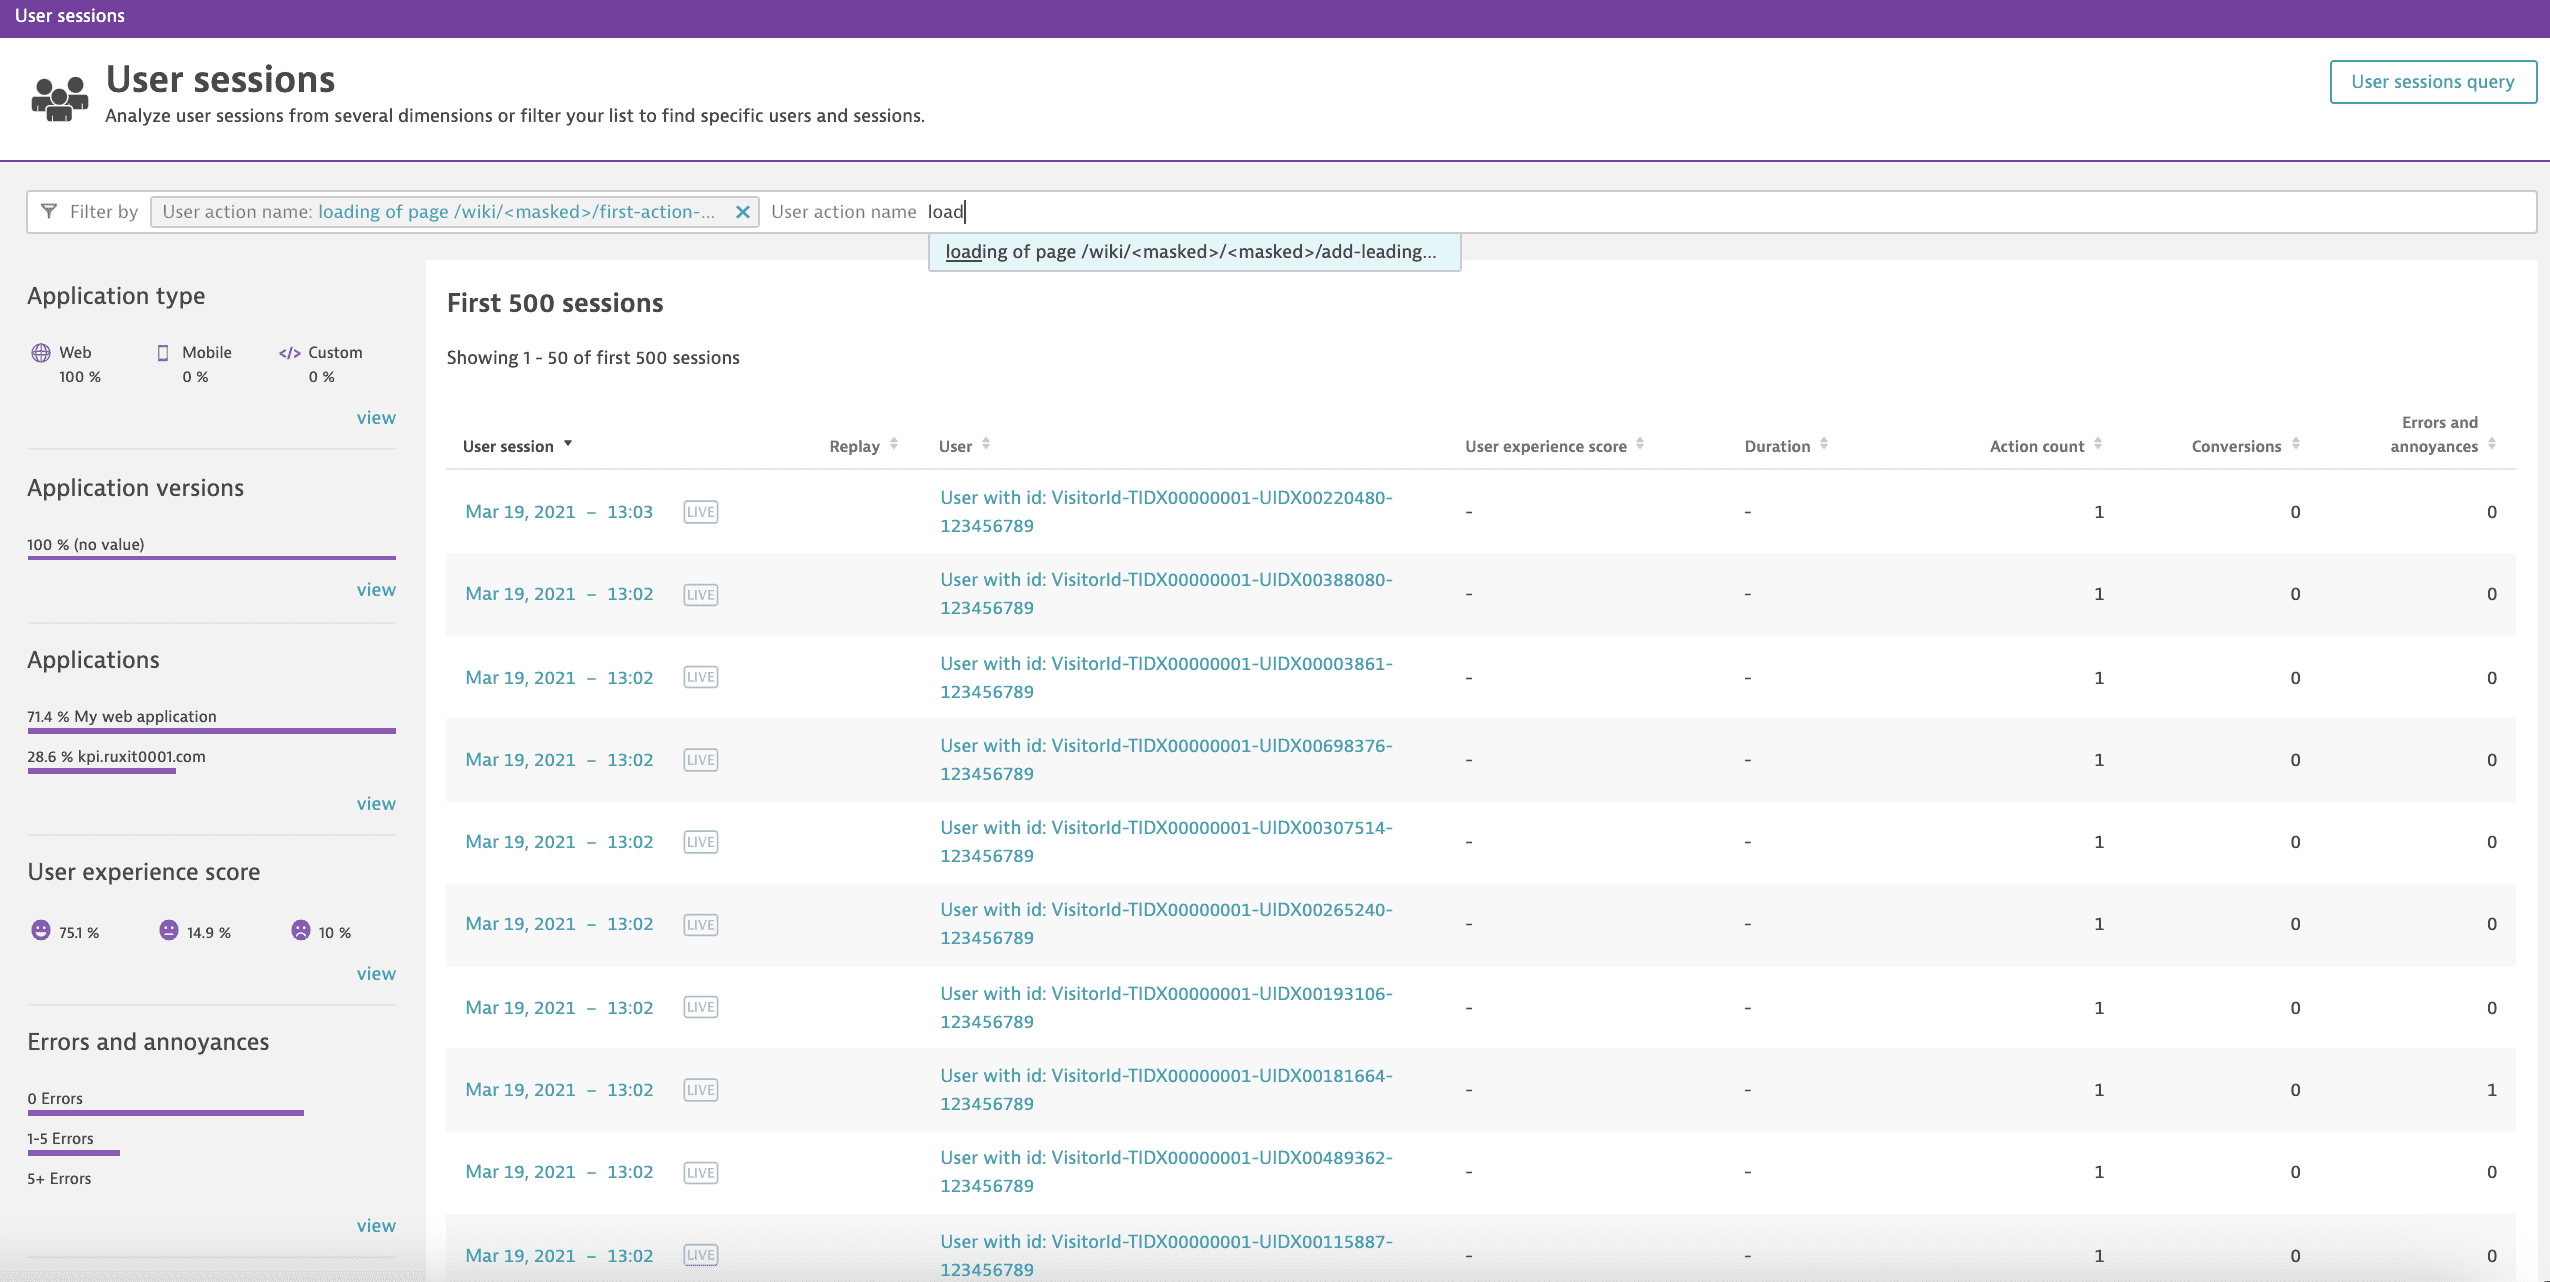
Check the filter bar in the example below. This search matches on user sessions that meet the following criteria:
- Application type: Web and Browser Type: Desktop Browser. The user accessed one of your web applications via desktop browser.
- Duration ≥ 60s. The session lasted at least 1 minute.
- Action count = 5. During the session, the user performed five actions.
- User action name: test. The user action called
testoccurred in the user session.
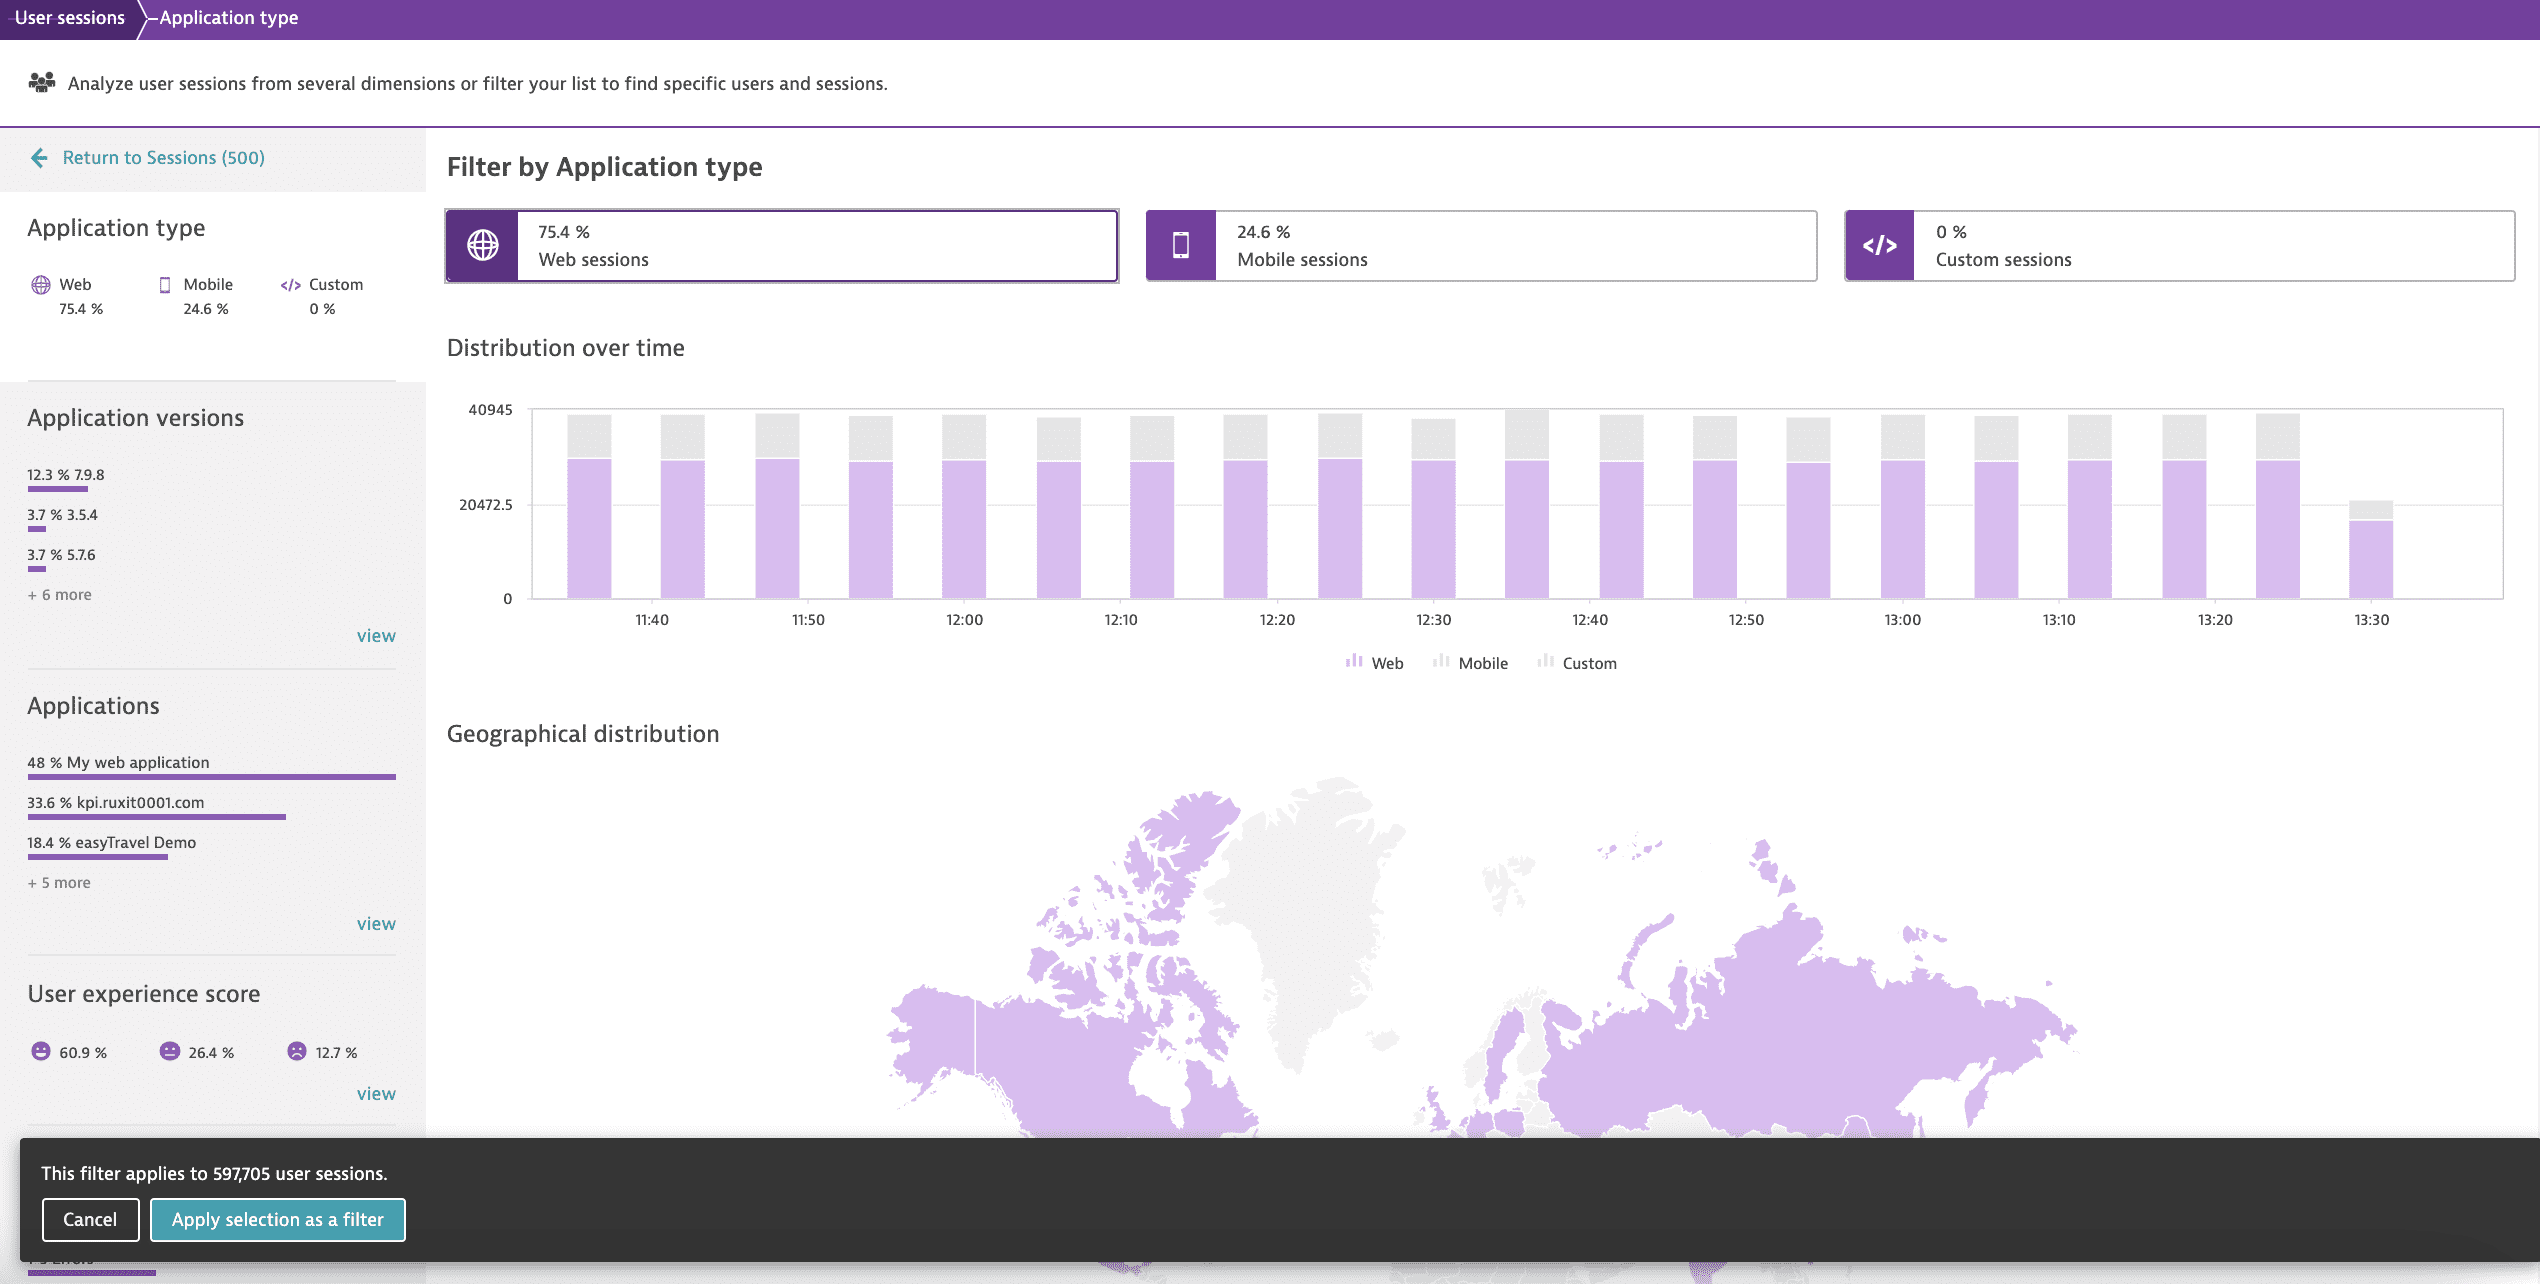
For each category on the findings panel, there's a separate section that shows visualizations and findings for that particular category. For example, Application type shows the current distribution, distribution over time, and geographical distribution of the different application types. The geographical map shows the color of the application type with the highest number of sessions.
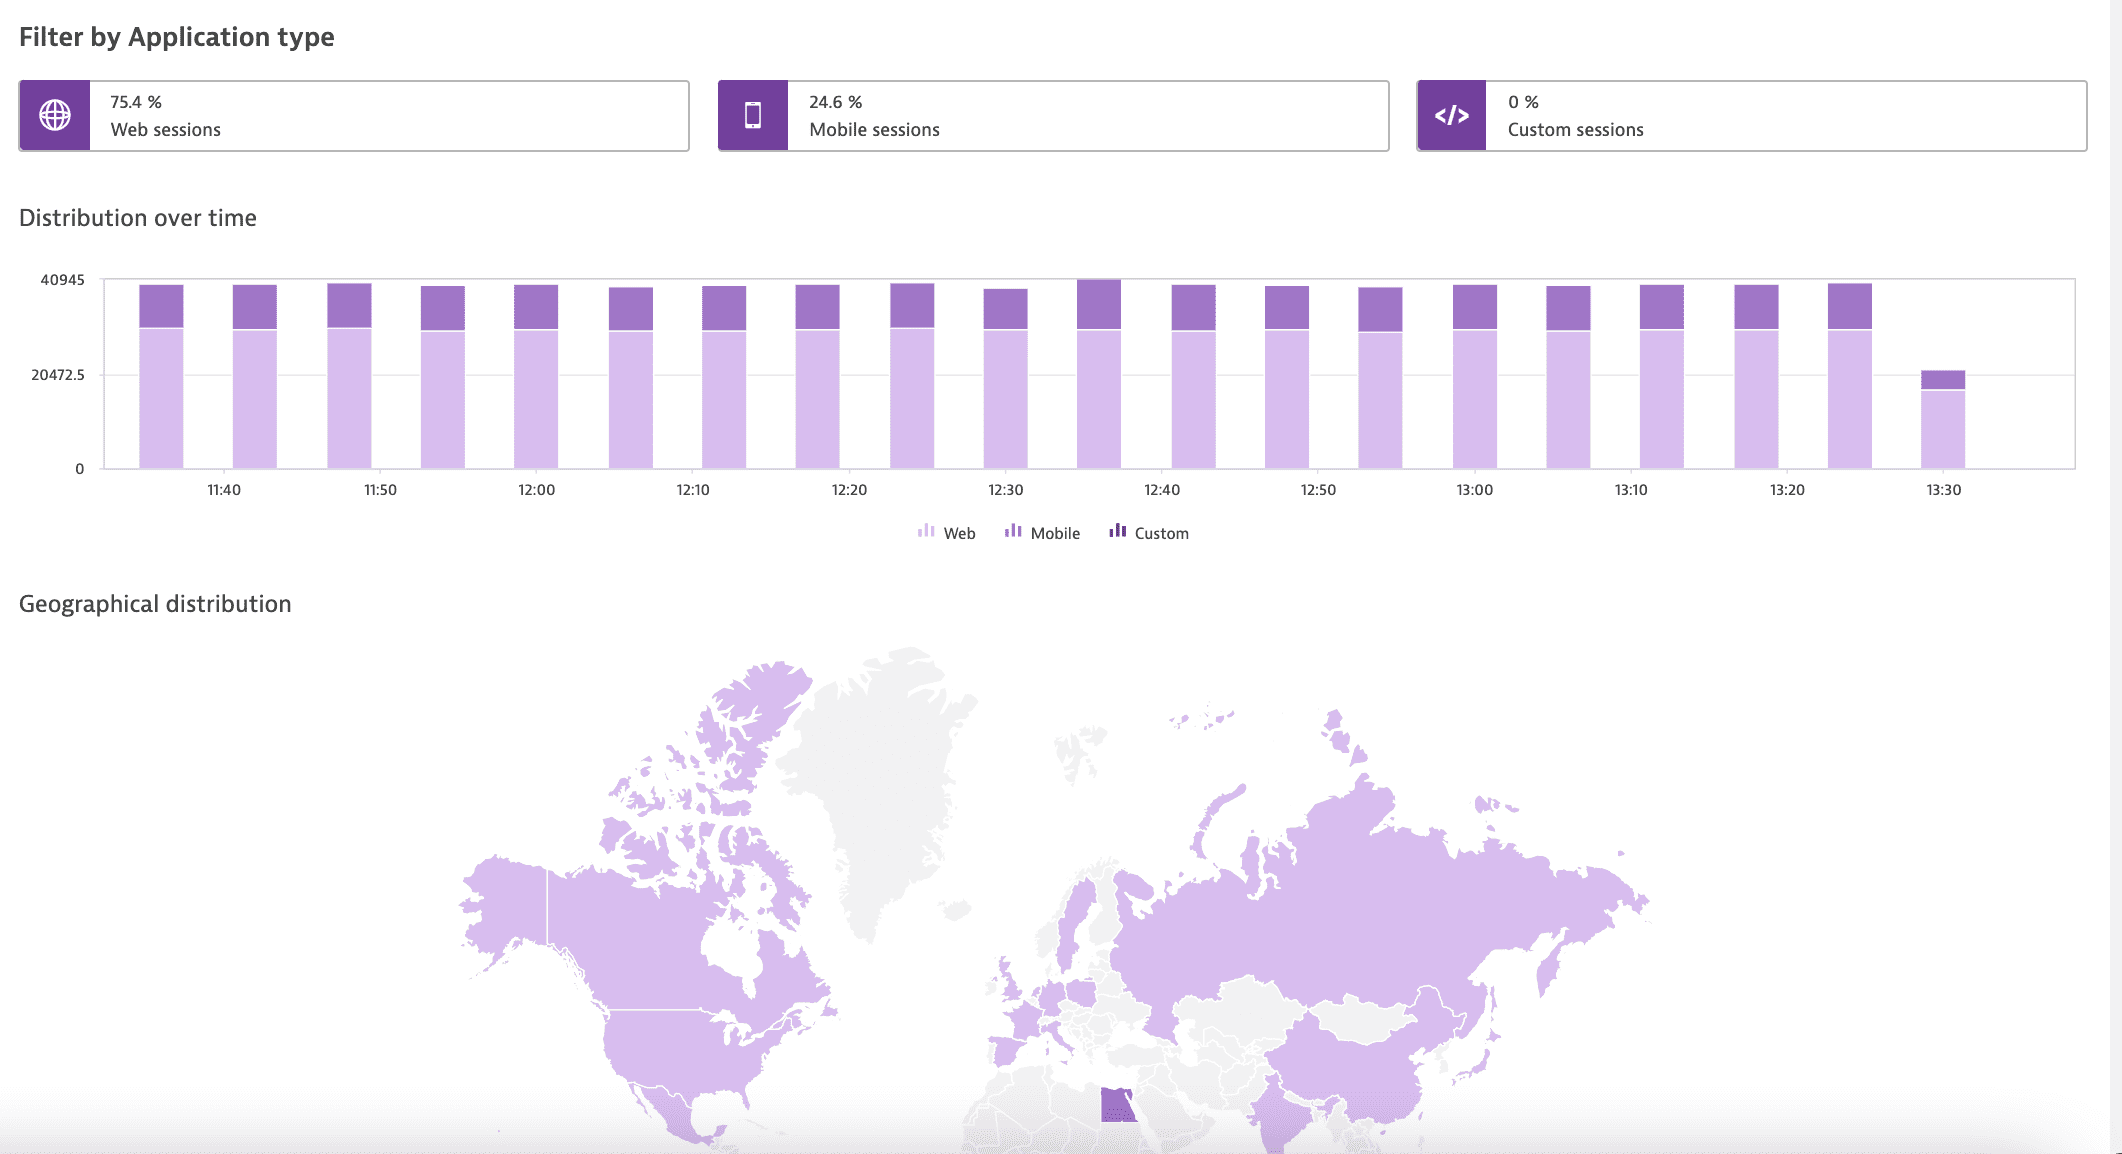
You can choose any of the findings and easily apply them by selecting Apply selection as a filter in the lower-left corner of the page.