Service flow
Dynatrace understands your applications’ transactions from end to end. This transactional insight is visualized through Service flow, which illustrates the sequence of service calls that are triggered by each service request in your environment. Within a service flow, you see the flow of service calls from the perspective of a single service, request or their filtered subset. Along with the specific services that are triggered, you can also see how each component of a request contributes to the overall response time.
To view the service flow triggered by a specific service
- Go to Services.
Select the service you want to analyze.
- On the service overview page, under Understand dependencies, select View service flow.
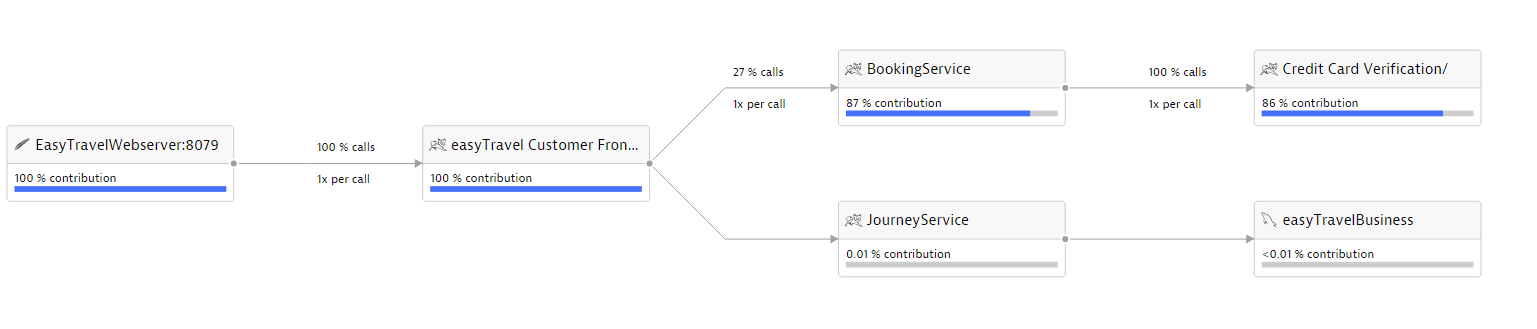
The image below shows the service flow triggered by the EasyTravelWebServer service, as well as how each initiated service contributes to the overall response time. The EasyTravelWebServer service calls a Tomcat service. The Tomcat service in turn calls two other services, which call two more services. What becomes immediately apparent is that the Credit Card Verification service contributes the most to overall response time, although its caller, BookingService, is only called by 27% of the requests. This degree of analysis enables you to understand the larger complexities within your system.
Service flow offers insights on the sequence of service-call chains across services. To understand the execution order of service calls relative to one another, use Service backtrace instead.
Service flows can become highly complex. For improved readability of service-flow data, Dynatrace aggregates services that contribute little to overall response time. Aggregated services have names like 2 services and 4 instances. Notice the aggregate named 4 services in the middle column below. Select this to see which services are aggregated here. When you select one of the aggregated services, Service flow displays the requests path of the selected service.
Aggregations are calculated dynamically based on the size of your browser window. You can use your browser's zoom in/out feature to make more space available.
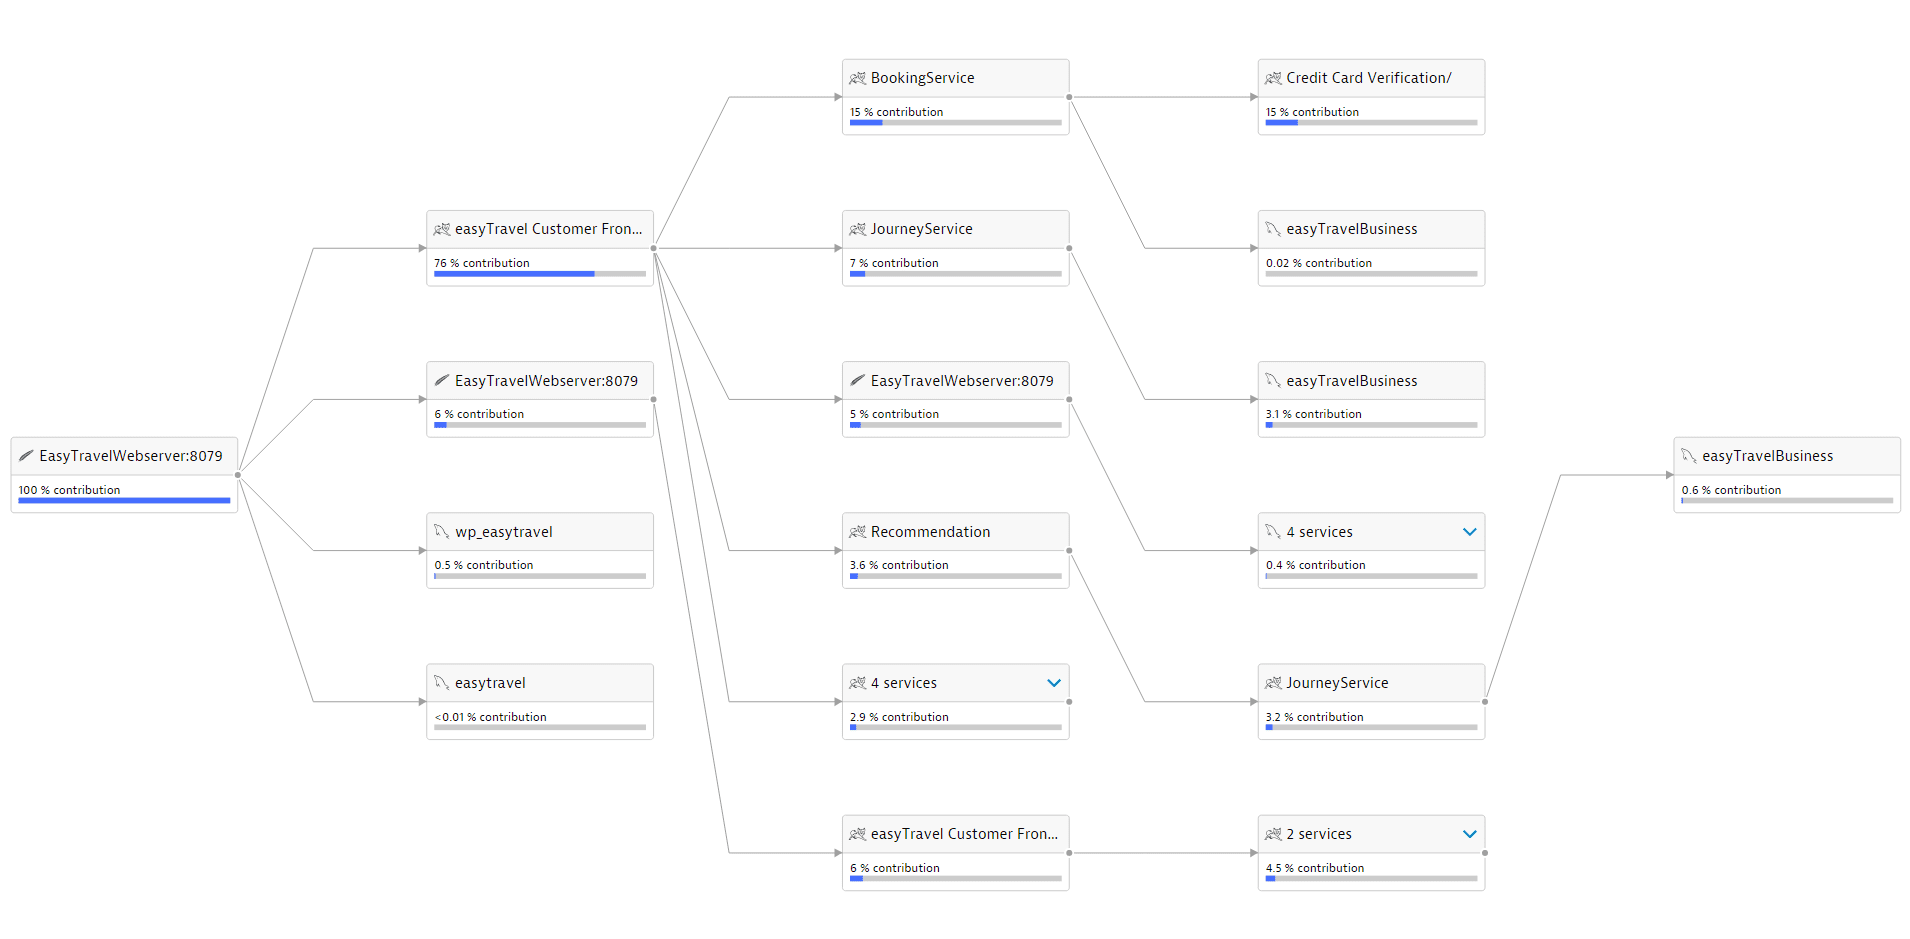
As you can see in the example above, some of the services in the above service flow appear multiple times (easyTravel Customer Frontend and EasyTravelWebserver). This is because these services were called at multiple points during the flow of this transaction. Each call performs different actions and contributes different amounts to the overall response time. Dynatrace doesn’t aggregate these varying circumstances into a single metric because individually they are significant and provide valuable insight into what’s going on at a deep level in your environment.