Memory dump analysis
Dynatrace can store and analyze memory dumps for Java, .NET, and Node.js applications.
Memory dumps are stored by OneAgent locally for a limited time on the disk of the monitored application-server machine.
If an ActiveGate is configured, then OneAgent automatically uploads the memory dumps to the ActiveGate, which acts as a long-term storage center for memory dumps. This approach ensures that memory dumps are available only to users who have access to the network location of your ActiveGate. This precaution provides an additional security layer to ensure that no personal data leaves your data center unless you configure it that way.
Before you begin
- To trigger memory dumps, you need the View sensitive request data user permission.
To store memory dumps, your application server must have adequate space.
- To access persisted memory dumps via Dynatrace web UI, configure an ActiveGate to store memory dumps in a centralized location. To learn more about memory dump retention time, see Data retention periods.
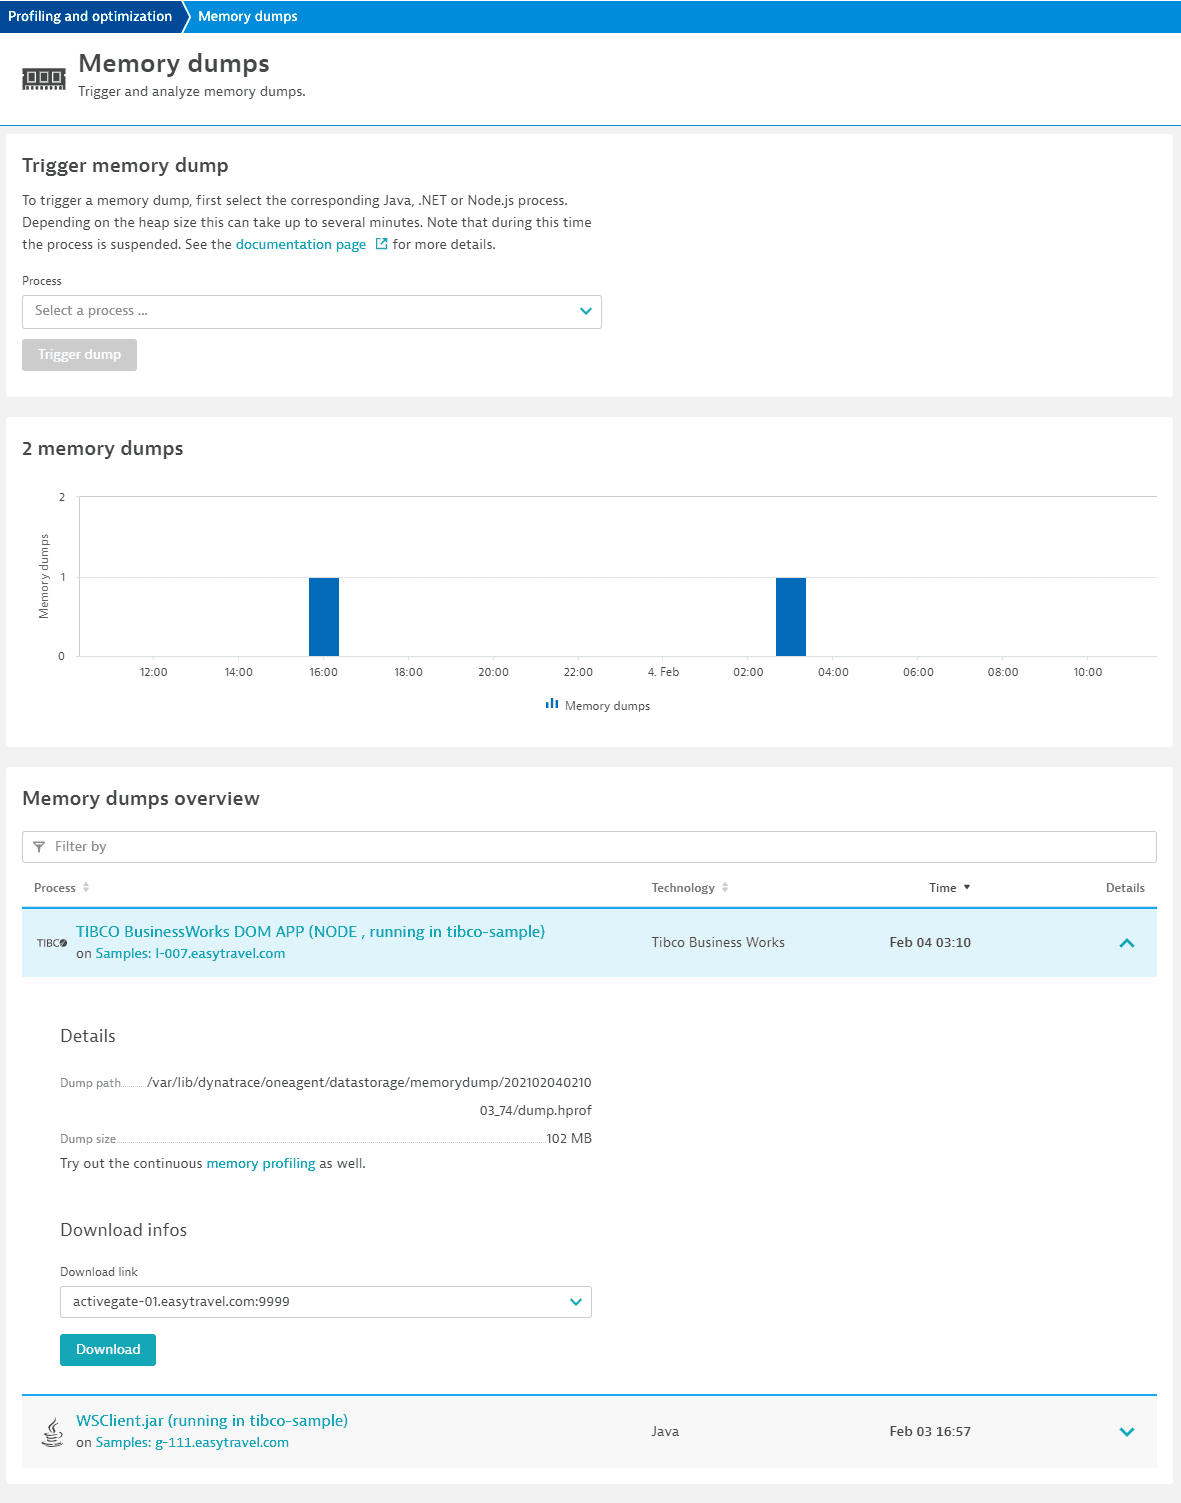
Trigger memory dumps
To trigger a memory dump
- Navigate to the Memory dumps page:
- On the page of the entity that you want to analyze, select More (…) > Memory dump details.
- Go to Profiling & Optimization > Memory dumps.
- Select the process you want to analyze and select Trigger new dump to generate a new memory dump.
It takes a few minutes to generate a memory dump. The time required varies widely based on application type. Java applications that have multiple GBs of heap memory may take several minutes; smaller dumps are available almost immediately.JavaDynatrace uses the JVM Tool Interface (JVM TI) to generate memory dumps. For this reason, your JVM may stall during memory-dump generation. Please restart your Java-based application following trigger of a memory dump.
After a few minutes, refresh the page. The newly created dump now appears in the list.
Download and view memory dumps
To download memory dumps
-
Navigate to the Memory dumps page:
- On the page of the entity that you want to analyze, select More (…) > Memory dump details.
- Go to Profiling & Optimization > Memory dumps.
-
Expand your memory dump record.
-
From the Download link list, select the ActiveGate from where you want to download the memory dump, and select Download.
If you can't download the memory dump via UI, download the file manually at local path indicated in the web UI. Note that memory dumps that are stored by OneAgent locally are available for a limited time; when OneAgent periodically empties the directory, the file size could be 0 bytes.
In the case of Java applications, the download provides the memory dump in hprof format, which can be analyzed using a number of tools, including Eclipse Memory analyzer and VisualVM. The IBM JVM doesn't support hprof, but its own format called IBM Portable Heap Dump (PHD). This can also be analyzed by the Eclipse Memory analyzer.
Node.js memory dumps can be opened in Google Chrome's integrated memory heap snapshot analysis tool.
.NET memory dumps can be opened in PerfView or Visual Studio.
Limitations
.NET memory dumps are not supported in Alpine Linux based containers.
Upload to ActiveGate is not supported for OneAgent Java code module in standalone mode.
Frequently asked questions
ActiveGates have an automatically assigned priority. If more than one ActiveGate has the same priority, an endpoint is selected randomly.
OneAgent attempts to send the dump list to all available endpoints until it finds one that works. This process is retried until it's successful or until the dumps are deleted by aging tasks (for example, if there are too many or if they are too old).
ActiveGate first deletes outdated dumps. If there are no outdated dumps, ActiveGate deletes the oldest dumps first.
Yes. OneAgent stores memory dumps locally and ensures that dumps do not leave your local network. You can customize the location of the memory dumps.
Yes. Because from time to time an ActiveGate endpoint might not be accessible to the end user, ActiveGates can have multiple IP addresses, and so multiple endpoints. If all of the existing endpoints are not accessible to the end user at the same time, you can still provide access to the memory dump file.
-
You can enable remote access to the ActiveGate by changing the public endpoints.
To learn how to configure a new endpoint, see: -
If remote access to the ActiveGate is not possible, you can download the memory dump file manually from the ActiveGate host.
To access the ActiveGate host, use a protocol that allows you to transfer files (such as sFTP or SSH).
- To download the memory dump file, you need to learn the location of the file.
- To be able to identify the memory dump, unzip its file via a protocol that includes a
summary.json(such as sFTP or SSH).