Remediation tracking
Remediation tracking allows you to track the remediation progress of individual entities (process groups, processes, or Kubernetes nodes) that are affected by a third-party vulnerability.
For process groups and Kubernetes nodes, you can control which of these entities you want to track and which you want to discard. For instance, if you think an entity isn't relevant or is a false positive, you can mute it. By muting an entity, you hide third-party vulnerabilities for certain process groups or Kubernetes nodes.
Muted entities aren't taken into consideration in any context, such as Davis Security Score or Application Security metrics.
To ensure proper handling of newly affected entities, muting all entities doesn't mute the vulnerability itself. Other affected entities may exist that aren't visible to a particular user due to permission restrictions or the selected management zone.
Remediation tracking for process groups
Access remediation tracking for process groups
To access remediation tracking for process groups that are related to a vulnerability
- Go to Third-Party Vulnerabilities.
- Select Details for the vulnerability you want.
- Select View all process groups.
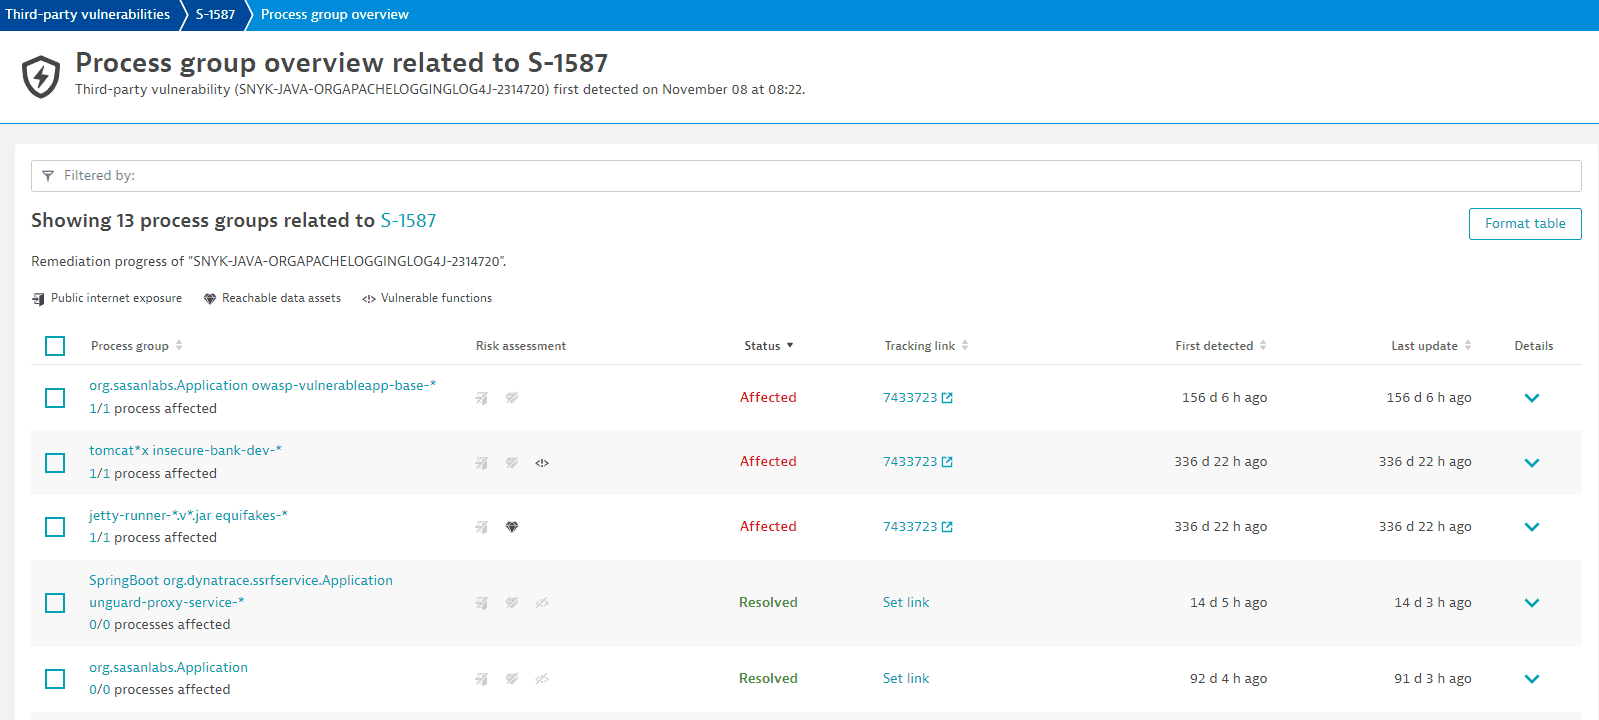
On the Process group overview page, you can
Filter for process groups
You can filter for process groups by
-
Entity name: Full or partial name.
-
Status:
Affected,Resolved, orMuted. -
Tracking link: Full or partial title of a tracking link that has already been set up. For details, see tracking link.
-
Public internet exposure:
Public networkorNot detected. -
Reachable data assets:
Within rangeorNone within range. -
Name of vulnerable function in use: You can use two colons in your search term (
<class>::<function>) to specify the function and/or class name you're looking for:<class>::to filter by a specific class name.<class>::<function>to filter for a specific function in a specific class.<function>to filter for a specific function name in any class.
You can find the class and function names in the Vulnerable functions section on the details page of a vulnerability.
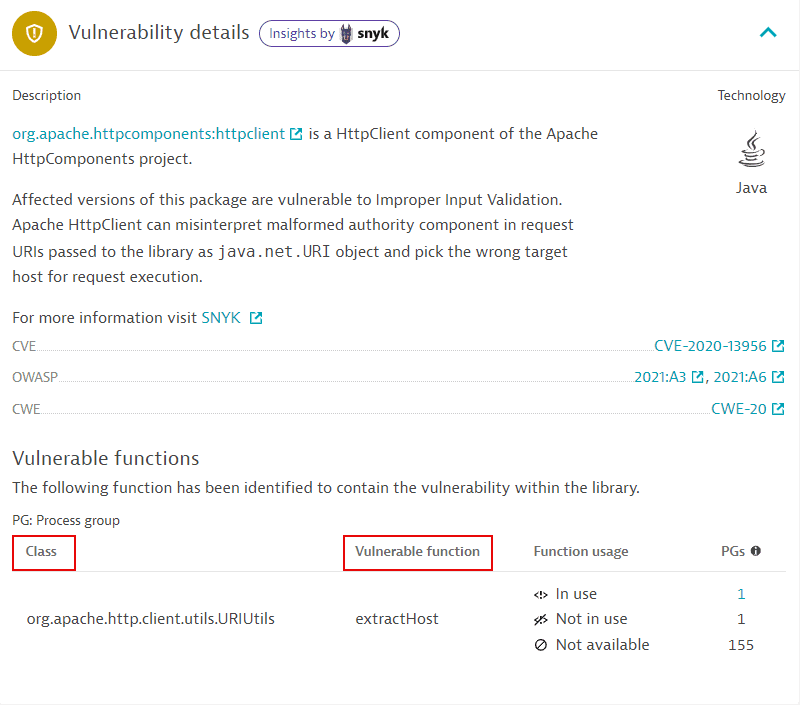
This section is not displayed
-
If no vulnerable function information is provided by Snyk.
-
For runtime vulnerabilities, which are based on the NVD feed.
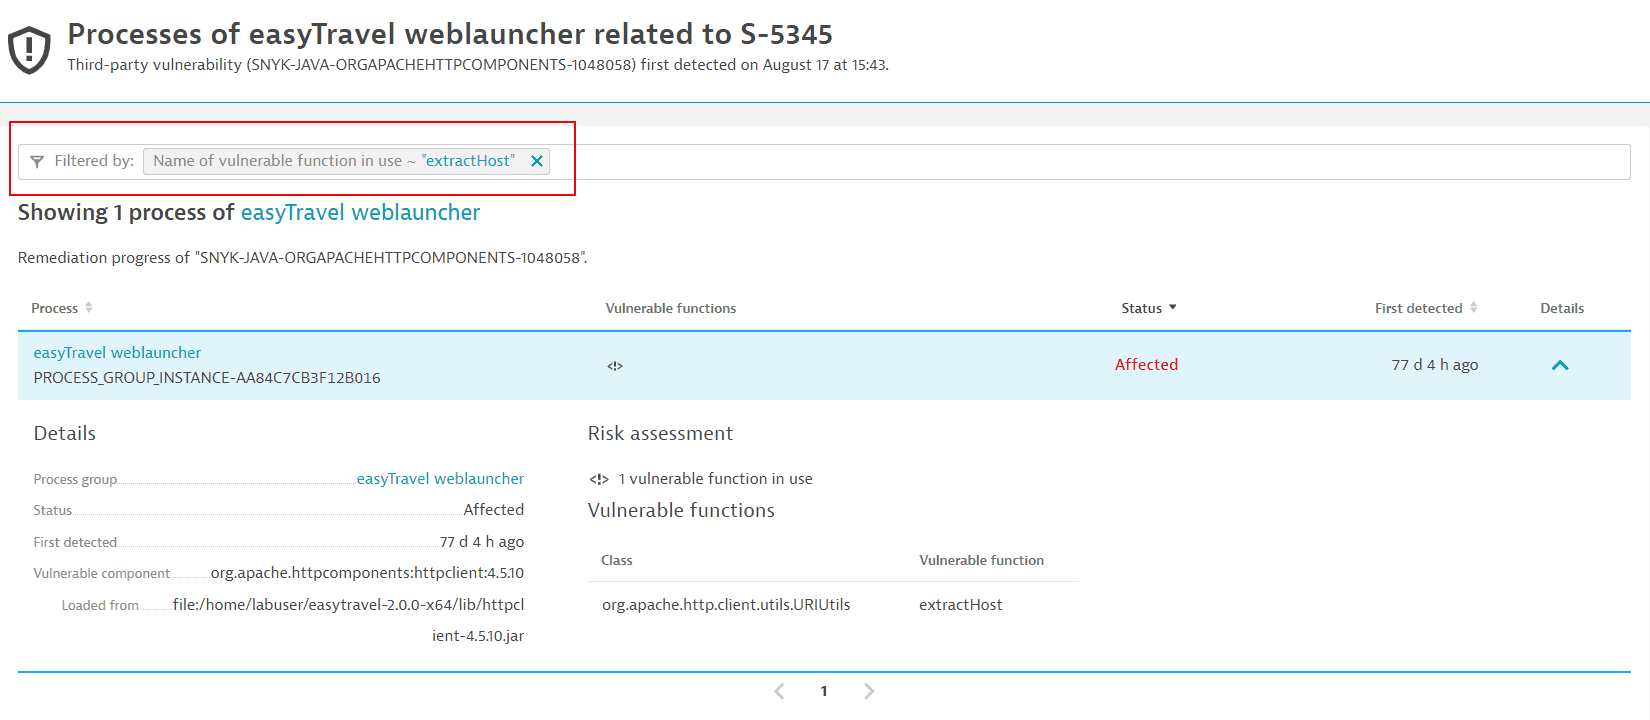
In the example above, the class is
org.apache.http.client.utils.URIUtils, and the function isextractHost. On the remediation tracking page of process groups related to a vulnerability, you can use the following syntax to filter- By class:
org.apache.http.client.utils.URIUtils:: - By function:
extractHost - By the function in the class:
org.apache.http.client.utils.URIUtils::extractHost
Example result of filtering by class:
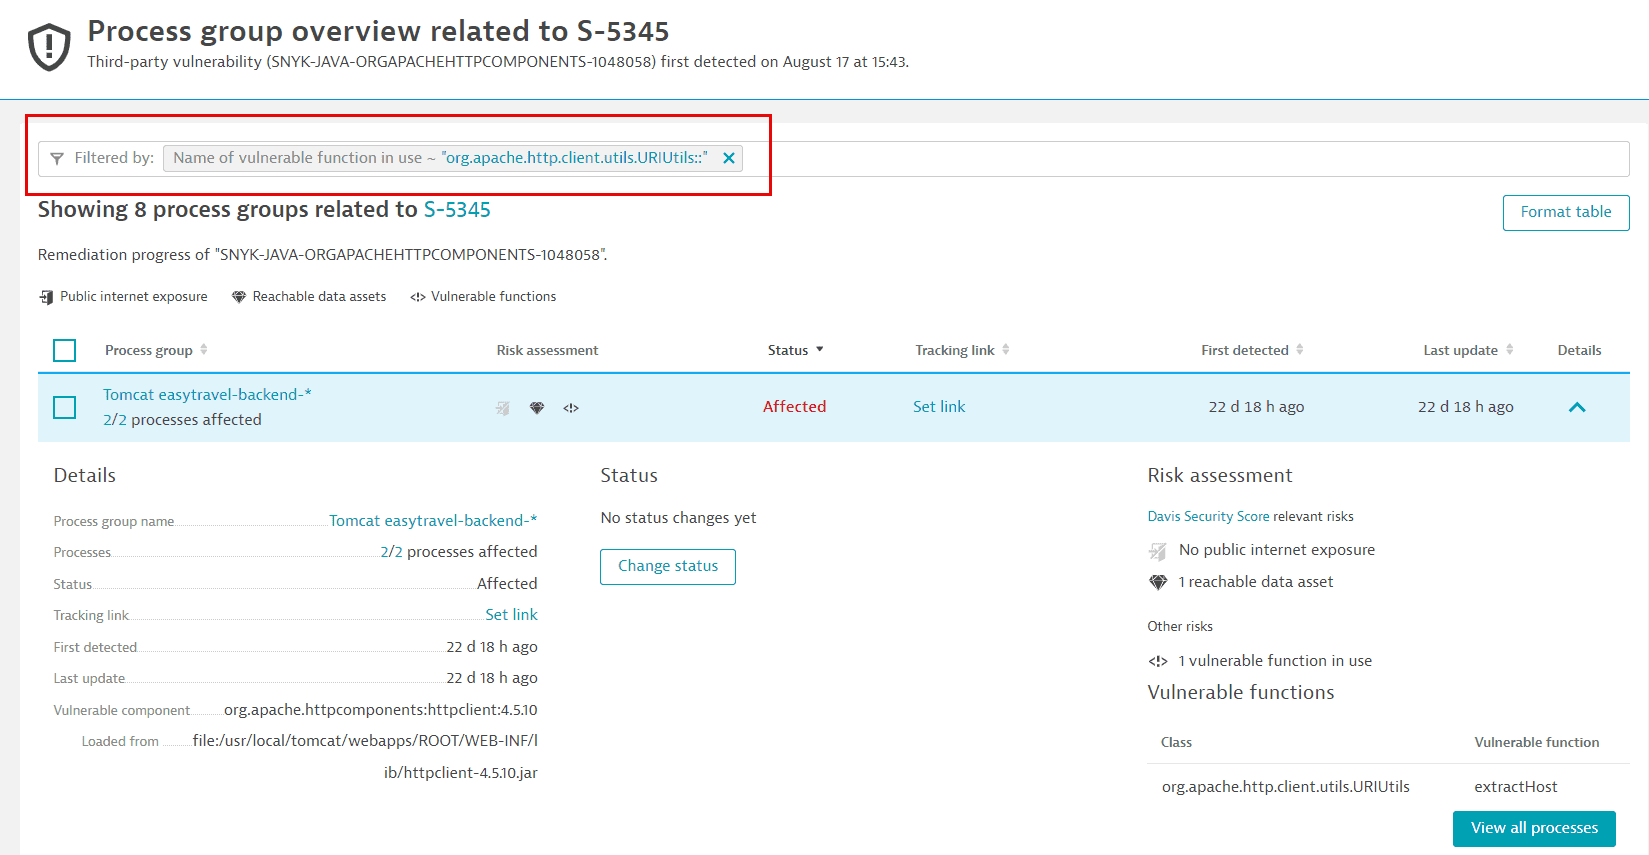
-
Vulnerable functions usage:
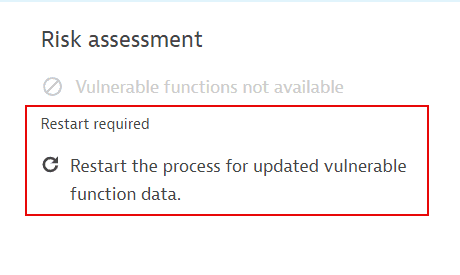
In use,Not in use, orRestart required.For more information about
Restart required, see FAQ: How can I know if information about vulnerable functions is outdated and what can I do about it?. -
Assessment accuracy:
Fullfilters for related process groups that run in Full-Stack Monitoring mode.Reducedfilters for related process groups that run in Infrastructure Monitoring mode or OneAgent Discovery mode.
For details, see Monitoring modes.
Track remediation progress for process groups
The process group list provides the following information.
Process group
The name of the related process group with a link to the process group details page.
The number of currently affected processes out of the total number of processes in that process group, indicating the remediation progress.
Risk assessment
- If the vulnerability affects a process group that, based on the Dynatrace entity model (Smartscape), is exposed to the internet, the public internet exposure symbol is displayed.
If the vulnerability affects a process group that, based on the Dynatrace entity model, has database access, the reachable data symbol is displayed.
Status
-
Current status of the related process group (
Affected,Resolved, orMuted).
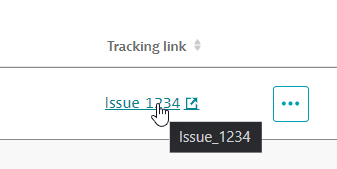
Tracking link
To track a vulnerability's remediation progress, you can add links to tickets created in your own issue tracking system for the affected entity. Once you add a tracking link, select it to navigate to the associated URL, which opens in a new page. You can easily check, for example, if someone is already working on fixing the vulnerability.
You can add, update, and delete a tracking link individually (for one process group at a time) or in bulk (for several process groups at the same time).
First detected
A timestamp showing when the related process group was first detected.
Last update
A timestamp showing when the status of the related process group was last updated.
Details
Detailed information about the selected process group.
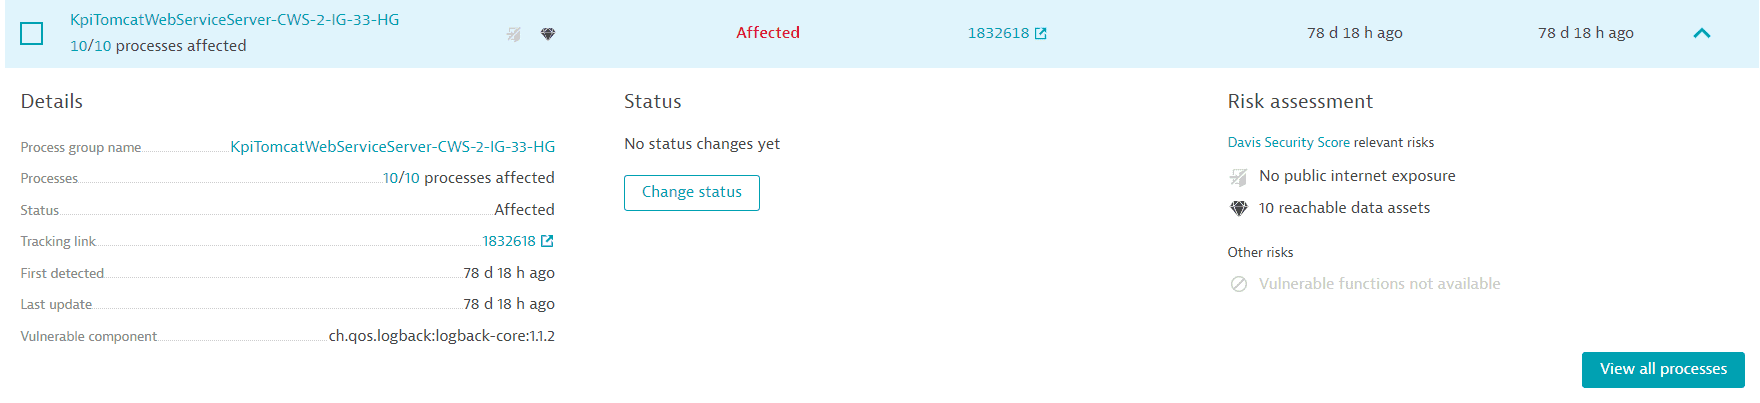
The process group details section provides the following information:
-
Details:
- Process group name: The name of the affected process group (for example,
IIS app pool dotNetBackend_easyTravel_x64) with a link to the process group details page. - Processes: The number of currently affected processes out of the total number of processes in that process group, indicating the remediation progress. (for example,
2/10 processes affected). - Status: The current status of the affected process group (
Affected,Resolved, orMuted). - Tracking link: Existing tracking links appear here. If no tracking link has been added, you can select Set link to add one.
- First detected: A timestamp showing when the related process group was first detected.
- Last update: A timestamp showing when the status of the affected process group was last updated.
- Vulnerable component: The name of the vulnerable component (for example,
.NET 3.5.1.0 .NET Framework).- Loaded from: The origin of the vulnerable component; shows where the vulnerable component was loaded from (for example,
jar:file:/app/app.jar!/BOOT-INF/lib/spring-web-5.2.2.RELEASE.jar!/).
This feature is only displayed for vulnerable Java software components.
- Loaded from: The origin of the vulnerable component; shows where the vulnerable component was loaded from (for example,
- Process group name: The name of the affected process group (for example,
-
Status: The latest status change.
If the status has changed, Dynatrace displays when the change occurred and who performed the change (if applicable).
- If the status hasn't changed, No status changes yet is displayed.
-
Risk assessment:
-
If there's any public internet exposure.
If the symbol is grayed out and crossed out, no public internet exposure was found. If the symbol isn't present, there's no data available.
-
If there are any reachable data assets affected.
If the symbol is grayed out and crossed out, there aren't any reachable data assets. If the symbol isn't present, there's no data available.
-
If there are any vulnerable functions in use by a process.
If the symbol is grayed out and crossed out, there's no vulnerable function in use. If the symbol isn't present, there's no data available. For details, see FAQ: Why is there no data available for vulnerable functions?.
-
If process restart is required, with a link to the specific processes that need to be restarted.
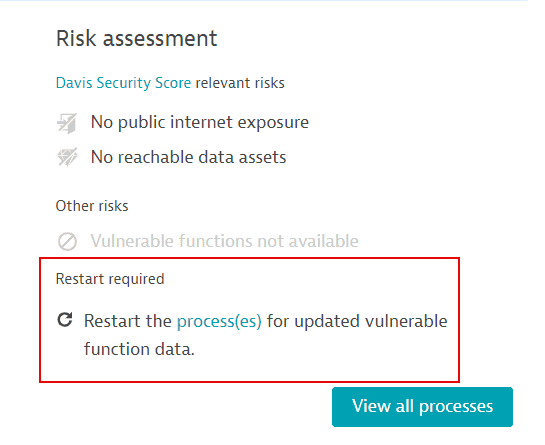
For more information, see FAQ: How can I know if information about vulnerable functions is outdated and what can I do about it?.
-
Change vulnerability status of process groups
To change the vulnerability status of
-
One affected process group:
- On Process group overview, go to Details of the process group and select Change status.
- Select the new status and enter any additional information, and then select Save.
-
Multiple affected process groups:
- On Process group overview, select the process groups you want from those displayed on the page and then select Yes, change status.
- Select the new status, enter any additional information, and then select Save.
The option to perform bulk changes isn't available to users with view-only access. The Manage security problems permission is required. For details on permission management, see Fine-tune permissions.
Remediation tracking for processes
Access remediation tracking for processes
To access remediation tracking for processes that are related to a vulnerability
- Go to Third-Party Vulnerabilities.
- Select Details for the vulnerability you want.
- Select View all process groups.
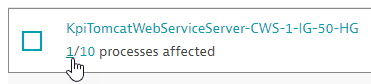
- In the Process group column, under the name of the process group you want, select one of the two numbers to view:
-
The affected processes
-
The related processes (
AffectedandResolved)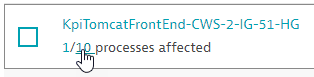
-
On the Process overview page, you can
Filter for processes
You can filter for processes by
-
Entity name: Full or partial name.
-
Status:
AffectedorResolved. -
Name of vulnerable function in use: You can use two colons in your search term (
<class>::<function>) to specify the function and/or class name you are looking for:<class>::to filter by a specific class name.<class>::<function>to filter for a specific function in a specific class.<function>to filter for a specific function name in any class.
You can find the class and function names in the Vulnerable functions section on the details page of a vulnerability.
This section is not displayed
-
If no vulnerable function information is provided by Snyk.
-
For runtime vulnerabilities, which are based on the NVD feed.
In the example above, the class is
org.apache.http.client.utils.URIUtils, and the function isextractHost. On the remediation tracking page for processes related to a vulnerability, you can use the following syntax to filter- By class:
org.apache.http.client.utils.URIUtils:: - By function:
extractHost - By the function in the class:
org.apache.http.client.utils.URIUtils::extractHost
Example result of filtering by function:
-
Vulnerable functions usage:
In use,Not in use, orRestart required.For more information about
Restart required, see FAQ: How can I know if information about vulnerable functions is outdated and what can I do about it?.
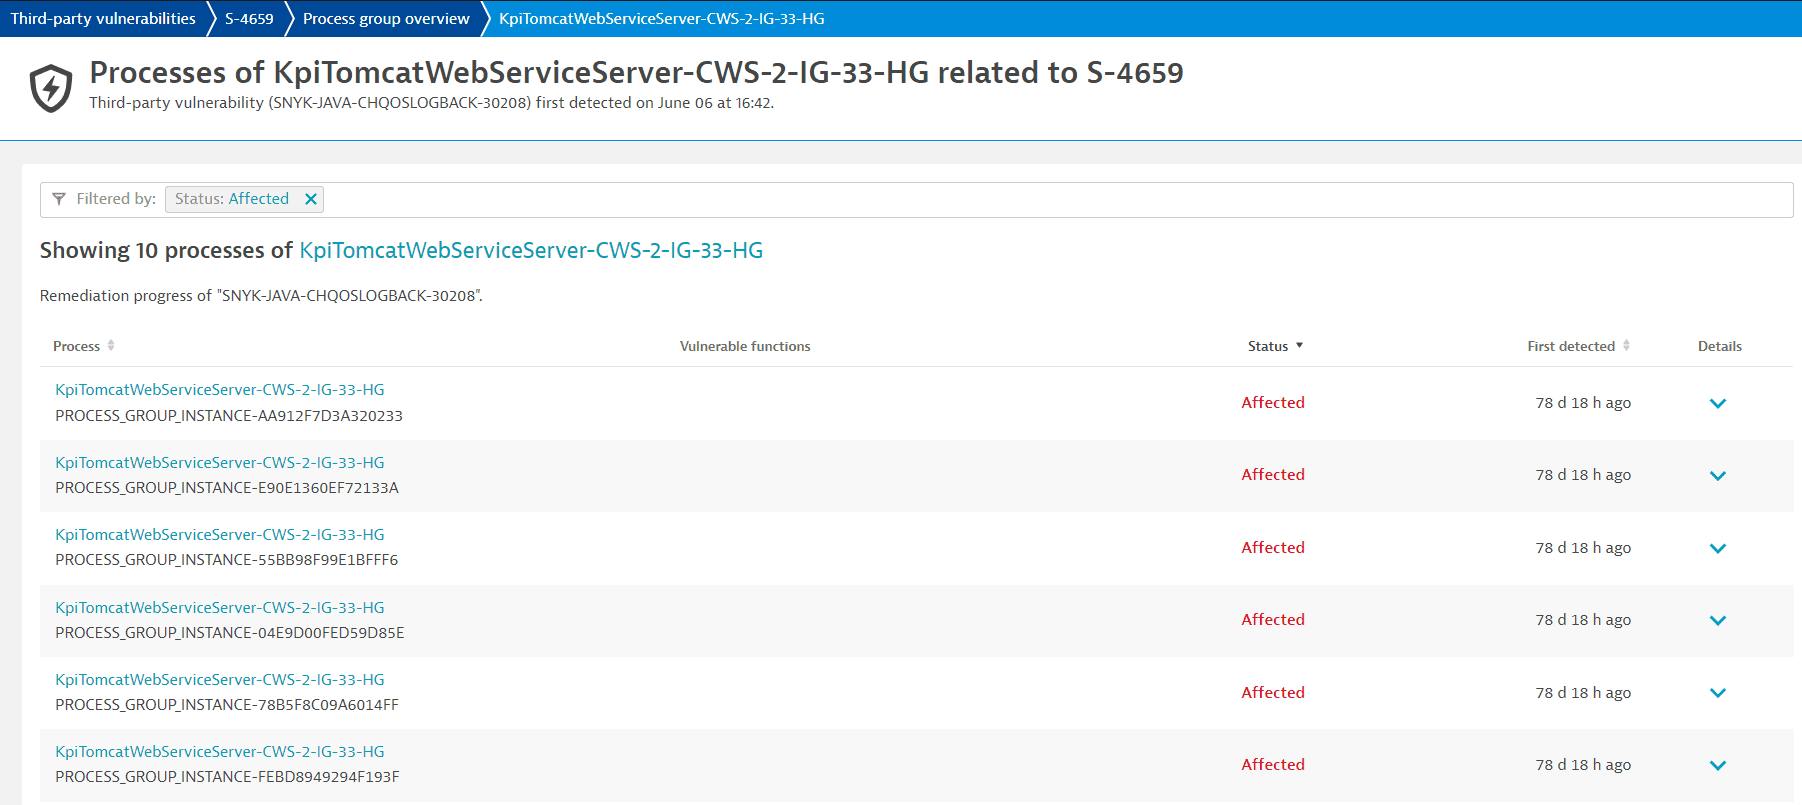
Track remediation progress for processes
The process list provides the following information.
Process
- The name of the related process (for example,
KpiTomcatFrontEnd-CWS-2-IG-51-HG) with a link to the process details page. - The Dynatrace ID of the related process (for example,
PROCESS_GROUP_INSTANCE-B63193A779301A0E), to distinguish it from other processes with the same name.
Vulnerable functions
-
If there are any vulnerable functions in use by the process, the vulnerable function symbol is displayed.
If the symbol is grayed out and crossed out, there's no vulnerable function in use. If the symbol isn't present, there's no data available. For details, see FAQ: Why is there no data available for vulnerable functions?.
-
If information about vulnerable functions is outdated, the restart symbol is displayed.
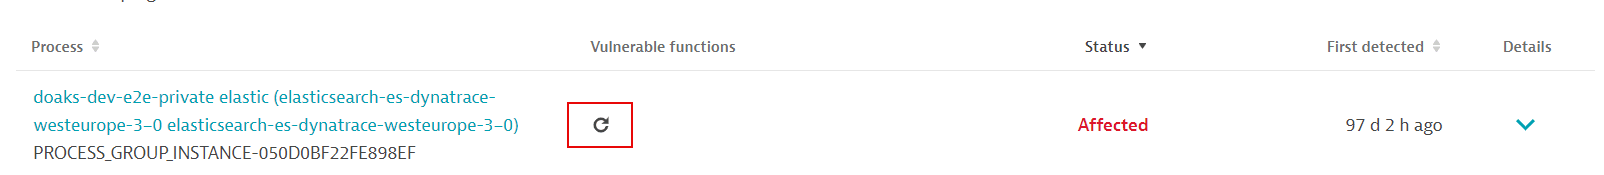
For more information, see FAQ: How can I know if information about vulnerable functions is outdated and what can I do about it?.
Status
The current status of the related process (Affected or Resolved).
First detected
A timestamp showing when the related process was first detected.
Details
Detailed information about the selected process.
The process details section provides the following information:
-
Details:
- Process group name: The name of the related process group (for example,
IIS app pool dotNetBackend_easyTravel_x64) with a link to the process group details page. - Status: The current status of the related process (
AffectedorResolved). - First detected: A timestamp showing when the related process was first detected.
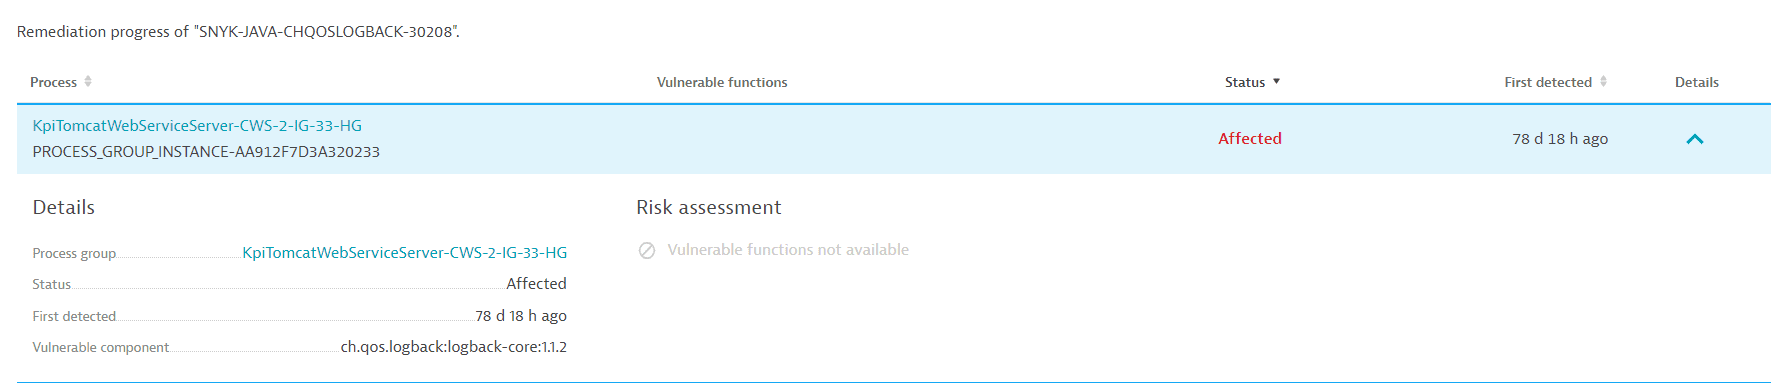
- Vulnerable component: The name of the vulnerable component (for example,
.com.fasterxml.jackson.core:jackson-databind:2.9.9).- Loaded from: The origin of the vulnerable component; shows where the vulnerable component was loaded from (for example,
jar:file:/app/app.jar!/BOOT-INF/lib/spring-web-5.2.2.RELEASE.jar!/).
This feature is only displayed for vulnerable Java software components.
- Loaded from: The origin of the vulnerable component; shows where the vulnerable component was loaded from (for example,
- Process group name: The name of the related process group (for example,
-
Risk assessment: Presence of vulnerable functions in use by the process.
-
If there are any vulnerable functions in use by the process, the vulnerable function symbol is displayed.
-
If the symbol is grayed out and crossed out, there's no vulnerable function in use.
-
If the symbol isn't present, there's no data available. For details, see FAQ: Why is there no data available for vulnerable functions?.
-
If information about vulnerable functions is outdated, you are prompted to restart the process.
For more information, see FAQ: How can I know if information about vulnerable functions is outdated and what can I do about it?.
-
Remediation tracking for Kubernetes nodes
Access remediation tracking for nodes
To access remediation tracking for Kubernetes nodes that are related to a vulnerability
- Go to Third-Party Vulnerabilities.
- Select Details for the vulnerability you want.
- Select View all Kubernetes nodes.
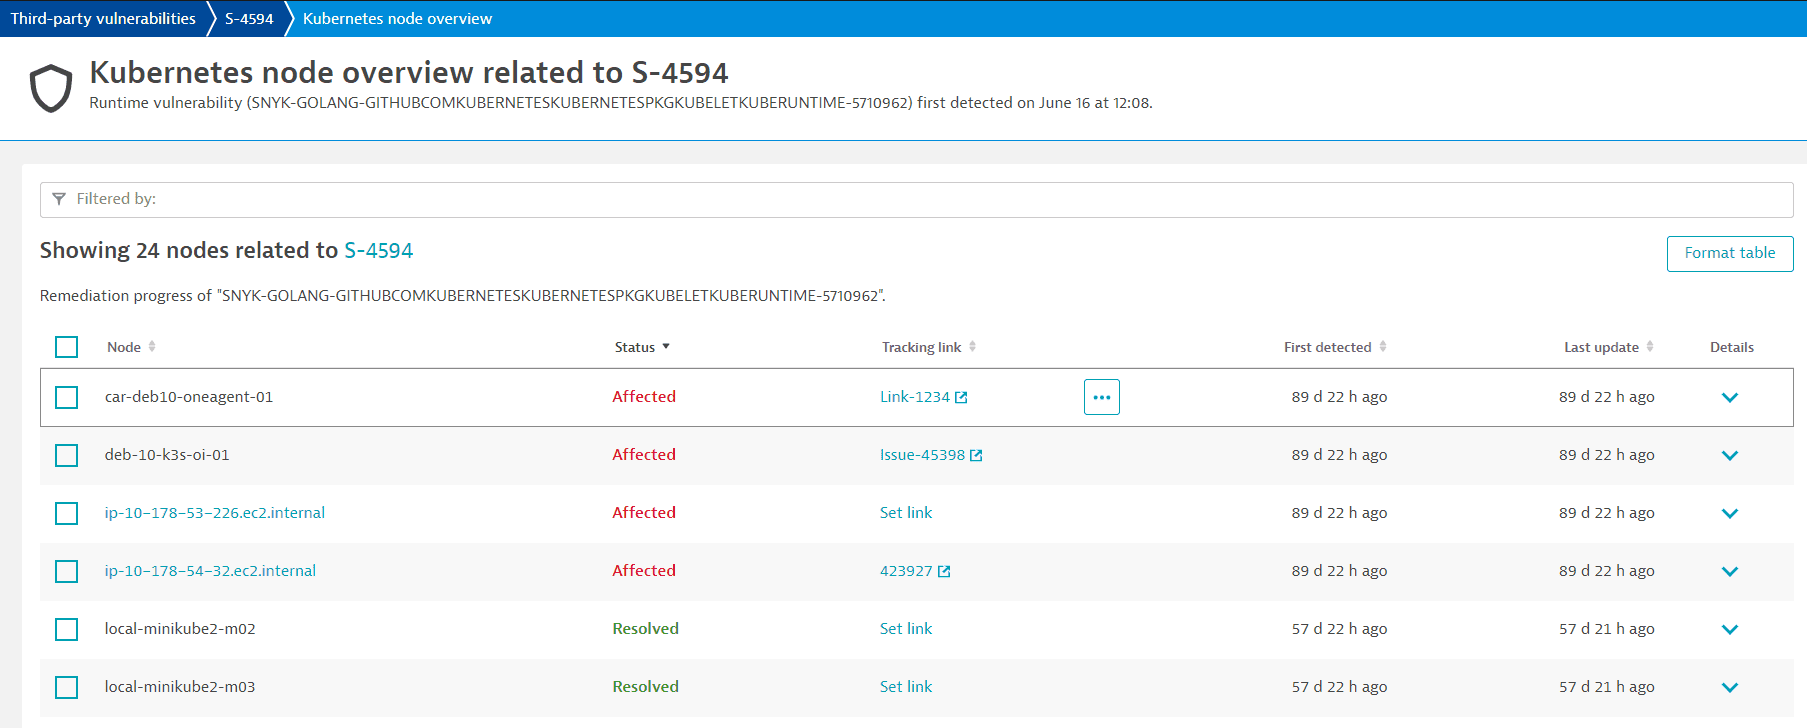
On the Kubernetes node overview page you can
Filter for nodes
You can filter for nodes by
- Entity name: Full or partial name.
- Status:
Affected,Resolved, orMuted. - Tracking link: Full or partial title of a tracking link that has already been set up. For details, see tracking link.
Track remediation progress for nodes
The Kubernetes node list provides the following information.
Node
The name of the affected node with a link to the host details page.
Status
The current status of the affected node (Affected, Resolved, or Muted).
Tracking link
To keep track of a vulnerability's remediation progress you can add links to tickets created in your own issue tracking system for the affected entity. Once you add a tracking link, select it to navigate to the associated URL, which opens in a new page. You can easily check, for example, if someone is already working on fixing the vulnerability.
You can add, update, and delete a tracking link individually (for one node at a time) or in bulk (for several nodes at the same time).
First detected
A timestamp showing when the affected node was first detected.
Last update
A timestamp showing when the status of the affected node was last updated.
Details
Detailed information about the selected node.
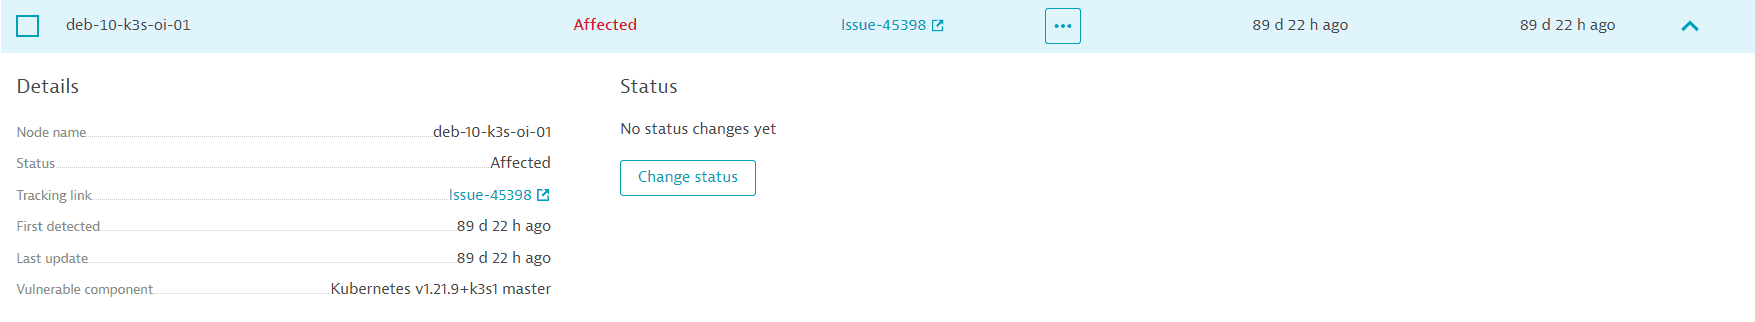
The Kubernetes node details section provides the following information:
- Details:
- Node name: The name of the Kubernetes node (for example,
deb-10-k3s-oi-01). - Status: The current status of the affected node (
Affected,Resolved, orMuted). - Tracking link: Existing tracking links appear here. If no tracking link has been added, you can select Set link to add one.
- First detected: A timestamp showing when the affected node was first detected.
- Last update: A timestamp showing when the status of the affected node was last updated.
- Vulnerable component: The name of the vulnerable component (for example,
Kubernetes v1.21.9+k3s1 master).
- Node name: The name of the Kubernetes node (for example,
- Status:
- If the status hasn't changed, No status changes yet is displayed.
If the status has changed, Dynatrace displays when the change occurred and who performed the change (if applicable).
Change vulnerability status of nodes
To change the vulnerability status of
-
One affected node:
- Go to Details of the Kubernetes node you want, and then select Change status.
- Select the new status and enter any additional information, and then select Save.
-
Multiple affected nodes:
- Select the nodes you want from those displayed on the page and then select Yes, change status.
- Select the new status, enter any additional information, and then select Save.