Distributed tracing by PurePath® technology
A core feature of Dynatrace, PurePath® distributed traces combine distributed tracing with code-level visibility, topology information, and metadata to provide the highest level of data granularity and fidelity.
OneAgent automatically captures distributed traces across the entire transaction, spanning multiple devices, operating systems, page actions, and code methods. The rich and contextualized information provided by PurePath® technology fuels unique features like:
On top of that, the collected data enables you to explore various aspects of your systems by slicing and dicing in a multidimensional analysis view.
PurePath traces are a vital ingredient to automatic baselining by Dynatrace® Davis with a unique root cause analysis that provides you with actionable insights.
Through PurePath technology, Dynatrace enables you to efficiently find the proverbial needle in the haystack and focus on those few requests (out of tens of thousands) that you’re interested in. You can view requests from multiple vantage points—from the perspective of the services you’re responsible for or from the point of view of where a request originates in your system.
Dynatrace also supports OpenTelemetry tracing side-by-side with PurePath, to allow both technologies to complement each other. This enables you to enhance your observability coverage, using the best of both.
Distributed tracing with Dynatrace
Dynatrace has been pioneering distributed tracing since 2006 with the patented PurePath® technology. PurePath® technology combines distributed tracing information with additional insights like user experience information, logs, metrics, topology information, metadata, and even code-level profiling information to provide the highest level of data fidelity and granularity. In its latest increment, PurePath® technology was opened to integrate OpenTelemetry tracing signals to traces that are fully automatically captured via OneAgent.
How does PurePath® technology work?
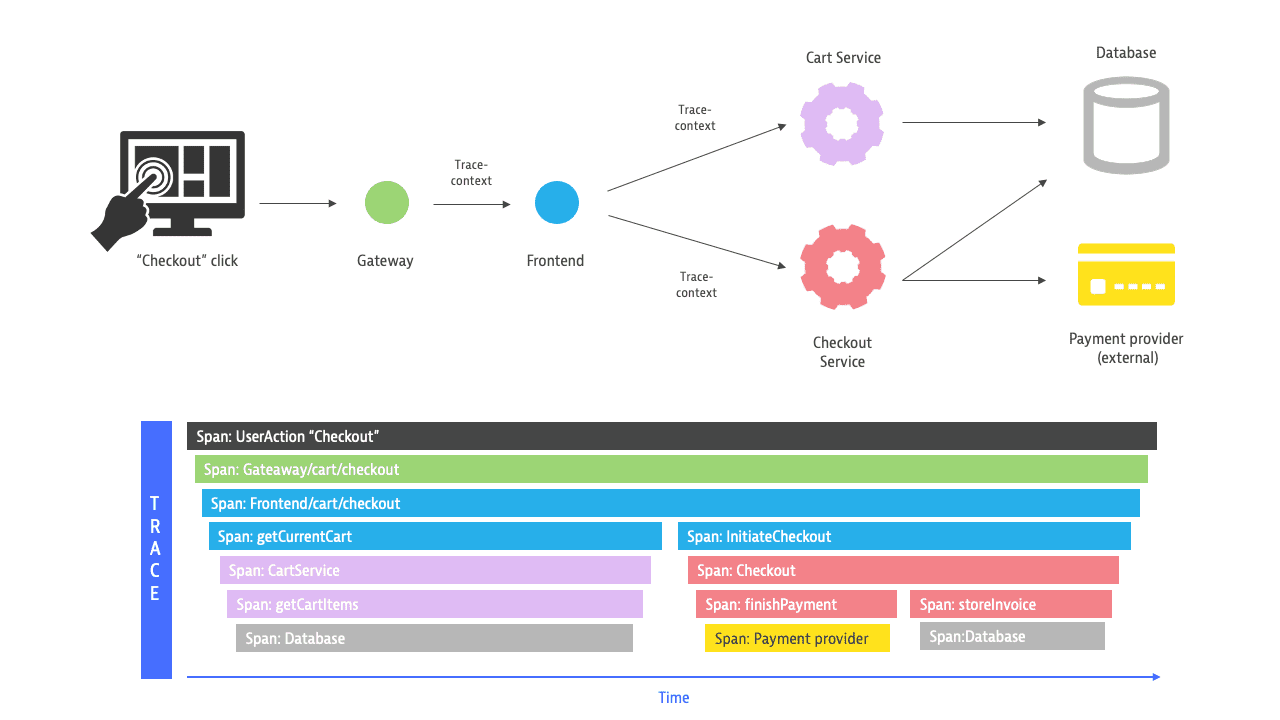
Each activity—called a segment or span—triggered by a request is recorded as it moves both through and across services. The information that is collected includes a name, start and end timestamps, and other attributes. When an activity—a parent span—is completed, the next activity passes to its child span. The distributed trace places these spans in their correct order.
Applications need to be instrumented to produce trace data and propagate a unique identifier for a specific request. This can be done automatically without the need for any code changes (for example, via the OneAgent or existing OpenTelemetry instrumentation libraries) or manually (for example, via OpenTelemetry) by using an instrumentation SDK.
Each trace contains semantically different elements that comprise a single trace and makes it possible to interpret and understand the collected data.
Frequently asked questions
Distributed tracing is a method of observing requests as they propagate across distributed systems and microservices, generating high-quality data about those requests, and making them available for analysis. This is done by tagging an interaction with a unique identifier and collecting data on every interaction with every service the request touches. Distributed tracing is essential for monitoring, debugging, and optimizing distributed software architecture, especially in dynamic microservices architectures as it helps teams understand more quickly how each microservice is performing.
The available service information on the spans is used to put a trace into the correct topological context. This makes it possible to understand topological relations such as the data centers, hosts, Kubernetes namespaces, pods, or processes related to a specific span. This information is an important input for Dynatrace Davis.
Referring to the infographic above, this information allows Davis® AI to understand that CartService and the Checkout service are calling the same database.
-
A span represents a single operation and is the main building block of a trace. Spans contain an operation name, start and end timestamp, a list of attributes as key/value pairs, and the parent's span identifier. Spans are typed with a span kind that describes useful information such as if a span represents a server-side operation, a remote call to an external system, or an interaction with a messaging system. A span without a parent span is called a root span and indicates the start of a trace.
-
The span context is needed to put all spans and events in context with each other. The span context allows a child span to relate to the trace and its parent span. Therefore, the context needs to be propagated within a service (across different threads) but also across services and process boundaries. This typically happens via HTTP headers (like the W3C trace context) or via unique IDs in messaging systems.
A trace traverses at least one service and, in a modern microservice environment, typically multiple services. On horizontally scaled services, each span is processed on specific Service Instances. Services are determined and named based on available resource attributes like service.name or properties that are collected along with the spans.
Learn more about service calls.
Attributes are key-value pairs that provide details about a span, service (call), or resources such as response codes, HTTP methods, and URLs. Attributes allow you to group, query, find, and analyze your traces and spans.
- OneAgent automatically collects several attributes such as HTTP method, URL, response codes, topology data, and details about the underlying technologies. Additionally, you can add custom request attributes for OneAgent to capture and associate with a span without any local configuration or code changes.
- OpenTelemetry defines standard attributes that should be present on spans. Additionally, user-defined attributes can be added to allow you to understand and analyze your system.
Logs are log data that is automatically put into context and shown in the trace perspective when it is contextualized with the related trace and span information.
OneAgent can automatically contextualize log entries that are produced by prominent log frameworks.
In OpenTelemetry, several existing instrumentation libraries can automatically contextualize log entries. Additionally, it can be used to manually contextualize log entries if there's no automated way available.
To learn more about how to enrich log data with traces, see Connecting log data to traces
With PurePath technology, you can analyze data down to code-level detail without ever losing the full context around your environment during drilldown. This is ensured by:
- A reliable entity model, Smartscape, that offers near real-time environment-topology visualization
- Davis AI, a fully automated and context-aware causation engine that analyzes data providing answers
The highest level of data granularity and fidelity of monitored transactions
OneAgent can continuously capture profiling information both for spans and the whole service. This enables you to understand how the duration of a span is affected by CPU time, network time, or just waiting for other threads, and understand which code was executed in the context of a span. This data is available in the single trace view under Code level and can be analyzed in an aggregated way via the Method hotspot analysis.
To learn more about profiling information, see CPU profiling and Memory profiling.