Send Dynatrace notifications to ServiceNow
For ServiceNow, Dynatrace offers:
- Incident integration
- Configuration Management Database (CMDB) integration via ServiceNow-provided application
- Event integration
To connect your Dynatrace monitoring environment to your ServiceNow instance, configuration is required both on the ServiceNow instance and in the Dynatrace web UI.
Incident integration
Once you configure Dynatrace incident integration, Dynatrace automatically creates an incident within your ServiceNow instance for every auto-discovered problem.
How it works
Dynatrace Incident Integration pushes incidents from your Dynatrace environment to your ServiceNow instance.
Configuration in ServiceNow
-
Go to Dynatrace Incident Integration page in the ServiceNow Store and select Get to install Dynatrace Incident Integration in your ServiceNow instance.
-
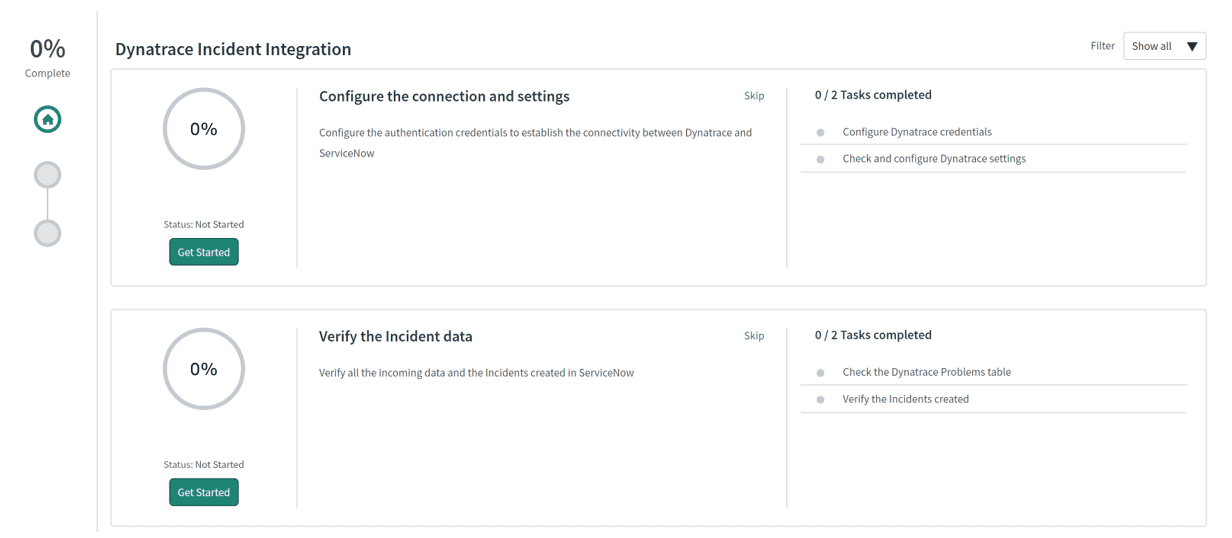
Follow the Guided Setup for an initial configuration of the application.
-
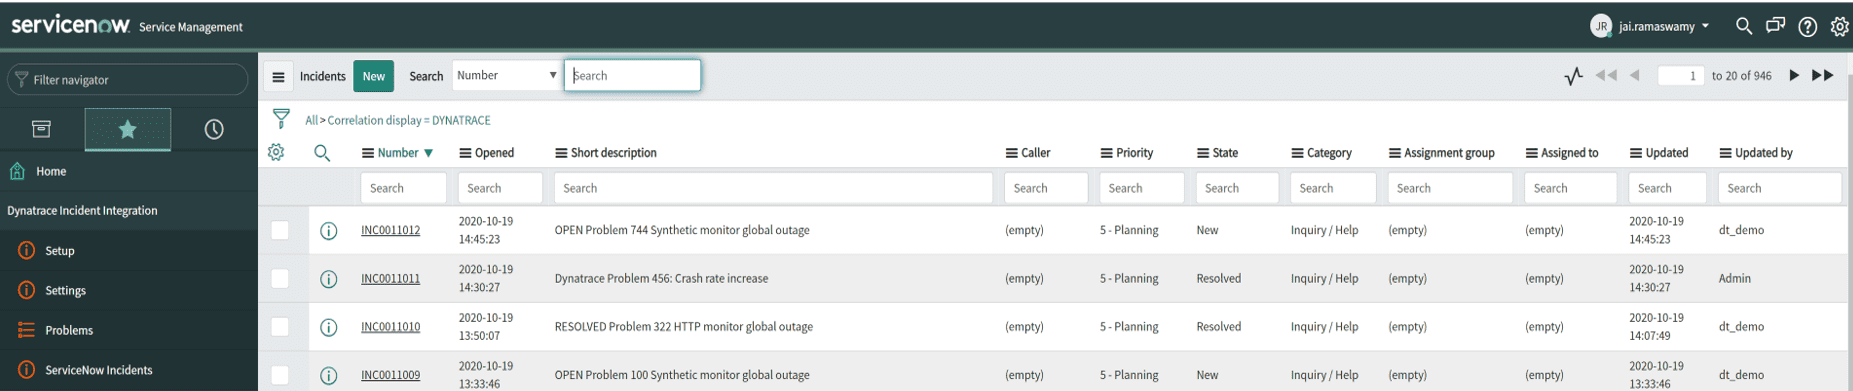
After the application is installed, go to the new Dynatrace Incident Integration menu on your ServiceNow instance to further configure (Setup, Settings) and explore (Problems, ServiceNow Incidents) the application.
-
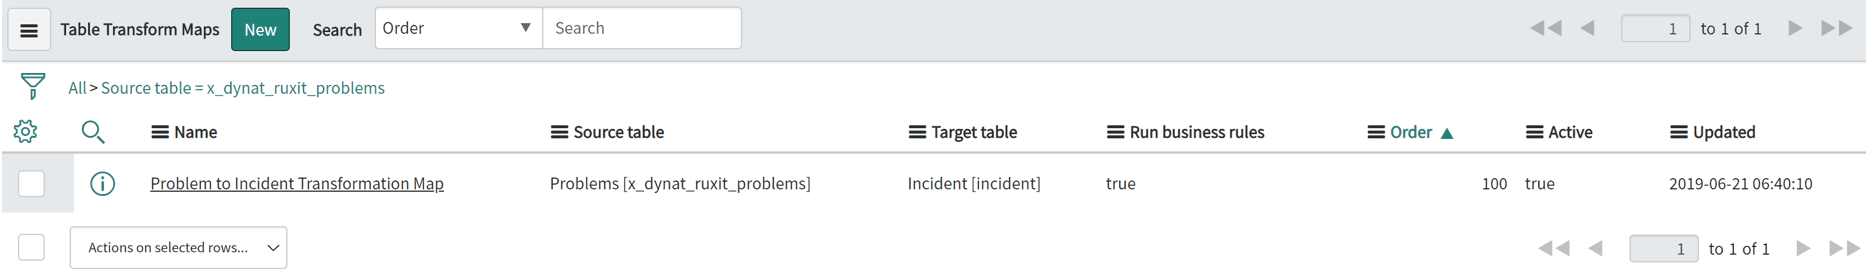
Use the Transform Map module to transform the incoming Dynatrace data in the Problems import set table into an Incident table. The Problems import set table automatically transforms any incoming Dynatrace detected problem into an incident within the ServiceNow incident table.
Configuration in Dynatrace
After installing and configuring Dynatrace integration on the ServiceNow side, switch over to your Dynatrace environment.
-
Go to Settings > Integration > Problem notifications.
-
Select Add notification.
-
Select ServiceNow from the available notification types.
-
Enter the requested information as described on the Problem notifications page.
The Available placeholders section of the configuration page lists placeholders you can use in the Description field to customize the text message associated with the problem notification. Placeholders are automatically replaced with problem-related information.
-
Turn on Send incidents into ServiceNow ITSM.
-
Select Send test notification to make sure your ServiceNow integration is working.
-
Save changes.
Workflow
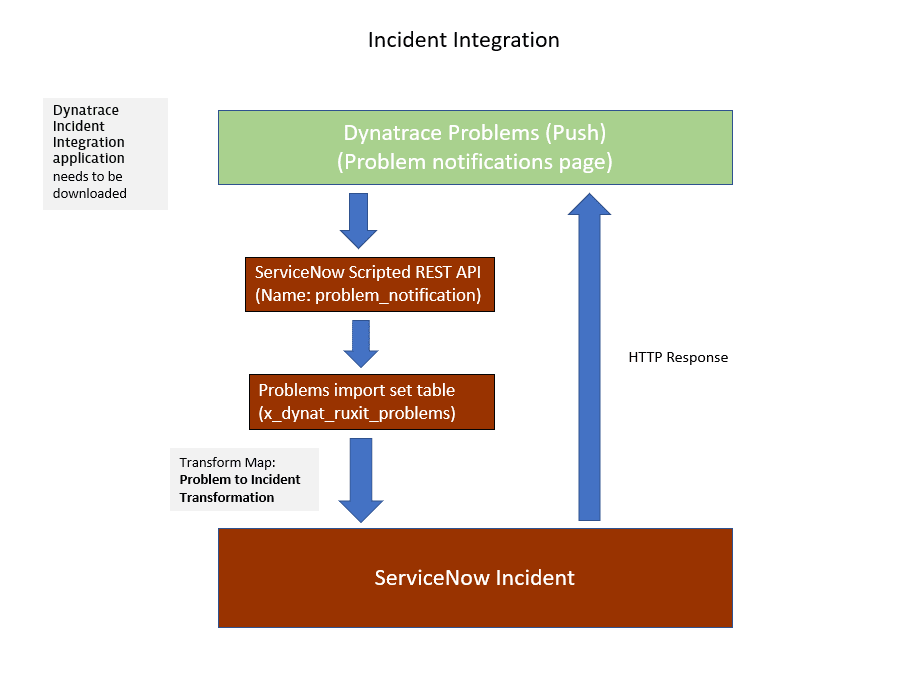
After configuring the application on both sides, problem notifications are pushed from Dynatrace to your ServiceNow instance.
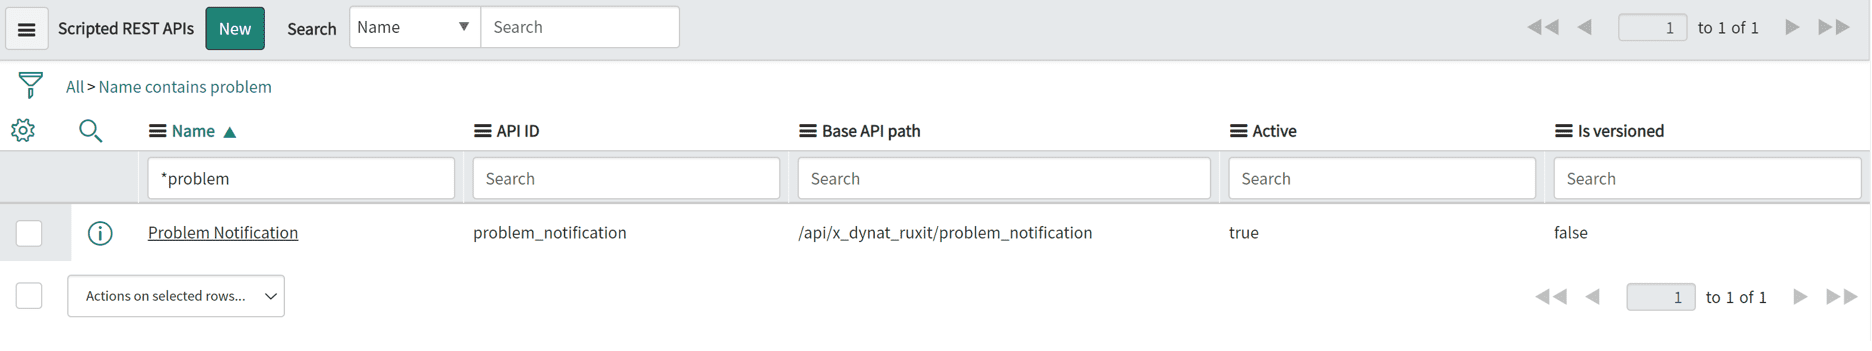
The Scripted REST APIs module is the entry point of the Dynatrace information into ServiceNow. It pushes the data into the Problems import set table.
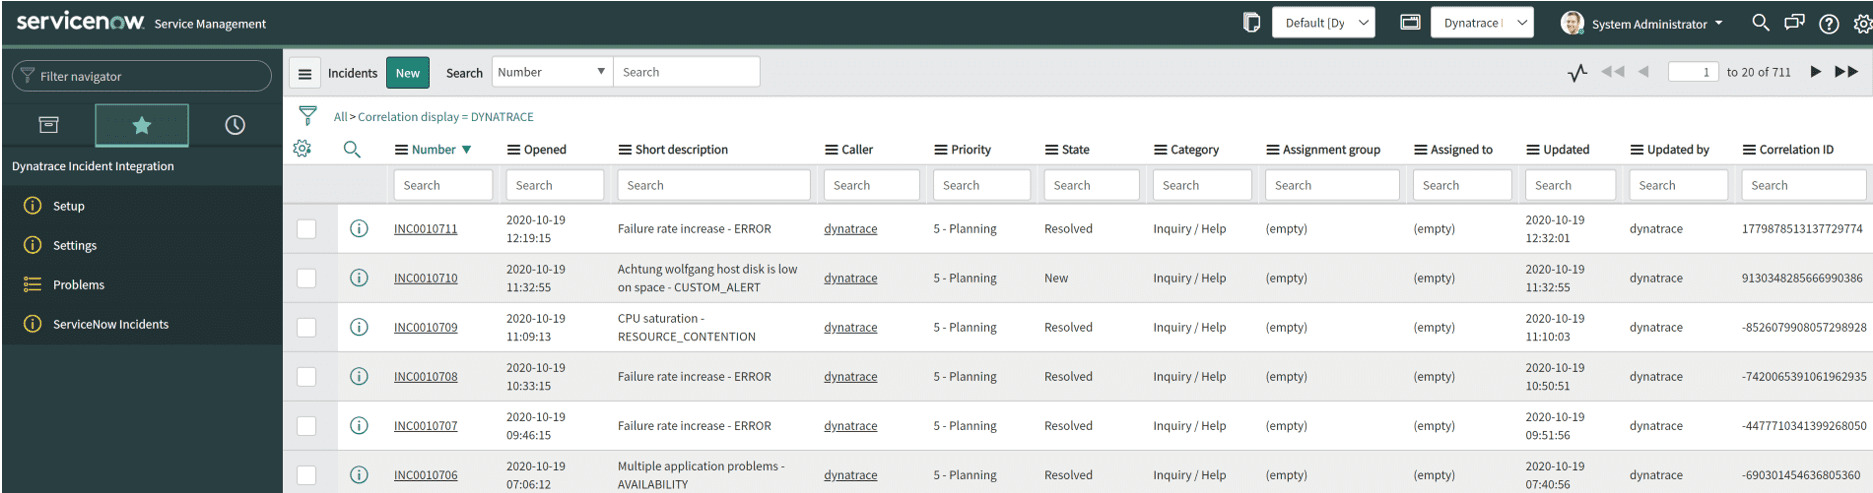
The Problems import set table automatically transforms any incoming Dynatrace-detected problem into an incident within the ServiceNow incident table.
When a problem is closed in Dynatrace, the incident is marked as Resolved in ServiceNow.
Incident integration flow
CMDB integration
ServiceNow offers a dedicated Service Graph Connector for Observability application for pulling Dynatrace observability information into your CMDB. The purpose of this direct integration is to sync Dynatrace-monitored applications, services, and hosts with your service graph and your existing CMDB.
This Service Graph Connector application is developed and supported directly by ServiceNow. Please refer to ServiceNow support and help pages for the latest changes.
The functionality described below replaces the deprecated Dynatrace Service Graph Connector app, which has not been supported since January 1, 2022.
How it works
The ServiceNow connector uses the Dynatrace Monitored entities API v2 to pull information about applications, services, and hosts directly from your Dynatrace environment.
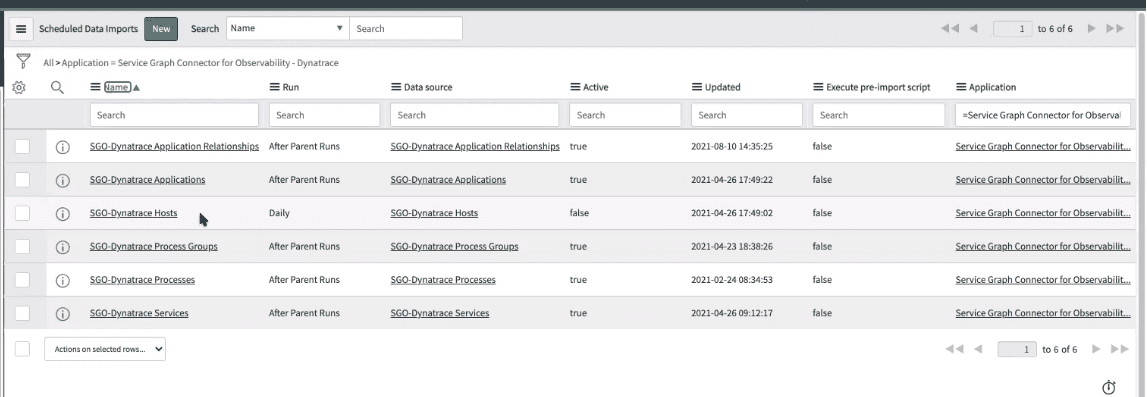
The connector runs a list of Integration Hub data stream actions utilizing data sources (SGO-Dynatrace) within your ServiceNow instance to pull all necessary information on a regular schedule.
The scheduled jobs are added by the connector app.
Dynatrace configuration
To secure communication between Dynatrace and ServiceNow, you need an API token. If you don't already have one, create an API token.
- Go to Access Tokens.
- Select Generate new token.
Enter a name for your token.
- Find and select the Read entities scope.
- Select Generate token.
- Select Copy to copy the generated token to the clipboard. Store the token in a password manager for future use.
ServiceNow configuration
-
In the ServiceNow marketplace, go to Service Graph Connector for Observability - Dynatrace and select Get to install the Service Graph Connector application within your ServiceNow instance.
As a part of this installation, you need to install the following plugins.
Configuration Management for Scoped Apps (CMDB)
Integration Commons for CMDB (from ServiceNow Store)
Configuration Management (CMDB)
ITOM Discovery License
CMDB CI Class Model (from ServiceNow Store)
Observability Commons
IntegrationHub Data Stream Action
The above dependencies are mandatory for this integration to work. For information regarding Subscription Unit consumption, see ServiceNow Subscription Unit Overview.
-
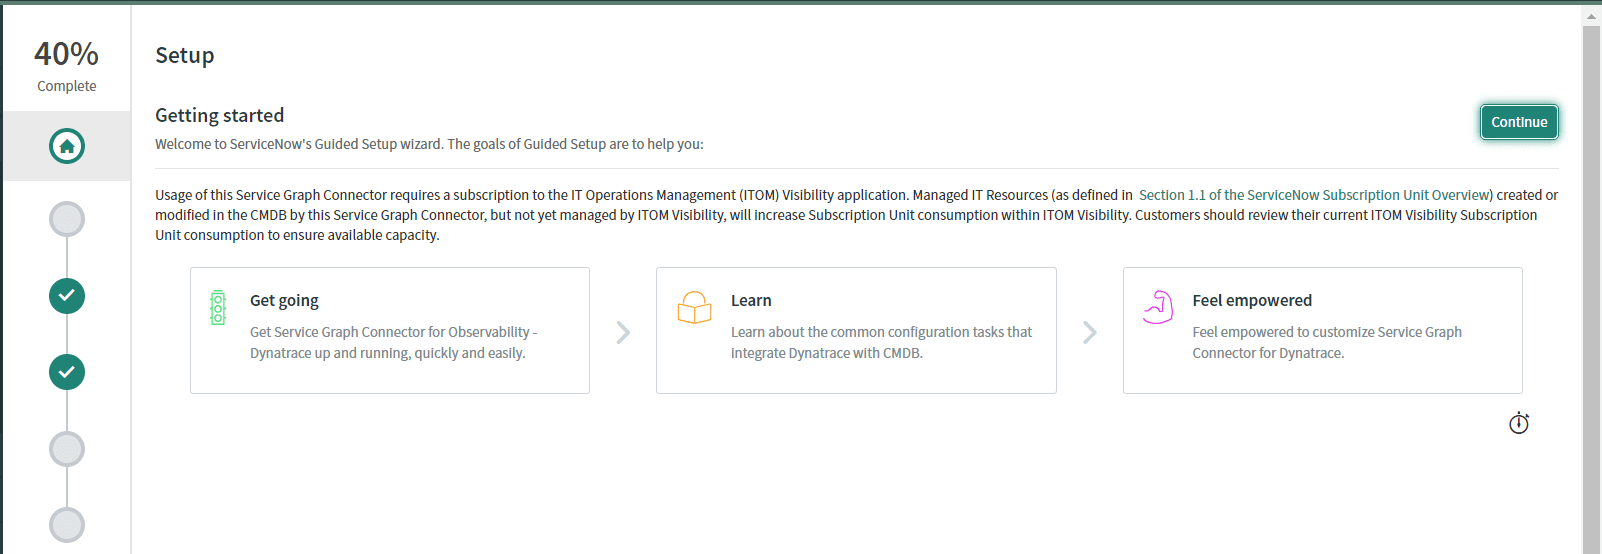
Follow the Guided Setup to configure the application and the connection to your Dynatrace monitoring environment.
For existing users of the integration, we recommend that you uninstall any previous version of Dynatrace integration. There is no loss of CMDB integration data collected before the uninstall.
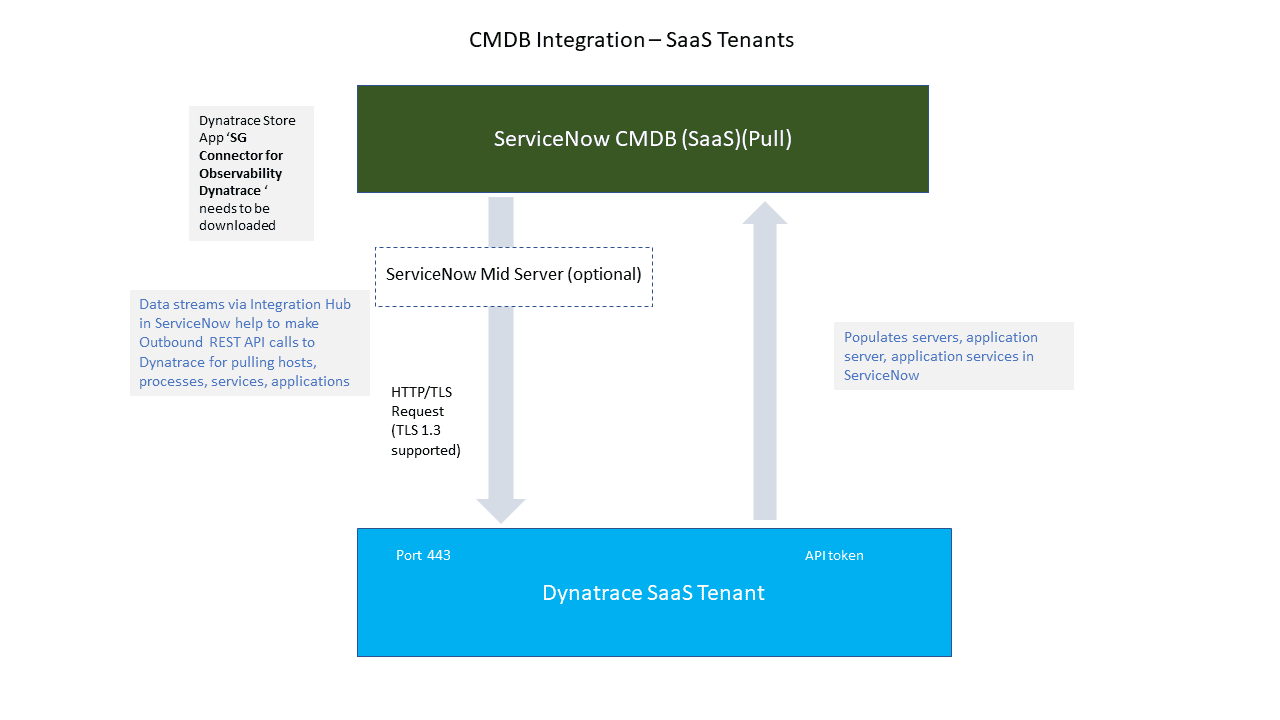
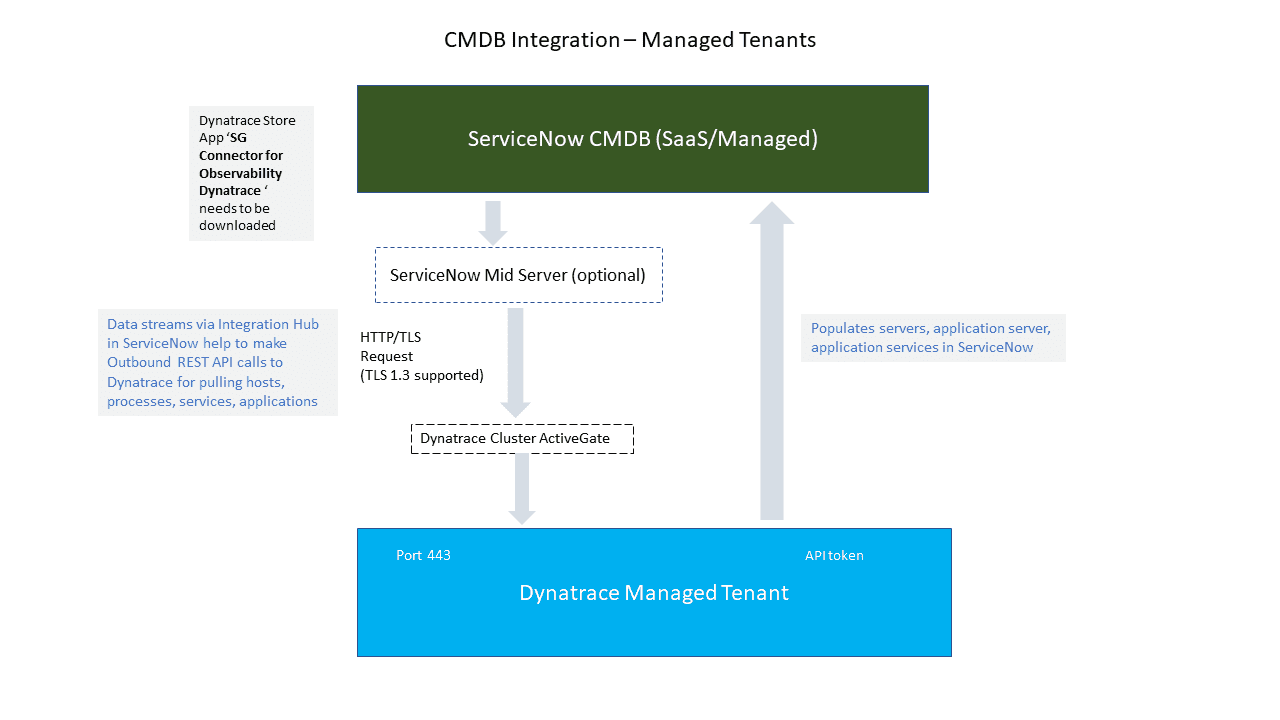
CMDB integration flow
The integration for Dynatrace SaaS and Dynatrace Managed are as follows.
Dynatrace SaaS
Dynatrace Managed
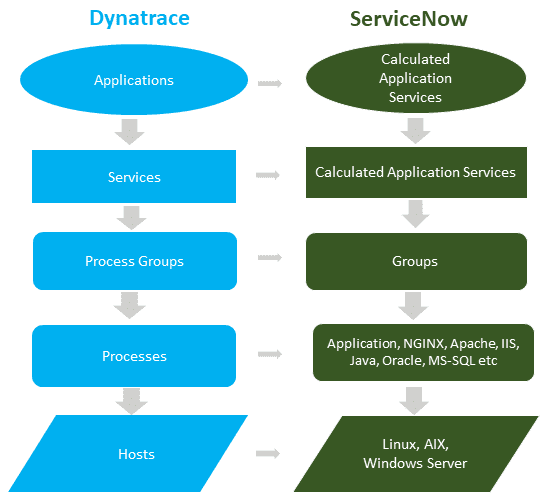
Class mapping hierarchy
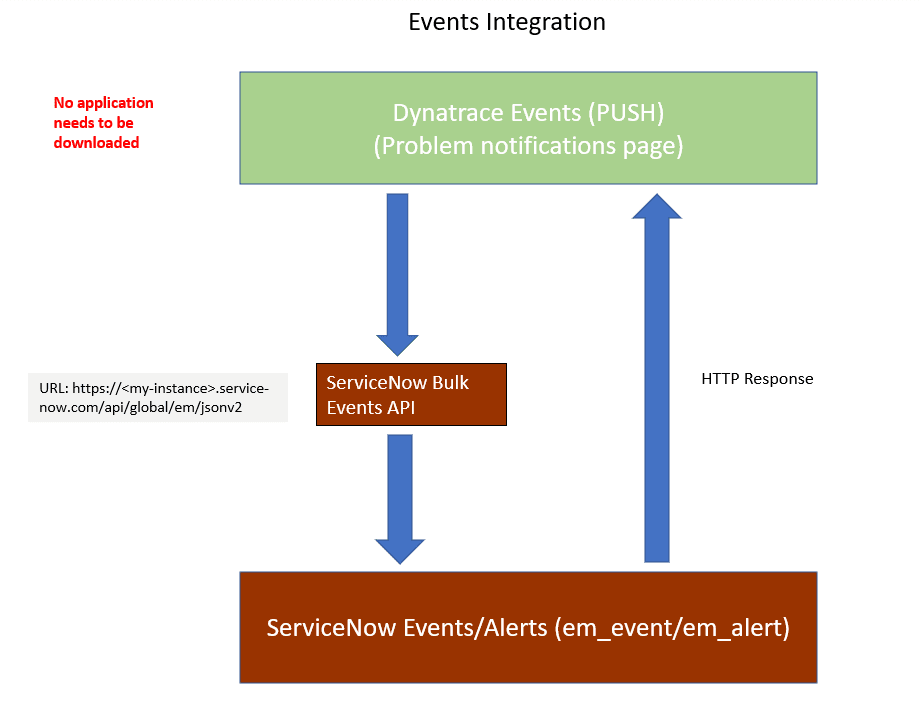
Event integration
If your ServiceNow instance has IT Operations Management (ITOM) enabled, all single events within a Dynatrace-correlated problem can be pushed to your ServiceNow ITOM event table (em_event).
ITOM pushes all the events of a problem detected by Dynatrace to the ServiceNow ITOM event API.
Event integration doesn't require downloading any application and can be enabled in the UI.
ServiceNow configuration
The ServiceNow ITOM module and license need to be active to use this integration option.
Dynatrace configuration
-
Go to Settings.
-
Select Integration > Problem notifications > Add notification.
-
In Notification type, select ServiceNow.
-
Enter the requested information and turn on Send events into ServiceNow ITOM.
In the Description field, you can customize the text message associated with problem notifications by combining any of the placeholders from the list below the description field in an order that's relevant to you.
-
Select Send test notification.
-
Save your changes.
After enabling the push of ITOM events, all events for any problem detected by Dynatrace are automatically pushed to the ITOM event API.
View events
Each host-based event has the node name and IP address attached, as well as important severity information.
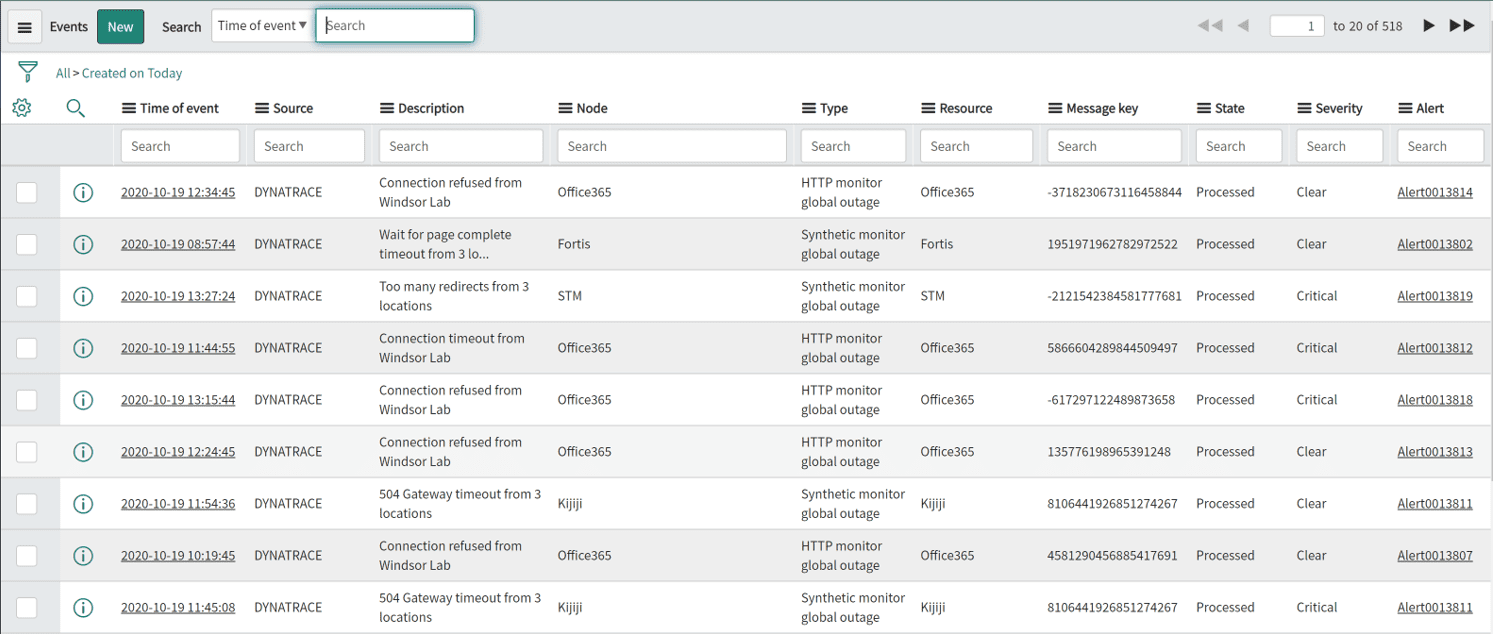
You can create event filters and alerting rules to flexibly react to incoming Dynatrace-detected events.
Each of the events contains the unique Dynatrace identifier (for example, HOST-B66B773D12C49189) in the correlation_id field. If the default ITOM Configuration Item (CI) mapping isn't able to match a CI by its node name, this correlation_id is used to automatically map detected CIs.

Event integration flow
Frequently asked questions
For your Dynatrace instance to communicate with ServiceNow, you need to provide ServiceNow with a list of Dynatrace IP addresses that will be allowed to send information to ServiceNow. Dynatrace servers are distributed throughout various regions. The best way to ensure that you get the right IP addresses for your region is to look up the IP addresses by running the nslookup command. You must first create your environment in Dynatrace and then execute nslookup.
Example:
C:\>nslookup abc.live.dynatrace.com
Optionally, you can review the OneAgent download page to see the IP addresses for your region.
- Dynatrace sends all detected problems into the ServiceNow incident table (
incident). - All single events that are correlated with a Dynatrace-detected problem are sent to the ITOM event table (
em_event). - The relationship between a CI and a Dynatrace-detected problem is sent into the CIs Affected table (
task_ci). - If enabled, Dynatrace synchronizes all auto-discovered web services into the CMDB application services table (
cmdb_ci_services_discovered). - All hosts and process groups running on those hosts are synchronized into the CMDB server table and derived Linux and Windows server tables (
cmdb_ci_server), and into the process groups related tables in ServiceNow (cmdb_ci_appl).
Dynatrace introduces one scheduled job that pulls a subset of the topology information from Dynatrace Smartscape at 10-minute intervals. The SG-Dynatrace scheduled job pulls all web application information along with their relation to software services, all host and process group information, and all software services and relationships. The information pull is performed using the official Dynatrace REST API.
Incidents are imported through an import set table (x_dynat_ruxit_problems). You can reconfigure the default transformation map Problem to Incident Transformation Map to route the information to different tables or fields.
The Dynatrace ServiceNow application is built entirely on the public Dynatrace API and uses a subset of this information by default. We recommend using the ServiceNow Dynatrace application as a starting point and customizing information retrieval based on your requirements. You can also fetch detailed near real-time metrics for each of your Dynatrace monitored configuration items using the Dynatrace API.
Deduplication is done through ServiceNow CMDB Identification and Reconciliation. Custom CI identification rules are used to merge identical CIs based on a given attribute (for example, host names).
Multiple Dynatrace environments can be configured within the Dynatrace environments table in ServiceNow.
Troubleshoot
Check out the following articles in the Troubleshooting forum in the Dynatrace Community.
- Dynatrace-detected hosts, process groups, applications and services don't show up in the CMDB
- Dynatrace-monitored servers don't show up in the CMDB
- Events don't show up in the ITOM events table
- HTTP 403 Forbidden Access Restricted Not Authorized Error when sending a test notification
- Incidents aren't created correctly
- Incoming incidents aren't mapped to the affected server in the CMDB
- Problem link is broken in the ServiceNow incident