Log custom attributes (Logs Classic)
Log Monitoring Classic
Dynatrace automatically detects attributes of ingested log data. Available attributes quickly filter the result table data for a specific log data attribute.
You can also define your own custom log data attributes that suits your particular log data format. Similarly to the automatically detected log attributes, your custom log attributes are extracted from the log data during ingestion and become available within Dynatrace.
You can use them as filters in the log viewer (table options and log record detail attributes), as dimensions while creating log metrics, and as properties while creating log events.
These custom attributes must match log attributes in ingested log data or they will be ignored.
Dynatrace version 1.226+
Dynatrace automatically recognizes log attributes that are visible in log details and table options.
Create a custom log attribute
- Go to Settings > Log Monitoring > Custom attributes.
- Select Add custom attribute.
- Select Log Monitoring > Custom attributes and then select Add custom attribute.
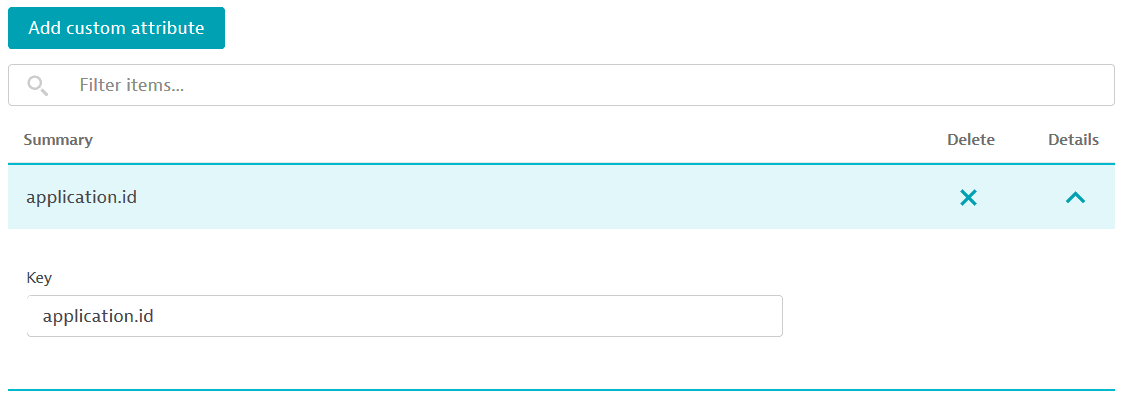
- Enter the Key.
Rules for keys:Keys are not case sensitive.
A key can contain only alphanumeric characters, underscores ('_'), hyphens ('-'), dots ('.') and colons (':').
It can't begin with a hyphen.
All characters must be from the Latin alphabet, with no diacritics; characters such as 'ö' are not allowed.
You can check if the custom attributes you plan to add are part of the key-values attributes list for automatic detection. If they are present there, there is no need to add them to the custom list.
Dynatrace Log Monitoring gives you the ability to define custom index log data attributes for log data that is ingested.
Example
In this example, you will make an API log ingest call with JSON that contains the following log attributes:
{"timestamp": "2021-07-29T10:54:40.962165022Z","level": "error","source": "Skynet","application.id": "PaymentService-Prod","message": "PaymentService-Prod failure.","data": {}}
Then you will create a custom log attribute and use it for creating a log metric and a log event.
-
Make an API call.
-
Create a custom attribute.
-
View the attribute in log viewer. (See Log viewer (Logs Classic) for details.)
-
Check Available attributes
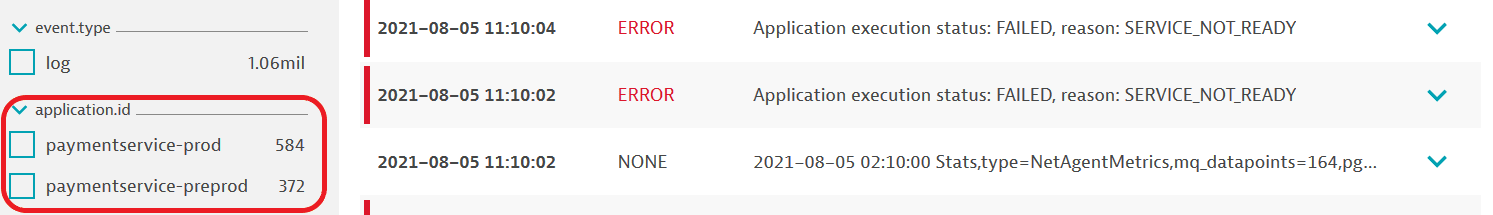
-
Check table options
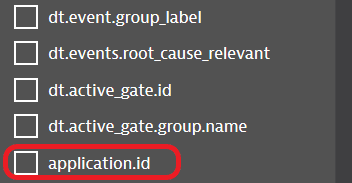
-
Check log entry/record details
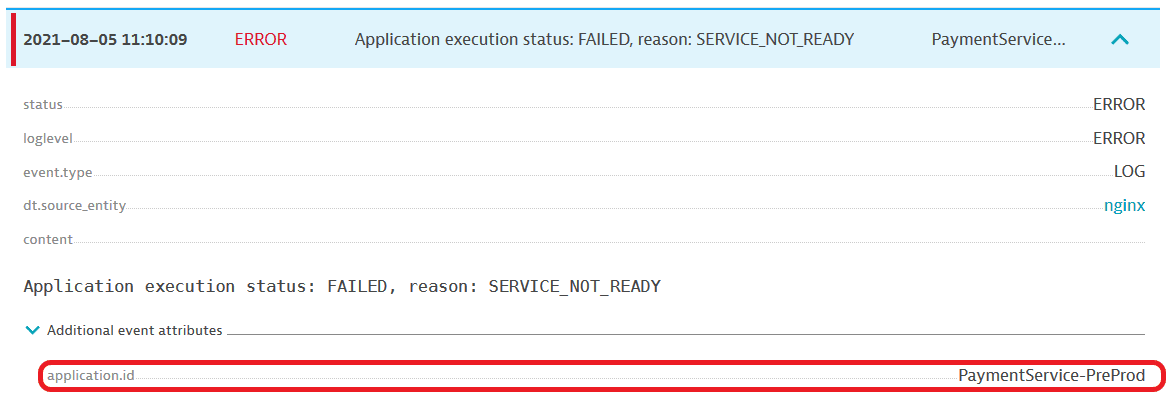
-