Log viewer v1
You are viewing documentation for Log Monitoring v1. Dynatrace Log Monitoring v1, is considered a legacy solution.
Log Monitoring v1 will reach the end of life and will be switched off in November 2023.
SaaS environments will be automatically upgraded to LMA or LMC.
We strongly encourage you to switch to the latest Dynatrace Log Monitoring version.
If you are currently using Dynatrace SaaS, upgrade to the latest version of Dynatrace log monitoring.
Log viewer
The Dynatrace log viewer is included in your host unit price free of charge. Dynatrace accesses and analyzes all logs that are stored on monitored host disks. To access the log viewer, go to Logs or Logs & Events (latest Dynatrace) and then select Analyze log files.
From the log viewer, you can access and examine only the logs that have been set to be monitored (stored).
You can access any auto-discovered log by browsing through host or process screens and drilling down to the log that you are interested in. The log you drill down to will automatically be selected in the log viewer. Keep in mind that you can only view the log data for the past seven days and only one file at a time.
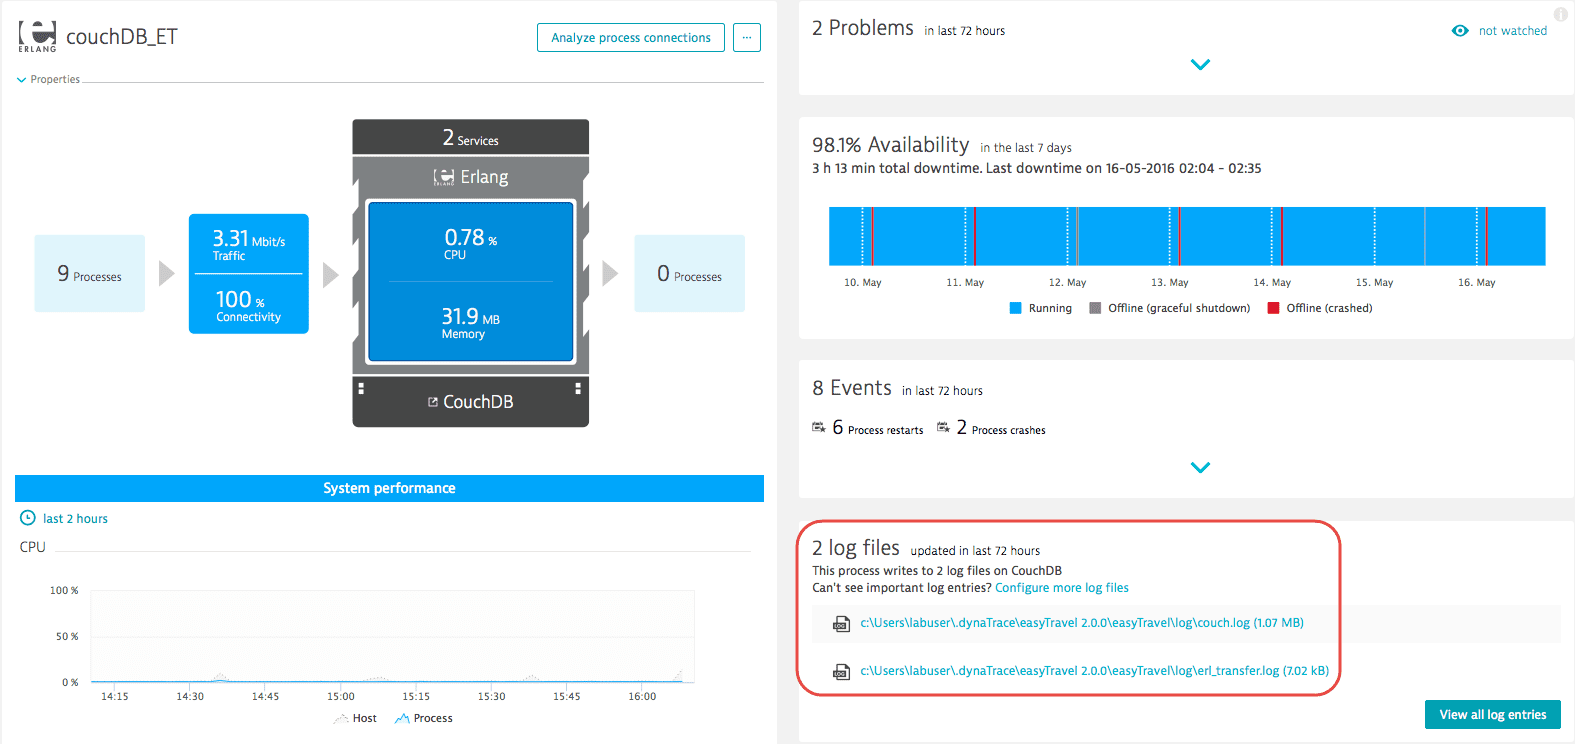
To view the logs for a selected process, use the log files list on individual Process pages. In the example below, the 'couchDB_ET' Process page displays two related log files. Clicking one of these opens the log viewer with that log pre-selected.
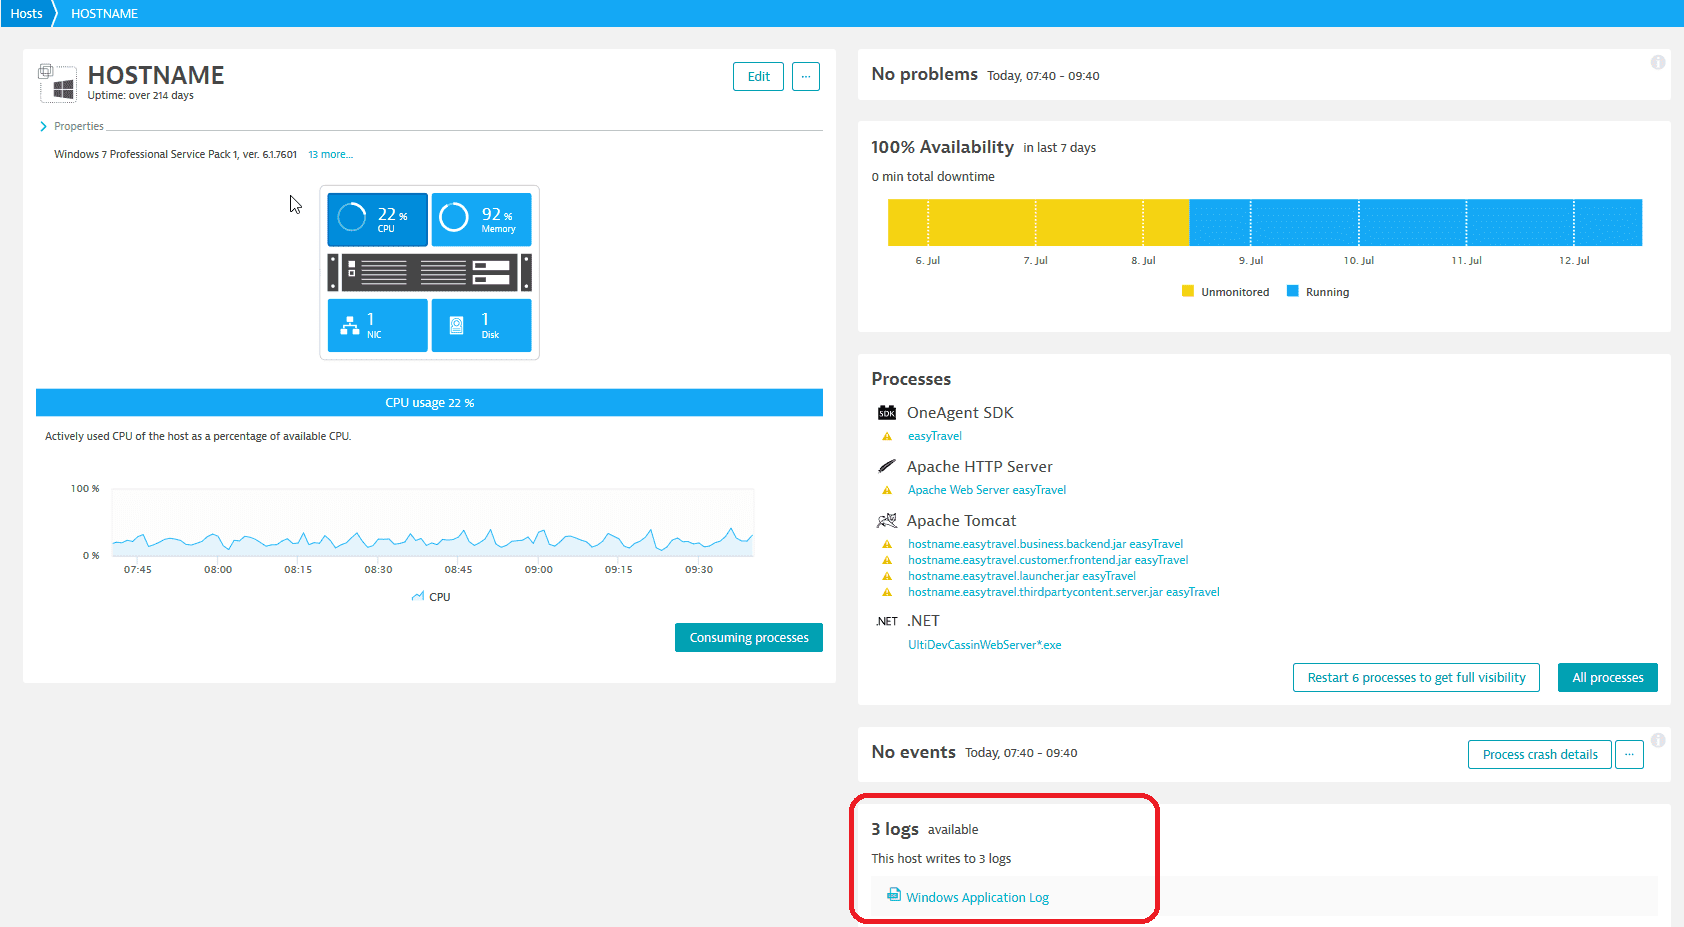
To view the logs for a selected host, use the log files list on individual host pages. Clicking one of these opens the log viewer with that log pre-selected.
Search patterns in log data and parse results
Log files typically contain a lot of text. One way to handle a large amount of text is to group similar log entries together and parse them. The Log Viewer enables you to present raw log data in a sortable, filterable table that is easy to work with.
Use the Log Viewer to browse through the contents of individual process log files or search selected log files using keywords. Only hosts or process groups active during the selected time frame are shown. Log results can be returned in either raw or aggregated form. You can parse the result table and narrow down the text pattern search result, show and hide specific columns, and define your own custom columns.
Bookmarks
Use a bookmark to save and reuse your search queries and filters. Any changes you make during your log analysis (log parsing and column filtering) will be saved in the bookmark. Using bookmarks, you can return to the same settings later. Remember that, the timeframe applied to bookmarked search queries and filters is the same time frame currently set on the page.
Share links
Sharing log analysis differs from bookmarks. The share link includes the selected time frame, so the person who receives the link sees exactly what you want to share in the time frame that you selected. The shared link is active only for the duration of the log retention period for that environment. Once the log retention period passes, the shared link does not work because no log data is available.
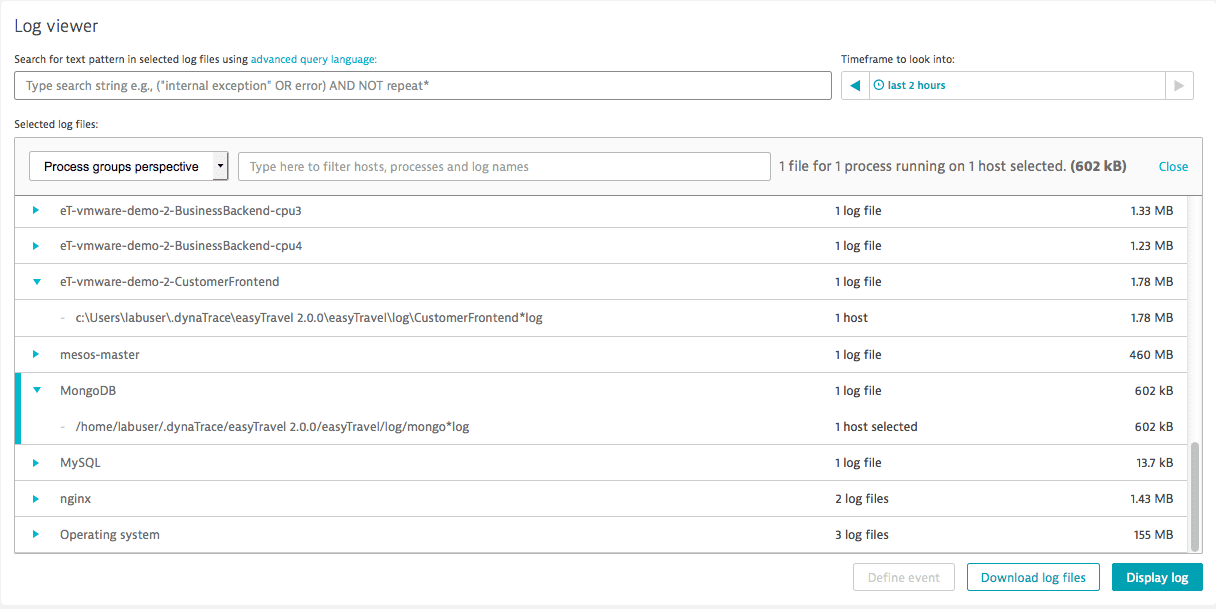
Search for text patterns in log files
To search log files for a text pattern, select the logs based on the host or process groups perspective, then search for a text pattern using the Dynatrace search query language (or leave the query box empty to return all results).
Using combinations of keywords, phrases, logical operators, and parentheses, the Dynatrace search query language provides you with complete flexibility over searches through important process-log content.
To return all results, leave the query box blank.
You can select or highlight sections or elements of the displayed log content to create or modify the text pattern search query. Select Run query to display the selected logs again.
| Category | Description | Example |
|---|---|---|
Single–word terms | Single-word searches help you find individual word occurrences. Searches are case-insensitive. |
|
Phrases | Phrases are groups of words surrounded by double quotes. Phrases are treated just like single-word terms in queries. When a search phrase consists only of alphanumeric characters |
|
Boolean operators | Operators can be written in either uppercase or lowercase: |
|
Grouping | Parentheses |
|
Wildcards | Wildcards can be used to represent a variable or unknown alphanumeric characters in search terms. An asterisk Single-character wildcard queries |
|
Special characters | Special characters must be escaped with a |
|
Sample queries
Error AND Module1?2
"Connection refused" OR Timeout
Procedure AND (started OR stopped)
Exception AND NOT repeat*
Advanced options
Select Advanced options to create columns based on values extracted from log data. The new columns are applied to the result of searching the log files for a text pattern. The extracted value will be the first matched per log entry.
Extract fields
To create a column, define a section of log data that should be extracted as a column. Provide a string directly preceding (val_pref) and directly following (val_suff) the value that you want to use in the column. If a match is found, everything between val_pref and val_suff will be extracted as a value in the column defined in the column declaration.
- If you use any of the following special characters in a prefix or suffix, you need to escape them with a backslash (
\):
"- double quote
%- percent
,- comma
\- backslash An extracted value type has to be one of the supported column types: INTEGER, NUMBER, STRING or BOOLEAN.
- Matching for prefixes (
val_pref) and suffixes (val_suff) is case-sensitive. - If the value between
val_prefandval_suffdoesn't match the type defined in the column type, no value will be returned for the defined column. Only the first occurrence of a prefix counts. If there is no matching suffix, no value will be matched, even if a matching prefix-suffix combination occurs later in the log entry.
An empty suffix means matches from the prefix to the end of the log entry.
Whitespace isn't trimmed. The prefix and suffix have to match exactly. Additional spaces cause no match.
Column declaration is where you indicate the column type (col_type) and a column name (col_name) separated by a : (colon character).
Use the following syntax to define a column: "val_pref%{col_type:col_name}val_suff"
Because column declaration is literal, make sure you enclose it in quotation marks.
The column type determines how the value is matched against log data and greatly affects what is extracted as a value. The following are valid column types that you can use in column declaration:
INTEGER
Potentially extracted value:
- May contain characters
0-9, and optionally at the beginning,+or-. - Can't contain spaces or underscores
_. Maximum token length is 20 characters.
Empty token is improper (doesn't imply column).
Represented value is in range of long Java type.
Custom columns can be applied only to centrally stored logs.
You can add, hide, or remove a custom column in your log display. Each column name must be unique. Don't use the name of any automatically detected column or repeat a custom column name you already used.
Example data that matches the INTEGER column type and will be extracted as a value in a defined column for the log entry in which it was matched:
"1234""+1234""-1234"
The following log data won't be listed as a value in a defined column if you use INTEGER column type:
"""123L""1_234""1 234""0x123""1234567890123456789012"
NUMBER
Potentially extracted value:
- May contain characters
+,-,.,e,E, and any digit between0 - 9. - Must represent a decimal number in normal or scientific notation
123E456.
Example data that matches the NUMBER column type and will be extracted as a value in a defined column for the log entry in which it was matched:
"123""123."".123""123.4""123.4e12""123.4E56""+123.4e+12""-123.4e-12"
The following log data won't be listed as a value in a defined column if you use NUMBER column type:
""".""123f""123,4""123e""123 e4""123e4.5""123.4e99""0x12.2P2"
You can define multiple columns at the same time by separating each column declaration with a , (comma).
For example: "prefix1%{INTEGER:myColumn1}suffix1","prefix2%{INTEGER:myColumn2}suffix2"
STRING
All characters found between val_suff and val_suff will be treated and extracted as a string value in a defined column.
BOOLEAN
All characters found between val_suff and val_suff will be treated and matched as a boolean value in the log entry (true or false).
Field extraction examples
The following example illustrates the behavior of the extraction mechanism when specific values are used in a column definition. The output column represents the value for the log entry in the newly defined myColumn column.
| Log entry | Prefix | Suffix | Column type | Column definition | Output |
|---|---|---|---|---|---|
pref123suff |
|
|
|
|
|
pref123suff |
|
|
|
|
|
pref123suff pref456suff |
|
|
|
|
|
some text spanning |
|
|
|
|
|
|
|
|
| - | |
pref123456"" |
|
|
|
|
|
pref123456 |
|
|
|
|
|
pref123suff"" |
|
|
|
| - |
Pref123suff |
|
|
|
| - |
pref 123 suff |
|
|
|
| - |
pref |
|
|
|
| - |
abc123def |
|
|
|
| - |
pref-abc-suff |
|
|
|
|
|
pref:true, |
|
|
|
|
|
If you use any special characters (", %, ,, \) in a prefix or suffix, you need to escape them with a backslash (\).
Column values filter
This filter can be applied only to Run query results. It doesn't apply to Create metric.
You can apply a filter to the results of the text-pattern search, but only to the columns that aren't restricted (_Source, _Timestamp, _Content). Apply the filter to all manually and automatically parsed columns (including columns with extracted values in Advanced options). Both column names and values used in the filter are case-sensitive.
This filter can be applied only to centrally stored logs.
You can apply a filter to the results of the text-pattern search, but only to the columns that are not restricted (_Source, _Timestamp, _Content). Apply the filter to all manual and automatically parsed columns. Both column names and values used in the filter are case sensitive.
Every column contains a value of a specific type: string, number, integer, or Boolean true/false. Depending on the value type, the syntax of your filter can vary. For example, if the column is a number type and you assign a different value type (string, decimal, or true/false) in your filter, you will generate a parsing error.
-
Column names containing special characters (including spaces) must be enclosed in backticks.
For example:`integer Column # 2` = 20 -
Filtered values containing quotation marks must be enclosed in double quotation marks.
For example, the valuepath "test" errorshould be entered in the filter as:expath = "path ""test"" error" -
Column values where the sum of the column name and value length exceeds 8191 characters are shortened with an ellipsis.
An invalid column filter query will not be applied to already saved or shared bookmarks.
| Category | Description | Example |
|---|---|---|
Boolean | Boolean value. Wildcards aren't accepted for Boolean values ( |
|
Number | Number value; can be integer or decimal. Only Number range for available types:
Wildcards aren't accepted for number type. |
|
Phrase | Group of words surrounded by double quotes. Treated in search like a single word. Wildcards accepted inside the parentheses. |
|
Wildcard | Substitutes part of a single word term. Possible special characters:
Wildcards aren't accepted for numbers and Boolean operators. |
|
Operator | AND - surrounding terms must exist OR - one of the surrounding terms must exist NOT - succeeding term or phrase must not exist |
|
Comparison | > (greater than) < (less than) >= (greater than or equal to) <= (less than or equal to) != (not equal to) = (equal to) BETWEEN (range to test) The AND operator must be present in this statement. |
|
Group | Parentheses ( ) group clauses to form subqueries |
|