Organize Dynatrace dashboards
The dashboards discussed here are classic dashboards created using the dashboarding functionality integrated with previous Dynatrace.
- For more about classic dashboards, see Dashboards Classic.
- For more about dashboards created with the Dashboards app in the latest Dynatrace, see Dashboards.
- To improve your dashboard experience, you can upgrade existing dashboards from Dashboards Classic to the Dashboards app in the latest Dynatrace.
When you have a lot of dashboards, you need to manage them.
Filters on the dashboards table
Depending on how many Dynatrace users you have and how many dashboards they create, the Dashboards page (go to Dashboards or Dashboards Classic (latest Dynatrace)) may present you with a long table of dashboards. You need to know how to filter that table.
There are two ways to set filters on the Dashboards table:
- The collapsible pane to the left of the table has filters such as Ownership and Favorite. Any selection you make for one of those filters adds the equivalent filter to the filter bar above the table and applies the filter.
You can add filters directly to the filter bar above the table: in the filter bar, select a filter, and then type or select the filter value. You need to use this method for filter values that require typing.
List my dashboards
To list just your own dashboards
- Go to Dashboards or Dashboards Classic (latest Dynatrace).
- Set a filter using one of these methods:
- Under Ownership in the left column, select
Mine - On the Filter by line, select
Ownership: Mine
- Under Ownership in the left column, select
All dashboard table filters
You can apply the following filters to the Dashboards table:
- Name: Type any part of the dashboard name and press enter
- Ownership: Filters by ownership of the dashboard
Mine: All dashboards that you've createdShared with me: All dashboards created by other users who have granted you read or edit permissions to their dashboards
- Favorite: Lists just the favorited dashboards
- Owner: Filters by the name or user ID of the owner
- Tag: Filters by dashboard tag
- Hidden: Set to
Yesto display your hidden dashboards - Preset: Whether to list only preset dashboards
If you set more than one filter, only dashboards that match all of the filters are shown.
Favorites
Favorited dashboards are sorted to the top of the Dashboards table by default, followed by the rest of the dashboards in the table.
Favorite a dashboard
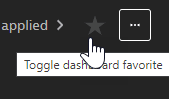
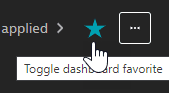
To favorite the dashboard you are viewing, select the star in the upper-right corner of the dashboard. The star toggles favoriting on and off.
To favorite multiple dashboards
- Go to Dashboards or Dashboards Classic (latest Dynatrace).
By default, the table is sorted by the Favorite column, so your favorites should be listed at the top of the table. - In the Favorite column, select the star for each dashboard you want to favorite.
Unfavorite a dashboard
To unfavorite the dashboard you are viewing, select the star in the upper-right corner of the dashboard. The star toggles favoriting on and off.
To unfavorite multiple dashboards
- Go to Dashboards or Dashboards Classic (latest Dynatrace).
By default, the table is sorted by the Favorite column, so your favorites should be listed at the top of the table. - optional To list only your favorites, filter the table by
Favorite: Yes. - In the Favorite column, select the star for each dashboard you want to unfavorite.
List your favorite dashboards
- Go to Dashboards or Dashboards Classic (latest Dynatrace).
By default, the table is sorted by the Favorite column, so your favorites should be listed at the top of the table, followed by the other dashboards you have permission to display. - optional To list only your favorites, set a filter using one of these methods:
- Under Favorite in the left column, select
Yes - On the Filter by line, select
Favorite: Yes
- Under Favorite in the left column, select
Popularity
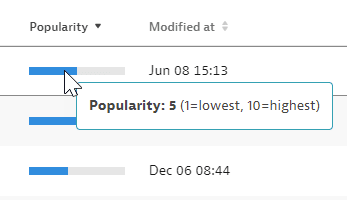
The Popularity column of the Dashboards table shows you which dashboards have been most viewed over the last 30 days. Each dashboard is given a popularity score between 1 (least popular) and 10 (most popular).
- If you're a Dynatrace user, sort by Popularity to find popular dashboards that you might want to use.
- If you manage a Dynatrace deployment, sort by Popularity to identify underused dashboards that could be candidates for cleanup.
Tags
You can use tags to organize your dashboards into groups.
To apply dashboard tags
Display the dashboard.
- Select Edit.
If you don't see an Edit option, you don't have permission to edit that dashboard. - Select Add tag under the name of the dashboard, type and select the tag, and then select Add.
Repeat this step as needed to add additional tags to this dashboard. - Select Done to save your changes.
You can filter the Dashboards list by Tag.
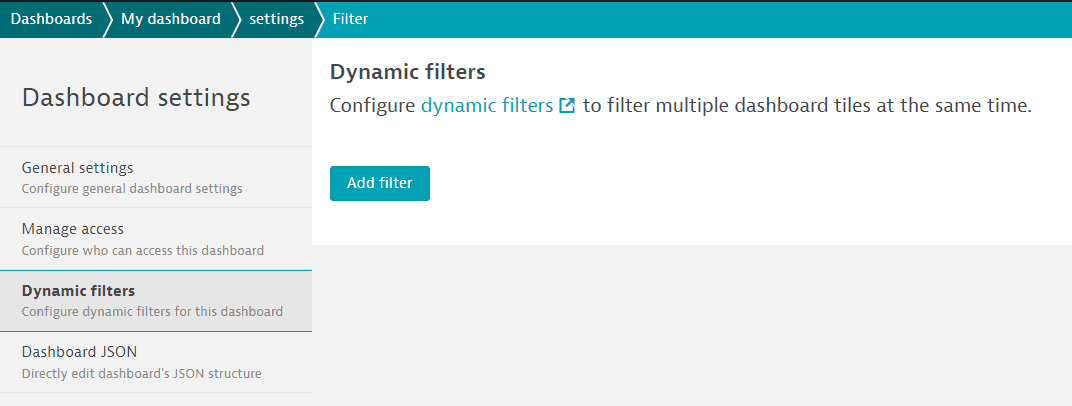
Generic tag filter
-
Go to the Dynamic filters page of your dashboard settings.
-
Select Edit in the upper-right corner of the dashboard.
If you don't see an Edit button, you don't have edit rights for the selected dashboard.
-
Select the Settings tab.
-
Select Configure more.
-
Select Dynamic filters.
-
-
Select Add filter.
-
Set Filter criteria to
Generic tag key. -
Set Display name to a unique display name that identifies this generic filter (for example,
Application name). -
Set Tag key (for example,
appName). -
Set Get suggestions from to define where to get tag suggestions (for example,
Host). -
Under Entity types affected by tag, select Add entity type to add an entity type affected by this tag.
You can do this multiple times.
-
Select Save changes.
-
Display the dashboard.
-
When you set a filter on the dashboard, you can apply the same type of filter more than once under the same generic tag.
Management zones
Management zones are used to partition monitoring data based on team ownership and responsibility. Dashboard content is automatically filtered whenever a management zone is selected.
You can set a default timeframe and management zone for each dashboard; these are selected every time you open the dashboard. They're also used when you share the dashboard.
To configure the default timeframe and management zone, edit the dashboard, switch to the Settings tab, and configure either or both settings:
- Default timeframe: turn it on and select a timeframe for the dashboard.
- Default management zone: turn it on and select a management zone for the dashboard.
Team members who view a zone-specific dashboard without having the required management zone permissions are presented with a dashboard that has no content. They must select a management zone that they have permission to view before data is displayed on the dashboard.
For more on dashboards and management zones, see Dashboard timeframe and management zone.
More dashboard management procedures
- Go to Dashboards or Dashboards Classic (latest Dynatrace).
- Select Create Dashboard.
- Enter a name for your dashboard and select Create. The new dashboard opens in edit mode.
- optional To add a tile, drag it from the Tiles pane to the dashboard, or pin a tile to the dashboard.
- optional To configure dashboard-specific settings, select the Settings tile.
- Select Done.
The new dashboard is displayed as it will appear to you and people with whom you share it, though other people will not see the Edit button if you don't give them edit permission.
For details on creating dashboards, see Create and edit Dynatrace dashboards
- Go to Dashboards or Dashboards Classic (latest Dynatrace).
- In the table of dashboards, select More (…) > Clone for the dashboard you want to copy.
The copy opens in edit mode.
The original dashboard is unaffected.
For details on creating dashboards, see Create and edit Dynatrace dashboards
- Go to Dashboards or Dashboards Classic (latest Dynatrace).
Select the name of a dashboard to display that dashboard.
- Select Edit in the upper-right corner of the dashboard. The dashboard opens in edit mode.
- If you don't see an Edit option, you don't have permission to edit that dashboard.
- Go to Dashboards or Dashboards Classic (latest Dynatrace).
- In the table of dashboards, select More (…) > Hide for the dashboard you want to hide.
- Go to Dashboards or Dashboards Classic (latest Dynatrace).
- Filter the table by
Hidden: Yesto display all of your hidden dashboards. - In the table of dashboards, select More (…) > Unhide for the dashboard you want to unhide.
- Go to Dashboards or Dashboards Classic (latest Dynatrace).
- In the table of dashboards, select More (…) > Delete for the dashboard you want to delete.
- If you don't see a Delete option, you don't have permission to delete that dashboard.
Confirm the deletion to remove the dashboard.