Problem overview
You have two major possibilities for glancing at problems in your environment:
The Problem feed provides a rolling history of open/closed problems.
A problem overview page provides you with a deeper insight into a particular problem.
Problem feed
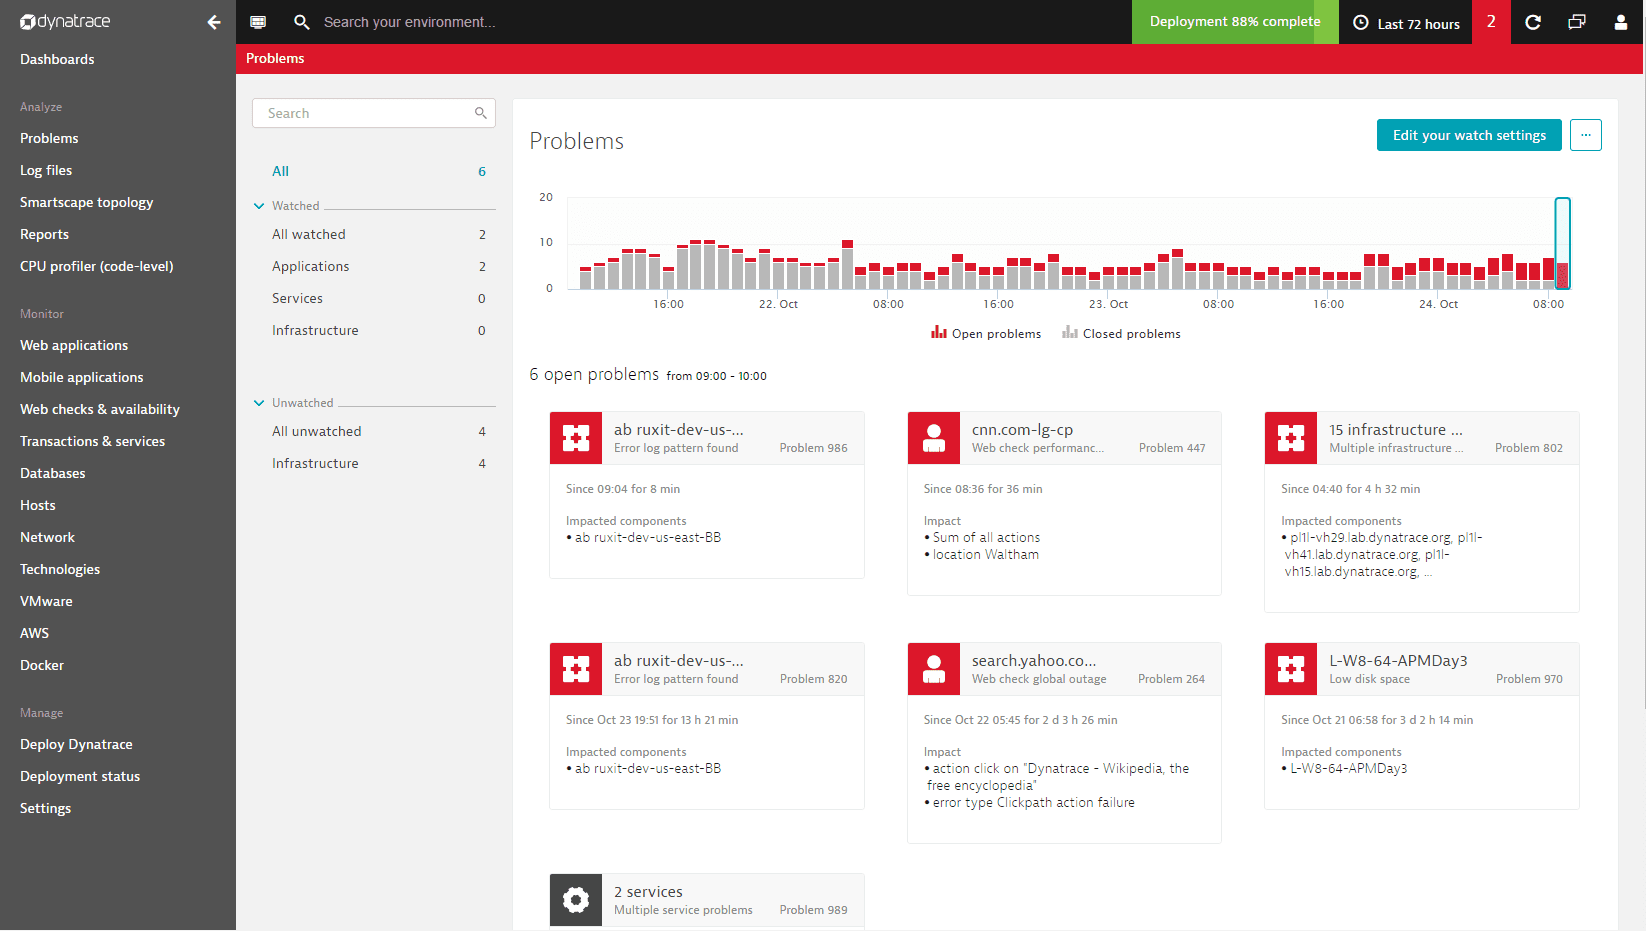
The problem feed provides you an overview of detected problems in your environment. The default timeframe of 72 hours is used because this gives DevOps teams adequate time to analyze detected problems, even when they occur on weekends. As always, quick response to detected problems is considered best practice.
Use the timeframe selector in the menu bar to select a custom period of time for problem history analysis, both within your Problems feed and on your Problems dashboard tile.

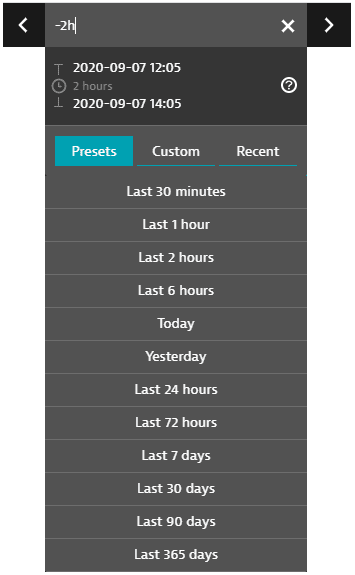
The global timeframe selector serves as a time filter that, in most cases, enables you to select a specific analysis timeframe that persists across all product pages and views as you navigate through your analysis.
-
The Presets tab lists all standard timeframes available. Select one to change your timeframe to that preset.
-
The Custom tab displays a calendar. Click a start day, click an end day, and then click Apply to select that range of days as your timeframe.
- Selected calendar intervals are set to end on start of the next day (with the time set to
00:00). For example, if you select September 3 to September 4 on the calendar, the timeframe starts on September 3 at time00:00and ends on September 5 at time00:00, so you never miss the last minute of the time range. You can edit these displayed times.
- Selected calendar intervals are set to end on start of the next day (with the time set to
-
The Recent tab displays recently used timeframes. Select one to revert to that timeframe.
-
The < and > controls shift the timerange forward or backward in time. The increment is the length of the original timerange. For example, if the current timerange is
Last 2 hours(the two-hour range ending now), click < to shift the timerange two hours back, to-4h to -2h(the two-hour range ending two hours ago). -
Hover over the timeframe to see the start time, duration, and end time.
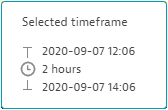
If you select the current timeframe in the menu bar, an editable timeframe expression is displayed.
- Reading from left to right, a timeframe expression has a start time, a
tooperator, and an end time. - If there is no explicit end time, the
toandnoware implied. For example,-2his the same-2h to now. - Supported units:
s,m,h,d,w,M,q,y(you can also use whole words such asminutesandquarter)
| Example timeframe expressions | Meaning |
|---|---|
| From the beginning of today to the beginning of tomorrow. |
| From the beginning of yesterday to the beginning of today. Like |
| From the beginning of yesterday to the current time today. |
| The previous seven whole days. If today is Monday, you get the previous Monday through the previous Sunday (yesterday). |
| The current calendar year, from January 1 of this year at |
| The last 42 days (6 weeks * 7 days) ending now. Equivalent to |
| From 2 hours (120 minutes) ago to the current time ( |
| From 4 days (96 hours) ago to 1.5 hours ago. |
| The last 7 days (168 hours), from this time 7 days ago to the current time ( |
| From the beginning of the previous calendar week to the current time (now).
In general, |
| Starting from the beginning of last week plus 8 hours (8:00 AM Monday).
|
| Business hours yesterday, from 09:00 - 17:00 (9 AM to 5 PM). |
| An absolute range consisting of absolute start and end dates and times in
|
| Unix epoch millisecond timestamps. |
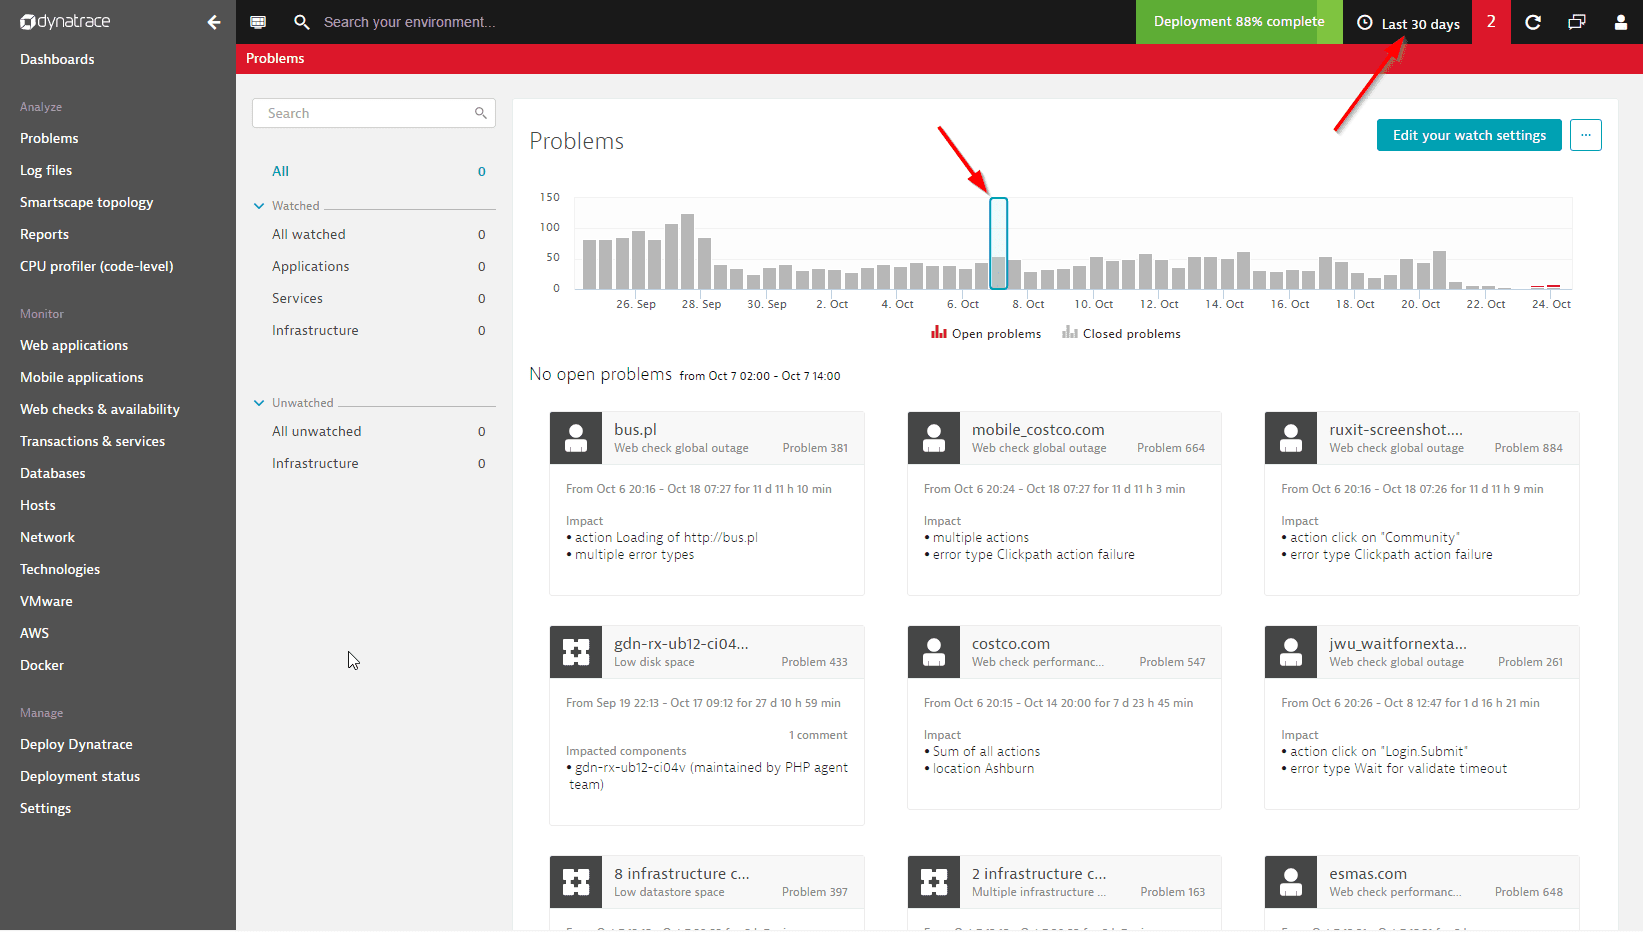
Because it's often not feasible to display all problems that were detected during timeframes longer than 72 hours, the Problems feed displays open/closed problems only for specific time intervals within the selected timeframe. In the example below, the feed shows only those open/closed problems that were detected between 09:00 – 10:00 am. You can select any time interval within the selected timeframe to drill down into the problem metrics for that time period. This approach only applies to timeframes of 72 hours or longer.
By changing the timeframe selector setting to the Last 30 days, you can view problem-detection statistics for the past month. Here again, you can select individual time intervals for deeper analysis (Oct 7, 02:00 to 14:00 in the example below).
Limitations to transaction storage
Complete transaction storage is limited to 14 days. Therefore, you must perform all detailed problem analysis and triage within 14 days of problem detection. For details on how the available granularity of timeseries data diminishes over time, see Data retention periods for timeseries metrics.
Problem overview page
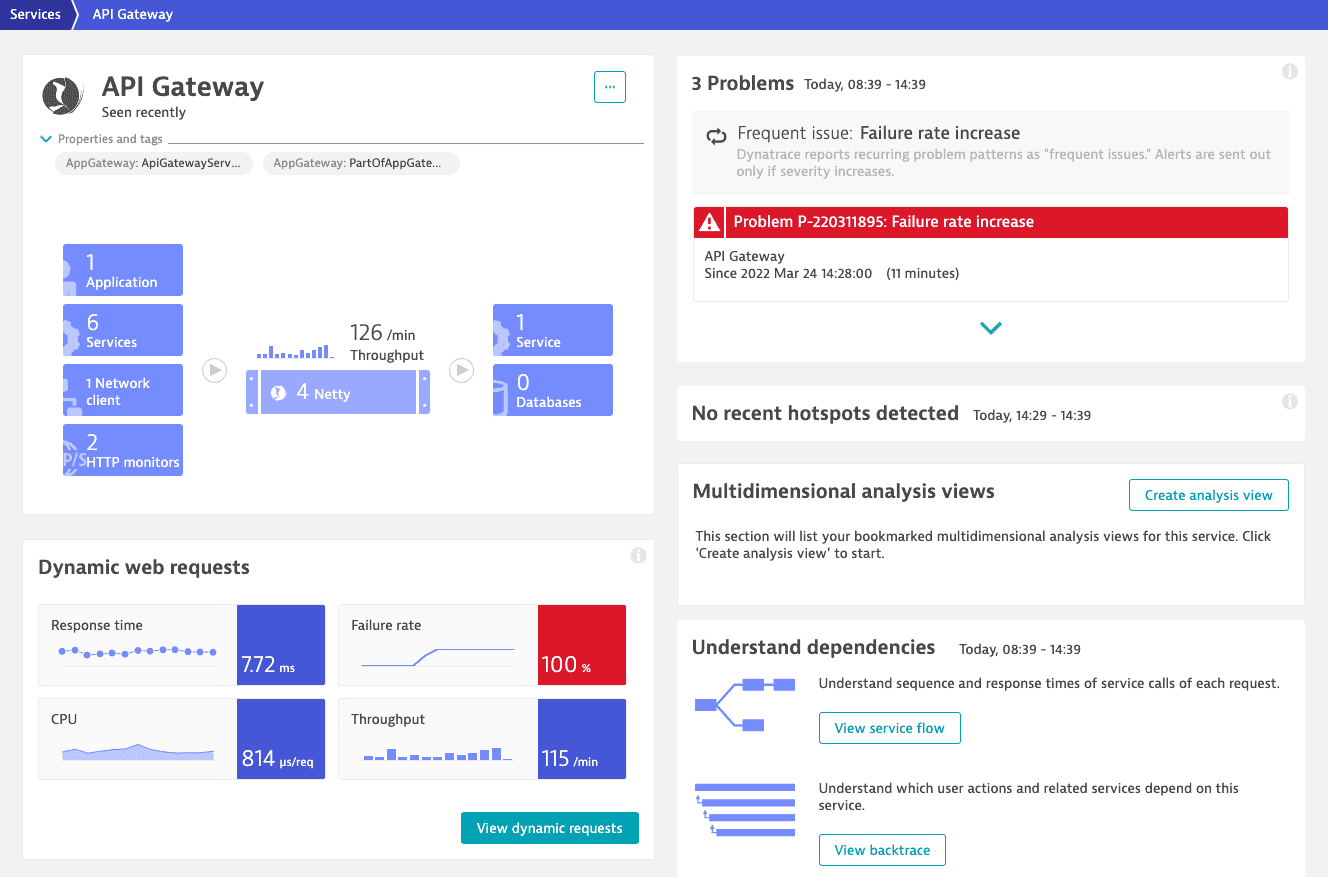
The problem overview page provides you quick insight into problem details.
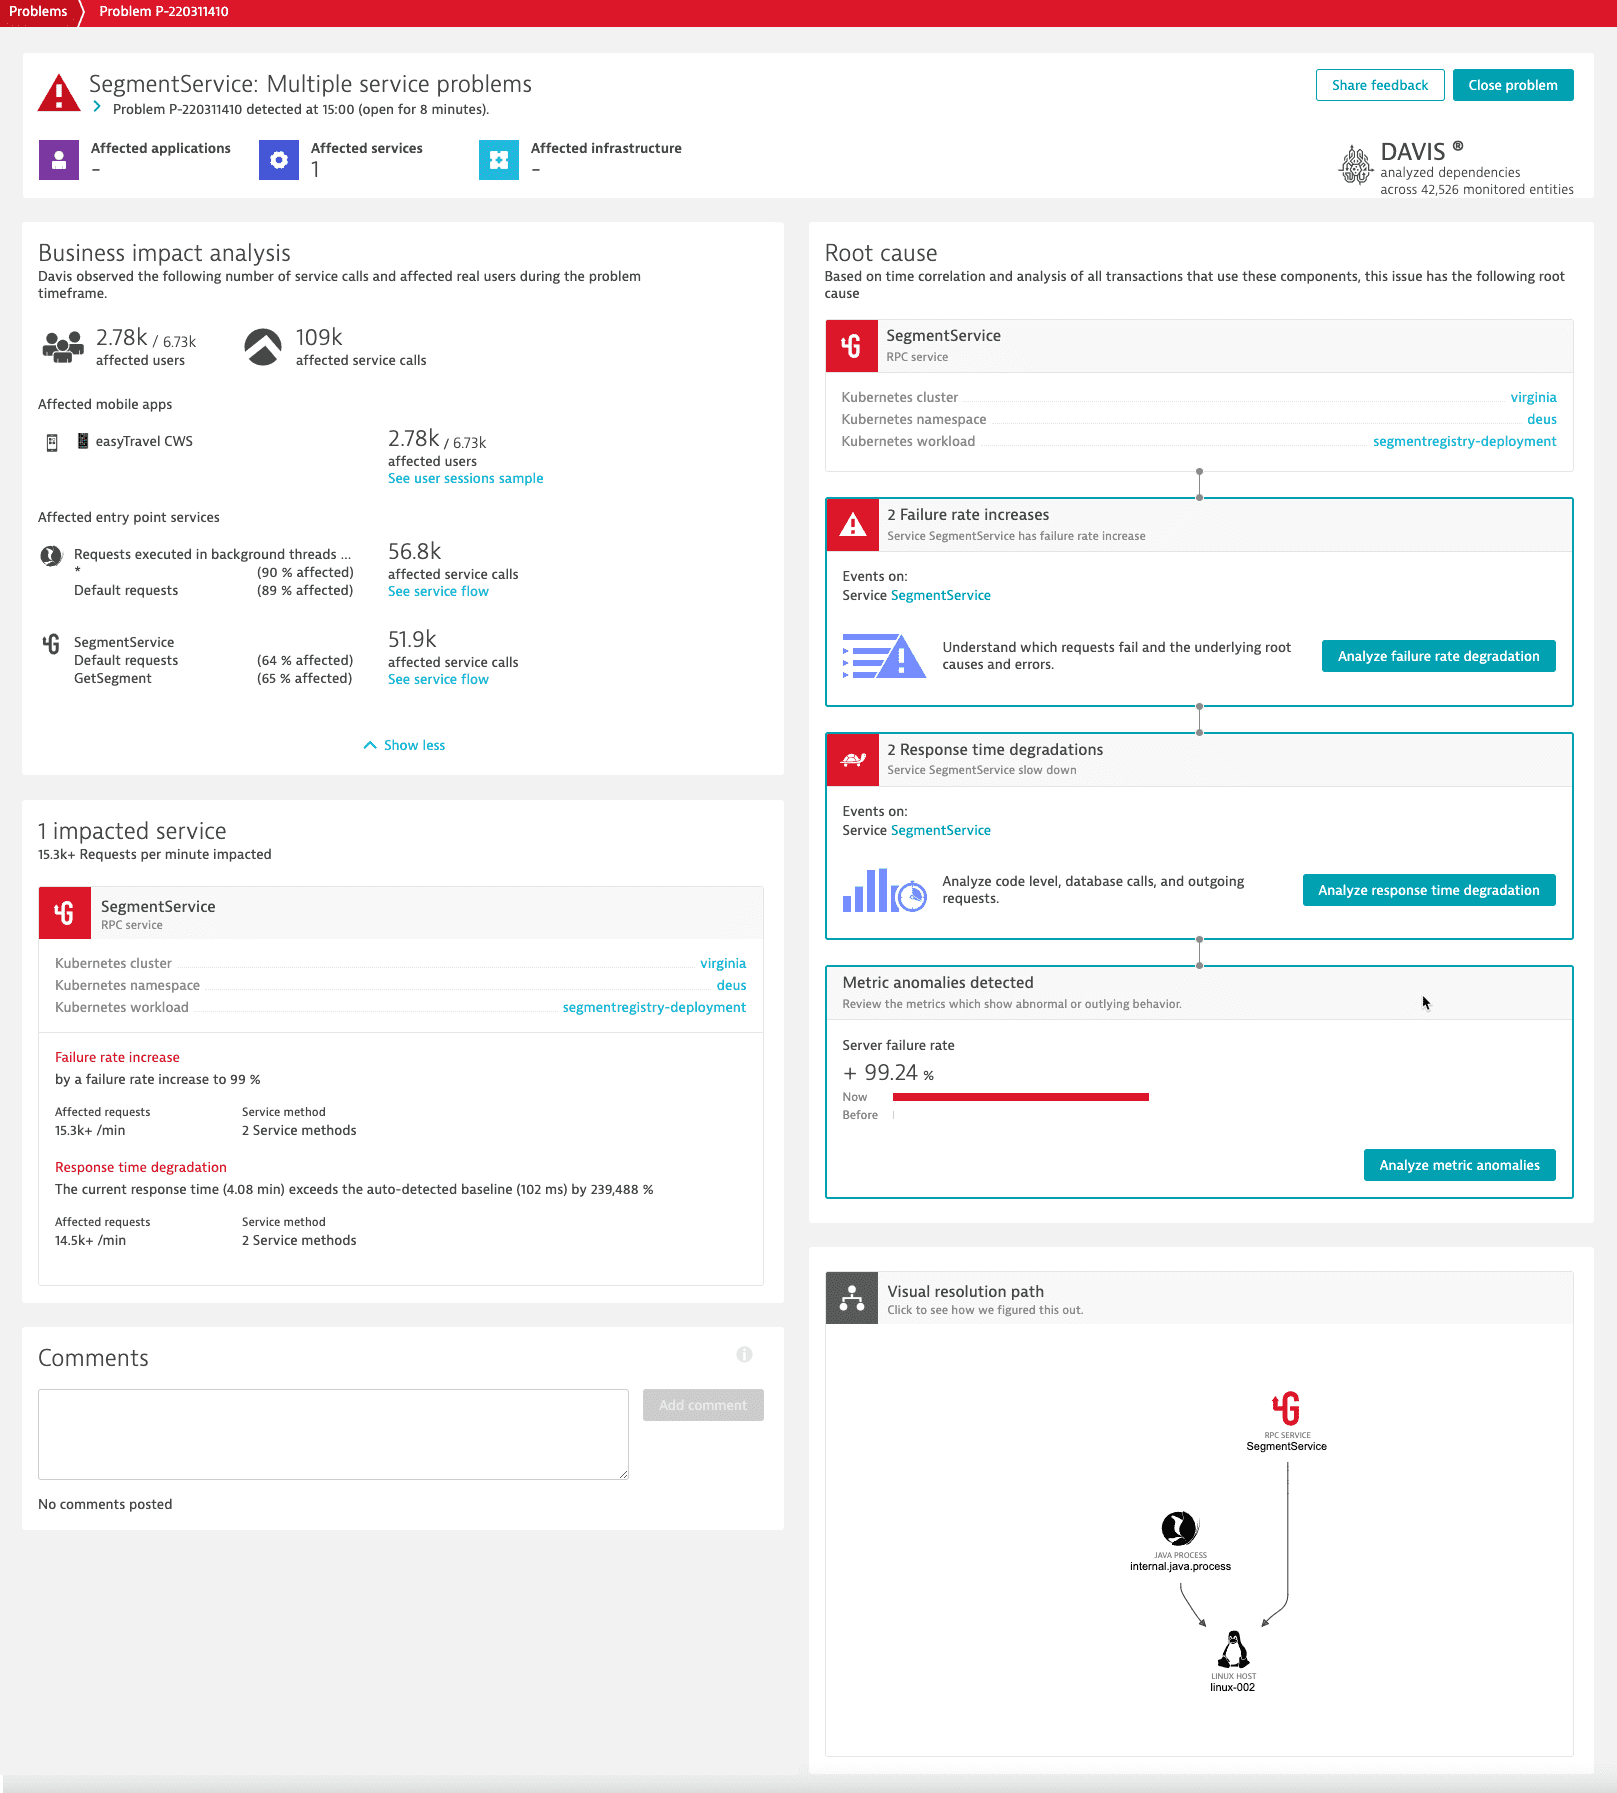
The upper section displays the number of applications, services, and infrastructure components that are affected by the problem.
- To manually close an open problem, select Close problem and provide your reason for closing the problem.
- Davis® is the AI causation engine behind Dynatrace problem analysis. To rate how Davis performed for this problem, select Share feedback and then select the thumbs-up or thumbs-down icon. You can also add an optional comment. Your feedback helps us to improve Davis and solve your problems.
To correlate the problem with your feedback, Dynatrace stores the problem context—problem type, severity, and events. Your personal information is not collected.
If you want to provide personal data (for example, your name and email address), add this information as a comment. We can't guarantee that we will respond.
The impact analysis section includes details about the direct consequences of the problem. It might also provide information about the business impact of the problem.
The root cause analysis section includes details about the underlying root causes of the problem. It shows the trace of the problem through your environment or points to a metric event configuration violation that triggered the problem.
To access a problem overview
- Go to Problems.
- From the Problems page, select the problem you want to analyze.
Problems with red icons are active problems while problems that feature gray icons are closed problems. You can alternatively access the Problems page by selecting the Problems dashboard tile.
Problem overview pages can also be accessed from individual entity pages. Active problems are indicated in red. Closed problems aren't displayed. Select any problem listed on an entity page to navigate to the problem's overview page.