Custom metrics for Log Monitoring v1
You are viewing documentation for Log Monitoring v1. Dynatrace Log Monitoring v1, is considered a legacy solution.
Log Monitoring v1 will reach the end of life and will be switched off in November 2023.
SaaS environments will be automatically upgraded to LMA or LMC.
We strongly encourage you to switch to the latest Dynatrace Log Monitoring version.
If you are currently using Dynatrace SaaS, upgrade to the latest version of Dynatrace log monitoring.
You can create a metric to make your current analysis available for charting and API usage. Select the logs that you're interested in. Then use the query language to search for relevant text patterns inside the selected logs that can be used for your custom metric.
For details on how custom metrics affect your monitoring consumption, see DDUs for metrics.
Dynatrace monitors and examines both log files that remain on the host system and log files that are stored on the Dynatrace server. A custom metric can be created only for monitored logs (log files that are stored on the Dynatrace server). If you use Log Monitoring as an ad hoc troubleshooting tool for a specific process or host, you'll likely view host-specific logs that haven't been designated for monitoring (that is, stored). As a result, the custom metric feature isn't available for such logs.
Create metric
You can create a custom metric that identifies pattern matches within the selected logs. When creating metrics, you need to be aware of what type of logs you expect the metric to appear in. Typical logs are based either on hosts or processes.
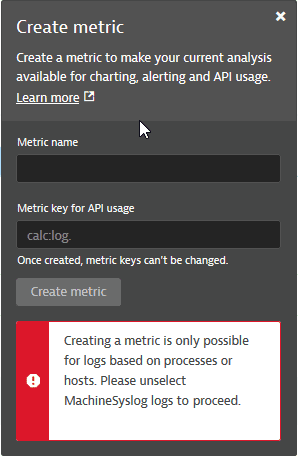
Creating a metric is possible only for logs that are based on hosts or processes. If your log selection includes a log that's based on a custom device, you have to unselect that log to create a metric.
When creating a custom metric, if your log selection includes both types of logs (host and process), you must select just one type of log for this metric. By default, the log type with the most log entries is selected.
If you change the log selection, make sure you select Display results to refresh the Create metric panel before creating the metric.
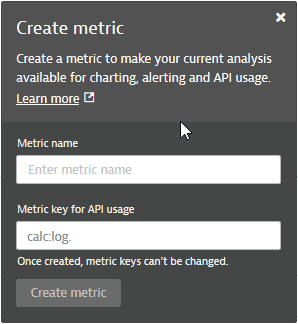
Enter the Metric name to have the Metric key for API usage generated automatically based on the metric name. You can modify this metric key. However, once created, the metric key can no longer be changed.
By default, the top results limit is set to 100 and is not configurable.
Metric options
Use metrics to create charts and events for alerting. You can manage them via the Metrics API.
Create a chart
Use Data Explorer to query and chart metrics.
Create an alert
To use a custom metric to create an alert, define a custom event with the new custom metric.
- On the Logs and events page, run a query against your logs.
- Select Create metric to create a custom metric based on the query.
- Enter the Metric name to have the Metric key for API usage generated automatically based on the metric name. You can modify this metric key. However, once created, the metric key can no longer be changed.
- Select Create metric.
The Metric successfully created panel is displayed. - Select Create alert.
The Metric events page is displayed with your metric information automatically filled in. Define the alert conditions and scope. A custom event is raised if the new custom metric exceeds the defined threshold.
- Select Metric events.
The event is added to Settings > Anomaly detection > Metric events.
API URL
Use the metric key for the API to receive either one aggregated data point per series or a list of data points per series.
To execute API requests, remember that you need to be authenticated.
Manage metrics
To view and manage all log metrics, including the one you just created, go to Settings > Log Monitoring > Metrics extraction. From the Log metrics page, you can do the following:
Add a new log metric (key, query, and dimensions)
View details of a log metric
Add a dimension to a log metric
Enable or disable a log metric
Delete a log metric
To view and manage all metrics, including log metrics, go to Metrics.
- To list only log metrics, filter by
log. - To see details about any metric, expand Details for the entry in the table.
- To view and configure the details of a metric, select Settings in the Details view.
- Select Create chart to create a chart of the metric and, optionally, pin the chart to a dashboard.
You can manage log metrics using the Dynatrace Configuration API. See Log Monitoring v1 metrics API for details.
Example
To create a log metric and pin a chart of the metric to your dashboard
- On the Logs and events page, run a query against your logs.
- Select Create metric to create a custom metric based on the query.
- Enter the Metric name to have the Metric key for API usage generated automatically based on the metric name. You can modify this metric key. However, once created, the metric key can no longer be changed.
- Select Create metric.
The Metric successfully created panel is displayed. - Select Create a custom chart to chart your metric and, optionally, pin it to a dashboard.
- On the Custom chart page, find and select your metric.
A chart is automatically generated. - Select Pin to dashboard to add a chart of your metric to a classic dashboard. For details, see Pin tiles to your dashboard.