Dynatrace dashboard timeframe and management zone settings
The dashboards discussed here are classic dashboards created using the dashboarding functionality integrated with previous Dynatrace.
- For more about classic dashboards, see Dashboards Classic.
- For more about dashboards created with the Dashboards app in the latest Dynatrace, see Dashboards.
- To improve your dashboard experience, you can upgrade existing dashboards from Dashboards Classic to the Dashboards app in the latest Dynatrace.
The global selectors for timeframe and management zone are available for use across all pages and views. You'll find them in the upper-right corner.
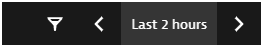
Select the filter button to select a new management zone
- Select the timeframe to select a new timeframe
The global timeframe selector serves as a time filter that, in most cases, enables you to select a specific analysis timeframe that persists across all product pages and views as you navigate through your analysis.
-
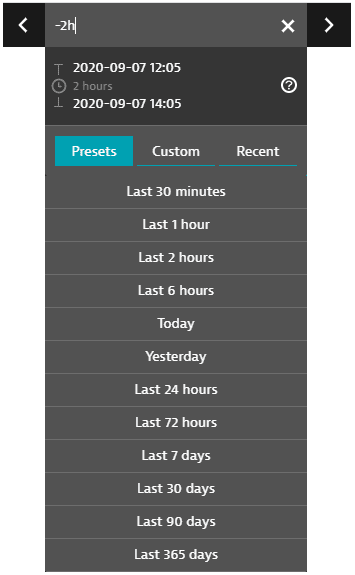
The Presets tab lists all standard timeframes available. Select one to change your timeframe to that preset.
-
The Custom tab displays a calendar. Click a start day, click an end day, and then click Apply to select that range of days as your timeframe.
- Selected calendar intervals are set to end on start of the next day (with the time set to
00:00). For example, if you select September 3 to September 4 on the calendar, the timeframe starts on September 3 at time00:00and ends on September 5 at time00:00, so you never miss the last minute of the time range. You can edit these displayed times.
- Selected calendar intervals are set to end on start of the next day (with the time set to
-
The Recent tab displays recently used timeframes. Select one to revert to that timeframe.
-
The < and > controls shift the timerange forward or backward in time. The increment is the length of the original timerange. For example, if the current timerange is
Last 2 hours(the two-hour range ending now), click < to shift the timerange two hours back, to-4h to -2h(the two-hour range ending two hours ago). -
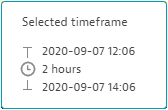
Hover over the timeframe to see the start time, duration, and end time.
If you select the current timeframe in the menu bar, an editable timeframe expression is displayed.
- Reading from left to right, a timeframe expression has a start time, a
tooperator, and an end time. - If there is no explicit end time, the
toandnoware implied. For example,-2his the same-2h to now. - Supported units:
s,m,h,d,w,M,q,y(you can also use whole words such asminutesandquarter)
Example timeframe expressions Meaning todayFrom the beginning of today to the beginning of tomorrow.
yesterdayFrom the beginning of yesterday to the beginning of today. Like
-1d/d to today.yesterday to nowFrom the beginning of yesterday to the current time today.
previous weekThe previous seven whole days. If today is Monday, you get the previous Monday through the previous Sunday (yesterday).
this yearThe current calendar year, from January 1 of this year at
00:00through January 1 of next year at00:00.last 6 weeksThe last 42 days (6 weeks * 7 days) ending now. Equivalent to
-6w to now.-2hFrom 2 hours (120 minutes) ago to the current time (
nowis implied). Equivalent toLast 2 hoursand-2h to now.-4d to -1h30mFrom 4 days (96 hours) ago to 1.5 hours ago.
-1wThe last 7 days (168 hours), from this time 7 days ago to the current time (
now). Equivalent to-7dand-168h.-1w/wFrom the beginning of the previous calendar week to the current time (now).
- If you used
-1w/won a Friday afternoon at 3:00, you would get a range of 11 days 15 hours, starting with the beginning of the previous week's Monday, because/wrounds down to the beginning of the week. - If you used
-1wwithout/won a Friday afternoon at 3:00, the start time would be exactly 7 days (168 hours) earlier: the previous Friday at 3:00 in the afternoon.
In general,
/used in combination with a unit (such as/d,/w,/M, and/y) means to round down the date or time to the beginning of the specified time unit. For example,-3dmeans exactly 72 hours ago, whereas-3d/dmeans three days ago rounded down to the nearest day (starting at time00:00, the beginning of the day). Usenow/dto mean the start of today.-1w/w + 8hStarting from the beginning of last week plus 8 hours (8:00 AM Monday).
- Note that you can use the
+and-operators with units, timestamps, andnow.
-1d/d+9h00m to -1d/d+17h00mBusiness hours yesterday, from 09:00 - 17:00 (9 AM to 5 PM).
2020-08-16 21:28 to 2020-08-19 10:02An absolute range consisting of absolute start and end dates and times in
YYYY-MM-DD hh:mmformat.- If you provide a date but omit the time (for example, just
2020-08-16), the time is assumed to be the beginning of day (00:00) - If you provide a time but omit the date (for example, just
21:28), the date is assumed to be today
1598545932346 to 1598837052346Unix epoch millisecond timestamps.
-
Timeframe and management zone preservation
Timeframe and management zone selections are sticky—they're propagated to all pages you visit. For example, after changing the timeframe and management zone on your dashboard, the selections are preserved as you drill down from the Applications tile to individual application pages.
The exception is opening a new dashboard or getting back to the current dashboard by selecting Dashboard in the upper-left corner of the page. In that case, the timeframe and management zone are reset to the dashboard's defaults.
The timeframe selector remembers up to 10 recently used timeframes.
Default timeframe and management zone
You can set a default timeframe and management zone for each dashboard; these are selected every time you open the dashboard. They're also used when you share the dashboard.
You can also specify a default timeframe and management zone for each tile.
Dashboard-specific timeframe
To set a dashboard timeframe that overrides the global timeframe
- Switch to the Settings tab.
- Turn on Default timeframe.
Select the timeframe you want to be the default for this dashboard.
Dashboard-specific management zone
To set a dashboard management zone that overrides the global management zone
- Switch to the Settings tab.
- Turn on Default management zone.
Select the management zone you want to be the default for this dashboard.
Tile-specific timeframe
To set a tile timeframe that overrides the dashboard timeframe
- Go to Dashboards or Dashboards Classic (latest Dynatrace).
Select the name of a dashboard to display that dashboard.
- Select Edit in the upper-right corner of the dashboard. The dashboard opens in edit mode.
- If you don't see an Edit option, you don't have permission to edit that dashboard.
Select the tile you want to configure.
- Turn on Custom timeframe.
Select the timeframe you want to be the default for this tile.
- Done.
When you set a tile-specific timeframe, a filter is displayed in the upper-right of the tile. Hover over the filter to see the setting.
Tile-specific management zone
To set a tile management zone that overrides the dashboard management zone
- Go to Dashboards or Dashboards Classic (latest Dynatrace).
Select the name of a dashboard to display that dashboard.
- Select Edit in the upper-right corner of the dashboard. The dashboard opens in edit mode.
- If you don't see an Edit option, you don't have permission to edit that dashboard.
Select the tile you want to configure.
- Turn on Custom management zone.
Select the management zone you want to be the default for this tile.
- Done.
When you set a tile-specific management zone, a filter is displayed in the upper-right of the tile. Hover over the filter to see the setting.