Dynatrace Collector
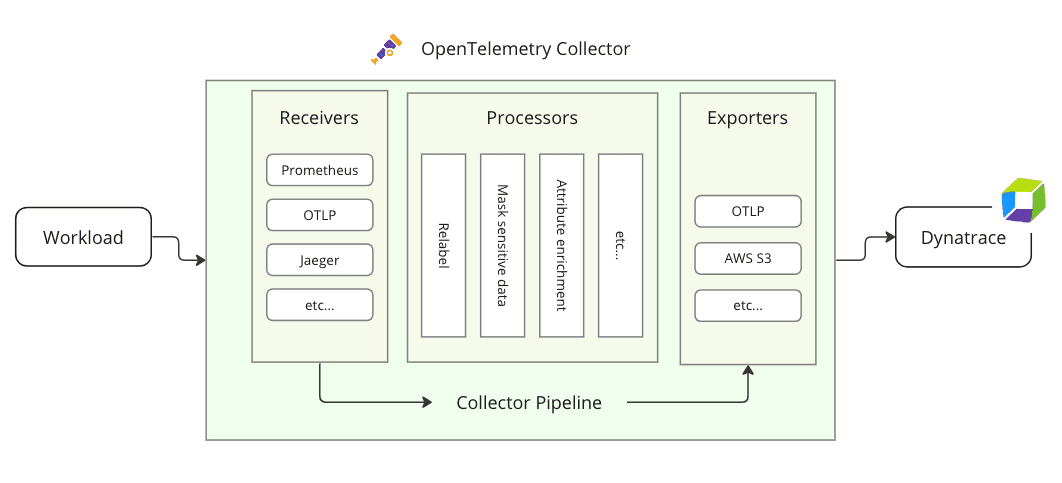
The Collector is a network service application that you can use to batch and transform telemetry data. It acts as a proxy and can receive OTLP requests as well as data from other sources, transform these requests according to defined rules, and forward them to the backend.
Advantages of using the Collector
In general, using the Collector alongside your service can be an advantage, since it allows your service to offload data quickly and takes care of additional handling such as retries, batching, encryption, or sensitive data filtering. It centralizes common processing tasks instead of duplicating them in each application.
You should use the Collector if:
- You need a vendor-agnostic way to collect data from different data sources in different formats and you need an easy way to make them all deliver their data to a backend that would otherwise be incompatible.
- You need to have common processing of attributes on your telemetry data.
The Collector is a relatively lightweight component, so teams can deploy their own to avoid sharing the same configuration.
The Collector is configured in a single YAML file. This eliminates the need to browse through multiple files and reduces maintenance. You can find more information on the configuration at Collector Configuration.
Distributions
The Collector comes in different distribution flavors and with different setup and deployment options.
Dynatrace Collector
The Dynatrace distribution of the OpenTelemetry Collector is a customized Collector build provided by Dynatrace and tailored for typical use cases in a Dynatrace context. It ships with an optimized and verified set of Collector components.
Dynatrace Collector offers the following advantages compared to the OpenTelemetry Collector distributions:
Covered by Dynatrace support
Collector components verified by Dynatrace
Security patches independent of OpenTelemetry Collector releases
You can download the latest Dynatrace Collector release from https://github.com/Dynatrace/dynatrace-otel-collector/releases/latest.
It is also available as a Docker image at Github Packages and can be pulled using the following command:
docker pull ghcr.io/dynatrace/dynatrace-otel-collector/dynatrace-otel-collector:[VERSION]
Included components
By default, the Dynatrace Collector ships with the following Collector components.
Receivers | |||
Processors | ||
Extensions | |
Connectors | |
OpenTelemetry Distributions
There are two principal OpenTelemetry distributions of the Collector:
- Collector Core
- Collector Contrib
Additionally, OpenTelemetry also provides the Collector Builder, which allows you to build your own, customized Collector binary.
Dynatrace only provides limited support for Core, Contrib, and Builder setups, covering only the components and their versions included in Dynatrace Collector.
For a fully supported Collector distribution, see Dynatrace Collector.
Collector Core
The Core distribution contains the basic proxy service and a few fundamental service components:
A receiver for OTLP over HTTP and gRPC
Processors for batching requests and ensuring memory usage constraints
Exporters for console logging and OTLP over HTTP and gRPC
Collector Contrib
The Contrib distribution builds on top of Core and enhances its functionality by shipping with a large number of additional receivers, processors, and exporters, contributed by third parties.
Given that the Contrib distribution is an all-in-one package and comes with all service components pre-compiled, it may use more system resources (storage and memory) than an optimized Collector build. Generally, we recommend using the Contrib distribution for testing purposes and a custom build of the Collector (see Builder) in production.
Collector Builder (ocb)
In addition to the two distributions, OpenTelemetry also offers the Collector Builder, a command line tool that allows you to build your own customized version of the Collector.
Which distribution should I use?
| Type | When should I use it? |
|---|---|
| Dynatrace Collector recommended | The preferred choice for most use cases. It ships with a set of verified and stable Collector components, typically used with Dynatrace setups. |
| Custom Builder version | When you need to fully customize the Collector instance and only run the components required for your use case. |
| Core | When you primarily want to convert between OTLP protocols (HTTP ↔ gRPC), ensure memory usage constraints, or apply request batching. |
| Contrib | Ideal for test setups, as it contains all third-party components and doesn't require a custom build. It's generally not recommended for use in production systems, as it typically uses more resources and may be less stable than an optimized Builder instance. |
Components
Receiver
A receiver is a component that enables data to come into the Collector. It can receive data from multiple sources. Many receivers come with default settings and do not need much configuration.
For a list of available receivers and their basic configuration, see the official OpenTelemetry documentation on receivers.
Processor optional
A processor is an optional component that decides what to do with the data.
For a list of available processors and their basic configuration, see the official OpenTelemetry documentation on processors. OpenTelemetry has a list of recommended processors, but these are optional.
Exporter
An exporter is a component that sends processed data to one or more backends. Exporters can support more than one data source.
Because many exporters require additional configuration (for example, an endpoint), be sure to check the official OpenTelemetry documentation on exporters for a list of available exporters and their configurations.
Services
Services are used to define pipelines that channel data through the Collector. They define which components work together to process OpenTelemetry data.