WMI tutorial - unified analysis
Unified analysis pages are windows into performance analysis and troubleshooting for this newly monitored technology.
They offer the possibility to eliminate further dashboarding or ad-hoc chart building. The screens section will define the details to be displayed on each entity's page as well as charts and lists of other related entities for quick drilldowns.
Unified analysis detailed page
The details page is organized into staticContent and a layout for dynamic content that comprises cards (charts and lists).
staticContent
showProblems- Show a panel for any Problems about this entityshowProperties- Show the Properties and tags sectionshowTags- Show the tags applied to this entityshowGlobalFilter- Show the global filtering barshowAddTag- Show the Add tag button
The layout consists of different cards defined in the chartsCards and entitiesListCards subsections.
Charts card
A chart card is a section of the screen that displays charts. All possible charts are defined in the card, and a number of them can be displayed at the same time on the screen. The others are available from the dropdown list above the chart.
Charts cards rely on metric selectors to correctly display metrics.
Simple chart card example:
chartsCards:- key: "host-cpu-metrics"displayName: "Host CPU"numberOfVisibleCharts: 2charts:- displayName: "Idle CPU"metrics:- metricSelector: "custom.demo.host-observability.host.cpu.time.idle:SplitBy()"- displayName: "User CPU"metrics:- metricSelector: "custom.demo.host-observability.host.cpu.time.user:SplitBy()"
Entity list
An entity list is a list of entities that are somehow related to the currently viewed entity. Additional metrics can be charted in the details of each returned entity and will show as a single value in the list view.
Entity lists rely on entity selectors to correctly list related entities.
Simple entity list example:
entitiesListCards:- key: "nic-list"displayName: "Network Interfaces"entitySelectorTemplate: "type(wmi:generic_network_device),fromRelationships.runsOn($(entityConditions)),wmi_network_type(Interface)"displayCharts: falsedisplayIcons: trueenableDetailsExpandability: true
$(entityConditions) is a function that automatically maps to the currently viewed entity. This is mandatory for entity selectors used in the extension.
The properties card
The propertiesCard of an entity can also be modified to include additional properties or hide unnecessary ones. Properties are extracted from entity attributes (when type is ATTRIBUTE) or through an entity selector (when type is RELATION).
Define unified pages for your extension
- Add the
screenssection to yourextension.yamlusing the template below. Customize the details page settings for both the Generic Host and the Generic Network Device entity types.
Use charts cards to display all the metrics of each entity.
Add entity list cards so that a Generic Host can list out all Network Adapters and Interfaces running on it.
Add a relation based property so that a Generic Network Device displays what Generic Host it runs on.
Package and upload a new version of your extension.
Validate your screens are showing up as expected.
screens:- entityType: wmi:generic_hostdetailsSettings:staticContent:showProblems: trueshowProperties: trueshowTags: trueshowGlobalFilter: trueshowAddTag: truelayout:autoGenerate: falsecards:- type: "CHART_GROUP"key: "wmi_host-chart-metrics"- type: "ENTITIES_LIST"key: "wmi_host-list-network_interfaces"- type: "ENTITIES_LIST"key: "wmi_host-list-network_adapters"chartsCards:- key: "wmi_host-chart-metrics"displayName: "Generic Host Metrics"numberOfVisibleCharts: 2charts:- displayName: "CPU Usage Breakdown"visualization:themeColor: BLUEseriesType: AREAmetrics:- metricSelector: "custom.demo.host-observability.host.cpu.time.idle:SplitBy()"- metricSelector: "custom.demo.host-observability.host.cpu.time.user:SplitBy()"- metricSelector: "custom.demo.host-observability.host.cpu.time.processor:SplitBy()"- displayName: "CPU User"visualization:themeColor: BLUEseriesType: LINEmetrics:- metricSelector: "custom.demo.host-observability.host.cpu.time.user:SplitBy()"- displayName: "CPU Idle"visualization:themeColor: BLUEseriesType: LINEmetrics:- metricSelector: "custom.demo.host-observability.host.cpu.time.idle:SplitBy()"- displayName: "CPU Used"visualization:themeColor: BLUEseriesType: LINEmetrics:- metricSelector: "custom.demo.host-observability.host.cpu.time.processor:SplitBy()"entitiesListCards:- key: "wmi_host-list-network_interfaces"displayName: "Network Interfaces"entitySelectorTemplate: "type(wmi:generic_network_device),fromRelationships.runsOn($(entityConditions)),wmi_network_type(Interface)"pageSize: 5displayCharts: falsedisplayIcons: trueenableDetailsExpandability: truenumberOfVisibleCharts: 1charts:- displayName: "Traffic"visualization:themeColor: BLUEseriesType: AREAmetrics:- metricSelector: "custom.demo.host-observability.network.bytes.sent.persec:SplitBy()"- metricSelector: "custom.demo.host-observability.network.bytes.received.persec:SplitBy()"- key: "wmi_host-list-network_adapters"displayName: "Network Adapters"entitySelectorTemplate: "type(wmi:generic_network_device),fromRelationships.runsOn($(entityConditions)),wmi_network_type(Adapter)"pageSize: 5displayCharts: falsedisplayIcons: trueenableDetailsExpandability: truenumberOfVisibleCharts: 1charts:- displayName: "Traffic"visualization:themeColor: BLUEseriesType: AREAmetrics:- metricSelector: "custom.demo.host-observability.network.bytes.sent.persec:SplitBy()"- metricSelector: "custom.demo.host-observability.network.bytes.received.persec:SplitBy()"- entityType: wmi:generic_network_devicepropertiesCard:properties:- type: ATTRIBUTEattribute:key: wmi_network_namedisplayName: Name- type: ATTRIBUTEattribute:key: wmi_network_typedisplayName: Type- type: RELATIONrelation:entitySelectorTemplate: type(wmi:generic_host),toRelationships.runsOn($(entityConditions))displayName: HostdetailsSettings:staticContent:showProblems: trueshowProperties: trueshowTags: trueshowGlobalFilter: trueshowAddTag: truelayout:autoGenerate: falsecards:- type: "CHART_GROUP"key: "wmi_network_device-chart-traffic"chartsCards:- key: "wmi_network_device-chart-traffic"displayName: "Traffic"numberOfVisibleCharts: 2charts:- displayName: "Traffic breakdown"visualization:themeColor: BLUEseriesType: AREAmetrics:- metricSelector: "custom.demo.host-observability.network.bytes.persec:SplitBy()"- metricSelector: "custom.demo.host-observability.network.bytes.sent.persec:SplitBy()"- metricSelector: "custom.demo.host-observability.network.bytes.received.persec:SplitBy()"- displayName: "Bytes sent"visualization:themeColor: BLUEseriesType: LINEmetrics:- metricSelector: "custom.demo.host-observability.network.bytes.sent.persec:SplitBy()"- displayName: "Bytes received"visualization:themeColor: BLUEseriesType: LINEmetrics:- metricSelector: "custom.demo.host-observability.network.bytes.sent.persec:SplitBy()"- displayName: "Bytes"visualization:themeColor: BLUEseriesType: LINEmetrics:- metricSelector: "custom.demo.host-observability.network.bytes.sent.persec:SplitBy()"
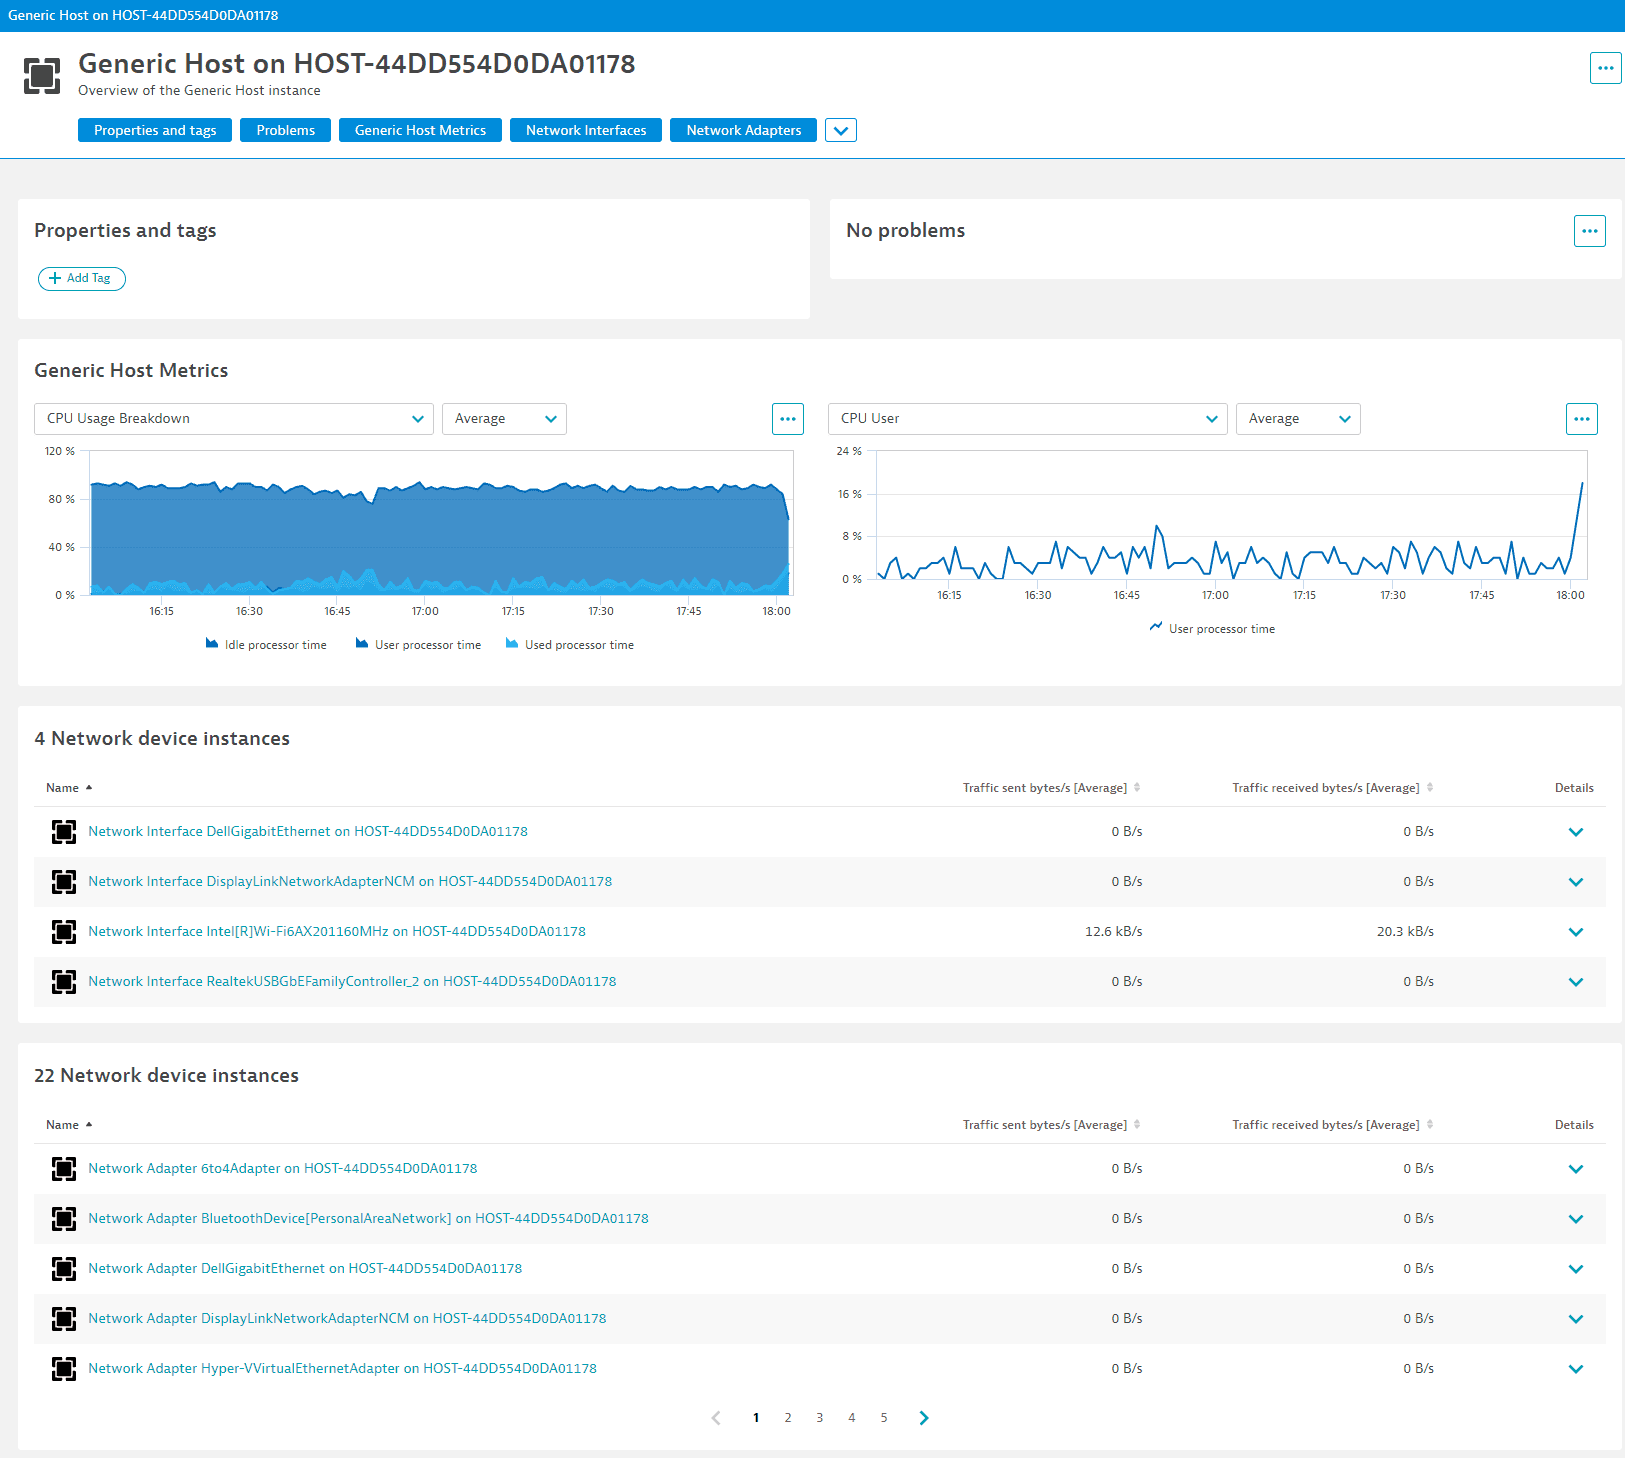
Results
Your customized unified analysis pages are displayed and populated as expected.