Extensions
Get your data into Dynatrace with Extensions 2.0.
Dynatrace can ingest data from hundreds of tools, which means you get:
A single source of truth for observability.
A continuous flow of actionable data to help you fix problems quickly, maintain complex systems, improve code quality, and accelerate digital transformation.
If we don't have a pre-built solution for your situation, you can declaratively bring metrics into Dynatrace that feed platform analytics and monitoring capabilities. Dynatrace links your data in a meaningful way so you can explore it, build instrumentation, and set up alerting.
Before you begin
Remote extensions
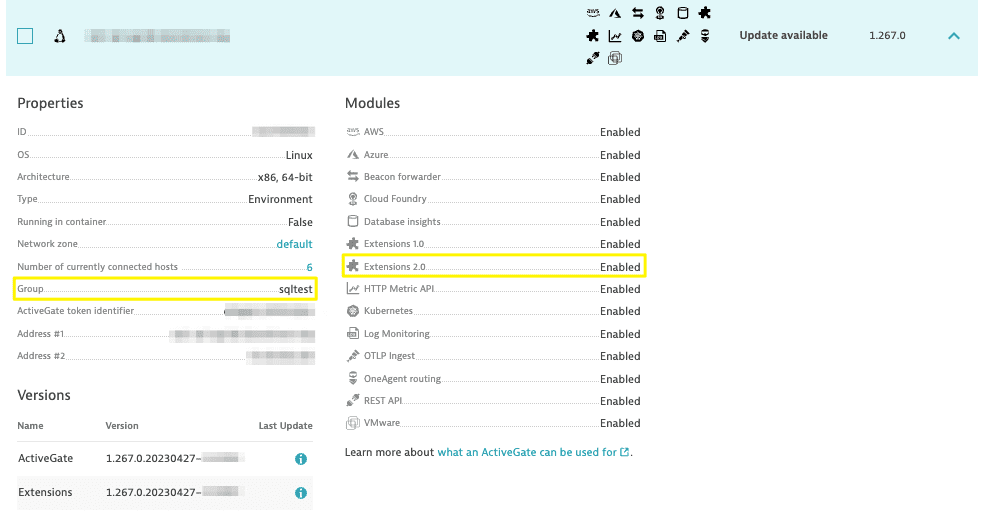
Verify that your designated ActiveGate has the Extensions 2.0 module active and running.
- Go to Deployment Status > ActiveGates and expand the details of the designated ActiveGate.
- In the Properties section, make sure that the ActiveGate is assigned to a Group.
- In the Modules section, make sure that the Extensions 2.0 module is enabled.
If either of these properties needs to be changed, see Configuration properties and parameters of ActiveGate.
Any changes made via ActiveGate configuration files require a restart of the ActiveGate and Extensions Execution Controller (EEC) services.
Basics
Extensions 2.0 concepts
Familiarize yourself with Extensions 2.0 concepts.
Extension lifecycle
Get to know the Extensions 2.0 lifecycle and management.
Extension tutorial
Get started with Extensions 2.0 by creating a simple WMI extension.
Extension YAML file
Learn the basic structure and elements of your extension YAML file.
Customize data
Customize various aspects of Dynatrace to the specifics of data acquired by your extension.
Sign extensions
Learn how to sign extensions for secure distribution in your environment.
Data sources
SNMP
Extend your observability into data from your network devices with declarative metrics based on SNMP OIDs.
WMI
Extend your observability into data from devices exposing Windows Management Instrumentation interface.
Prometheus
Extend your applications and services data with metrics acquired from a Prometheus endpoint outside Kubernetes.

SQL
Extend your observability into data acquired from a database layer using SQL queries.
JMX
Extend your observability into data acquired from JMX MBeans.
Python
Preview
Extend your observability into data from any technology that exposes data via an interface using custom-coded extensions based on the Dynatrace-provided Python SDK.