Services anomaly detection API - GET configuration
Gets the configuration of anomaly detection for services.
The request produces an application/json payload.
| GET | ManagedDynatrace for Government | https://{your-domain}/e/{your-environment-id}/api/config/v1/anomalyDetection/services |
| SaaS | https://{your-environment-id}.live.dynatrace.com/api/config/v1/anomalyDetection/services | |
| Environment ActiveGate | https://{your-activegate-domain}:9999/e/{your-environment-id}/api/config/v1/anomalyDetection/services |
Authentication
To execute this request, you need an access token with ReadConfig scope.
To learn how to obtain and use it, see Tokens and authentication.
Parameters
The request doesn't provide any configurable parameters.
Response
Response codes
| Code | Type | Description |
|---|---|---|
| 200 | ServiceAnomalyDetectionConfig | Success |
Response body objects
The ServiceAnomalyDetectionConfig object
Dynatrace automatically detects service-related performance anomalies such as response time degradations and failure rate increases. Use these settings to configure detection sensitivity, set alert thresholds, or disable alerting for certain services.
| Element | Type | Description |
|---|---|---|
| failureRateIncrease | FailureRateIncreaseDetectionConfig | Configuration of failure rate increase detection. |
| loadDrop | LoadDropDetectionConfig | The configuration of load drops detection. |
| loadSpike | LoadSpikeDetectionConfig | The configuration of load spikes detection. |
| metadata | ConfigurationMetadata | Metadata useful for debugging |
| responseTimeDegradation | ResponseTimeDegradationDetectionConfig | Configuration of response time degradation detection. |
The FailureRateIncreaseDetectionConfig object
Configuration of failure rate increase detection.
| Element | Type | Description |
|---|---|---|
| automaticDetection | FailureRateIncreaseAutodetectionConfig | Parameters of failure rate increase auto-detection. Required if detectionMode is The absolute and relative thresholds both must exceed to trigger an alert. Example: If the expected error rate is 1.5%, and you set an absolute increase of 1%, and a relative increase of 50%, the thresholds will be: Absolute: 1.5% + 1% = 2.5% Relative: 1.5% + 1.5% * 50% = 2.25% |
| detectionMode | string | How to detect failure rate increase: automatically, or based on fixed thresholds, or do not detect.
|
| thresholds | FailureRateIncreaseThresholdConfig | Fixed thresholds for failure rate increase detection. Required if detectionMode is |
The FailureRateIncreaseAutodetectionConfig object
Parameters of failure rate increase auto-detection. Required if detectionMode is DETECT_AUTOMATICALLY. Not applicable otherwise.
The absolute and relative thresholds both must exceed to trigger an alert.
Example: If the expected error rate is 1.5%, and you set an absolute increase of 1%, and a relative increase of 50%, the thresholds will be: Absolute: 1.5% + 1% = 2.5% Relative: 1.5% + 1.5% * 50% = 2.25%
| Element | Type | Description |
|---|---|---|
| failingServiceCallPercentageIncreaseAbsolute | integer | Absolute increase of failing service calls to trigger an alert, %. |
| failingServiceCallPercentageIncreaseRelative | integer | Relative increase of failing service calls to trigger an alert, %. |
The FailureRateIncreaseThresholdConfig object
Fixed thresholds for failure rate increase detection.
Required if detectionMode is DETECT_USING_FIXED_THRESHOLDS. Not applicable otherwise.
| Element | Type | Description |
|---|---|---|
| sensitivity | string | Sensitivity of the threshold. With With
|
| threshold | integer | Failure rate during any 5-minute period to trigger an alert, %. |
The LoadDropDetectionConfig object
The configuration of load drops detection.
| Element | Type | Description |
|---|---|---|
| enabled | boolean | The detection is enabled ( |
| loadDropPercent | integer | Alert if the observed load is less than X % of the expected value. |
| minAbnormalStateDurationInMinutes | integer | Alert if the service stays in abnormal state for at least X minutes. |
The LoadSpikeDetectionConfig object
The configuration of load spikes detection.
| Element | Type | Description |
|---|---|---|
| enabled | boolean | The detection is enabled ( |
| loadSpikePercent | integer | Alert if the observed load is more than X % of the expected value. |
| minAbnormalStateDurationInMinutes | integer | Alert if the service stays in abnormal state for at least X minutes. |
The ConfigurationMetadata object
Metadata useful for debugging
| Element | Type | Description |
|---|---|---|
| clusterVersion | string | Dynatrace version. |
| configurationVersions | integer[] | A sorted list of the version numbers of the configuration. |
| currentConfigurationVersions | string[] | A sorted list of version numbers of the configuration. |
The ResponseTimeDegradationDetectionConfig object
Configuration of response time degradation detection.
| Element | Type | Description |
|---|---|---|
| automaticDetection | ResponseTimeDegradationAutodetectionConfig | Parameters of the response time degradation auto-detection. Required if the detectionMode is Violation of any criterion triggers an alert. |
| detectionMode | string | How to detect response time degradation: automatically, or based on fixed thresholds, or do not detect.
|
| thresholds | ResponseTimeDegradationThresholdConfig | Fixed thresholds for response time degradation detection. Required if detectionMode is |
The ResponseTimeDegradationAutodetectionConfig object
Parameters of the response time degradation auto-detection. Required if the detectionMode is DETECT_AUTOMATICALLY. Not applicable otherwise.
Violation of any criterion triggers an alert.
| Element | Type | Description |
|---|---|---|
| loadThreshold | string | Minimal service load to detect response time degradation. Response time degradation of services with smaller load won't trigger alerts.
|
| responseTimeDegradationMilliseconds | integer | Alert if the response time degrades beyond X milliseconds. |
| responseTimeDegradationPercent | integer | Alert if the response time degrades beyond X %. |
| slowestResponseTimeDegradationMilliseconds | integer | Alert if the response time of the slowest 10% degrades beyond X milliseconds. |
| slowestResponseTimeDegradationPercent | integer | Alert if the response time of the slowest 10% degrades beyond X %. |
The ResponseTimeDegradationThresholdConfig object
Fixed thresholds for response time degradation detection.
Required if detectionMode is DETECT_USING_FIXED_THRESHOLDS. Not applicable otherwise.
| Element | Type | Description |
|---|---|---|
| loadThreshold | string | Minimal service load to detect response time degradation. Response time degradation of services with smaller load won't trigger alerts.
|
| responseTimeThresholdMilliseconds | integer | Response time during any 5-minute period to trigger an alert, in milliseconds. |
| sensitivity | string | Sensitivity of the threshold. With With
|
| slowestResponseTimeThresholdMilliseconds | integer | Response time of the 10% slowest during any 5-minute period to trigger an alert, in milliseconds. |
Response body JSON model
{"failureRateIncrease": {"detectionMode": "DETECT_USING_FIXED_THRESHOLDS","thresholds": {"sensitivity": "LOW","threshold": 10}},"loadDrop": {"enabled": true,"loadDropPercent": 40,"minAbnormalStateDurationInMinutes": 5},"loadSpike": {"enabled": false},"metadata": {"clusterVersion": "Mock version","configurationVersions": [4,2]},"responseTimeDegradation": {"automaticDetection": {"loadThreshold": "ONE_REQUEST_PER_MINUTE","responseTimeDegradationMilliseconds": 250,"responseTimeDegradationPercent": 90,"slowestResponseTimeDegradationMilliseconds": 500,"slowestResponseTimeDegradationPercent": 200},"detectionMode": "DETECT_AUTOMATICALLY"}}
Example
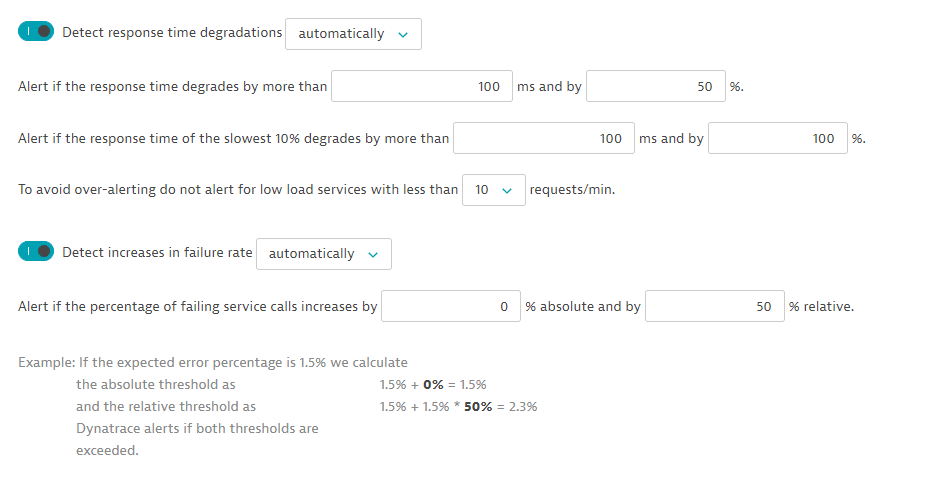
In this example, the request lists the current configuration of anomaly detection for services.
The API token is passed in the Authorization header.
The configuration has the following settings:
Curl
curl -X GET \https://mySampleEnv.live.dynatrace.com/api/config/v1/anomalyDetection/services \-H 'Authorization: Api-Token dt0c01.abc123.abcdefjhij1234567890'
Request URL
https://mySampleEnv.live.dynatrace.com/api/config/v1/anomalyDetection/services
Response body
{"metadata": {"clusterVersion": "1.163.14.20190204-102159","configurationVersions": [2]},"responseTimeDegradation": {"detectionMode": "DETECT_AUTOMATICALLY","automaticDetection": {"responseTimeDegradationMilliseconds": 100,"responseTimeDegradationPercent": 50,"slowestResponseTimeDegradationMilliseconds": 100,"slowestResponseTimeDegradationPercent": 100,"loadThreshold": "TEN_REQUESTS_PER_MINUTE"}},"failureRateIncrease": {"detectionMode": "DETECT_AUTOMATICALLY","automaticDetection": {"failingServiceCallPercentageIncreaseAbsolute": 0,"failingServiceCallPercentageIncreaseRelative": 50}}}
Response code
200