Metric events anomaly detection API - PUT an event
This API is deprecated. Use the Settings API instead. Look for the Metric events (builtin:anomaly-detection.metric-events) schema.
Updates the specified metric event rule.
The request consumes an application/json payload.
| PUT | ManagedDynatrace for Government | https://{your-domain}/e/{your-environment-id}/api/config/v1/anomalyDetection/metricEvents/{id} |
| SaaS | https://{your-environment-id}.live.dynatrace.com/api/config/v1/anomalyDetection/metricEvents/{id} | |
| Environment ActiveGate | https://{your-activegate-domain}:9999/e/{your-environment-id}/api/config/v1/anomalyDetection/metricEvents/{id} |
Authentication
To execute this request, you need an access token with WriteConfig scope.
To learn how to obtain and use it, see Tokens and authentication.
Parameters
To find all JSON models that depend on the type of the model, refer to JSON models.
| Parameter | Type | Description | In | Required |
|---|---|---|---|---|
| id | string | The ID of the metric event to be updated. If you also set the ID in the body, it must match this ID. | path | required |
| body | MetricEvent | The JSON body of the request. Contains updated parameters of the metric event. | body | optional |
Request body objects
The MetricEvent object
The configuration of the metric event.
| Element | Type | Description | Required |
|---|---|---|---|
| aggregationType | string | How the metric data points are aggregated for the evaluation. The timeseries must support this aggregation.
| optional |
| alertingScope | MetricEventAlertingScope[] | Defines the scope of the metric event. Only one filter is allowed per filter type, except for tags, where up to 3 are allowed. The filters are combined by conjunction. | optional |
| description | string | The description of the metric event. | required |
| disabledReason | string | The reason of automatic disabling. The
| optional |
| enabled | boolean | The metric event is enabled ( | required |
| id | string | The ID of the metric event. | optional |
| metadata | ConfigurationMetadata | Metadata useful for debugging | optional |
| metricDimensions | MetricEventDimensions[] | Defines the dimensions of the metric to alert on. The filters are combined by conjunction. | optional |
| metricId | string | The ID of the metric evaluated by the metric event. | optional |
| metricSelector | string | The metric selector that should be executed. | optional |
| monitoringStrategy | MetricEventMonitoringStrategy | A monitoring strategy for a metric event config. This is the base version of the monitoring strategy, depending on the type, the actual JSON may contain additional fields. | required |
| name | string | The name of the metric event displayed in the UI. | required |
| primaryDimensionKey | string | Defines which dimension key should be used for the alertingScope. | optional |
| queryOffset | integer | Defines the query offset to adapt the evaluation timeframe for known metric latency. | optional |
| severity | string | The type of the event to trigger on the threshold violation. The
| optional |
| warningReason | string | The reason of a warning set on the config. The
| optional |
The MetricEventAlertingScope object
A single filter for the alerting scope.
The actual set of fields depends on type of the filter. Find the list of actual objects in the description of the filterType field or see Metric events anomaly detection API - JSON models.
| Element | Type | Description | Required |
|---|---|---|---|
| filterType | string | Defines the actual set of fields depending on the value. See one of the following objects:
| required |
The ConfigurationMetadata object
Metadata useful for debugging
| Element | Type | Description | Required |
|---|---|---|---|
| clusterVersion | string | Dynatrace version. | optional |
| configurationVersions | integer[] | A sorted list of the version numbers of the configuration. | optional |
| currentConfigurationVersions | string[] | A sorted list of version numbers of the configuration. | optional |
The MetricEventDimensions object
A single filter for the metrics dimensions.
The actual set of fields depends on type of the filter. Find the list of actual objects in the description of the filterType field or see Metric events anomaly detection API - JSON models.
| Element | Type | Description | Required |
|---|---|---|---|
| filterType | string | Defines the actual set of fields depending on the value. See one of the following objects:
| required |
| key | string | The dimensions key on the metric. | optional |
The MetricEventMonitoringStrategy object
A monitoring strategy for a metric event config.
This is the base version of the monitoring strategy, depending on the type, the actual JSON may contain additional fields.
| Element | Type | Description | Required |
|---|---|---|---|
| type | string | Defines the actual set of fields depending on the value. See one of the following objects:
| required |
Request body JSON model
This is a model of the request body, showing the possible elements. It has to be adjusted for usage in an actual request.
{"aggregationType": "AVG","alertingScope": [{"entityId": "HOST-000000000001E240","filterType": "ENTITY_ID"},{"filterType": "TAG","tagFilter": {"context": "CONTEXTLESS","key": "someKey","value": "someValue"}}],"description": "This is the description for my metric event.","disabledReason": "NONE","enabled": true,"metadata": {"clusterVersion": "Mock version","configurationVersions": [4,2]},"metricDimensions": [{"filterType": "ENTITY","key": "dt.entity.disk","nameFilter": {"operator": "EQUALS","value": "diskName"}}],"metricId": "com.dynatrace.builtin:host.disk.bytesread","monitoringStrategy": {"alertCondition": "ABOVE","dealertingSamples": 5,"samples": 5,"threshold": 80,"type": "STATIC_THRESHOLD","unit": "KILO_BYTE_PER_SECOND","violatingSamples": 3},"name": "My metric event","severity": "CUSTOM_ALERT","warningReason": "NONE"}
Response
Response codes
| Code | Type | Description |
|---|---|---|
| 201 | EntityShortRepresentation | Success. The new metric event has been created. The response contains the ID of the newly created metric event |
| 204 | - | Success. The metric event has been updated. The response is empty. |
| 400 | ErrorEnvelope | Failed. The input is invalid. |
Response body objects
The EntityShortRepresentation object
The short representation of a Dynatrace entity.
| Element | Type | Description |
|---|---|---|
| description | string | A short description of the Dynatrace entity. |
| id | string | The ID of the Dynatrace entity. |
| name | string | The name of the Dynatrace entity. |
Response body JSON model
{"description": "Dynatrace entity for the REST API example","id": "6a98d7bc-abb9-44f8-ae6a-73e68e71812a","name": "Dynatrace entity"}
Validate payload
We recommend that you validate the payload before submitting it with an actual request. A response code of 204 indicates a valid payload.
The request consumes an application/json payload.
| POST | ManagedDynatrace for Government | https://{your-domain}/e/{your-environment-id}/api/config/v1/anomalyDetection/metricEvents/{id}/validator |
| SaaS | https://{your-environment-id}.live.dynatrace.com/api/config/v1/anomalyDetection/metricEvents/{id}/validator | |
| Environment ActiveGate | https://{your-activegate-domain}:9999/e/{your-environment-id}/api/config/v1/anomalyDetection/metricEvents/{id}/validator |
Authentication
To execute this request, you need an access token with WriteConfig scope.
To learn how to obtain and use it, see Tokens and authentication.
Response
Response codes
| Code | Type | Description |
|---|---|---|
| 204 | - | Validated. The submitted configuration is valid. Response doesn't have a body. |
| 400 | ErrorEnvelope | Failed. The input is invalid. |
Example
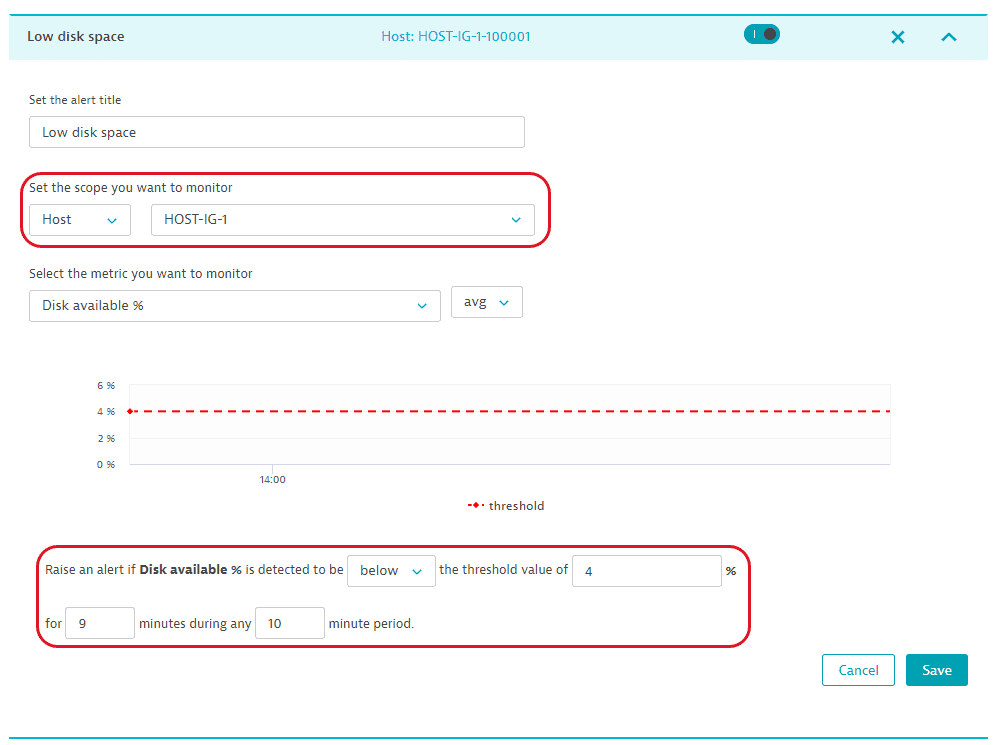
In this example, the request updates the Low disk space rule we created in the POST request example. It changes the threshold to 4% in 9 out of 10 samples. It restricts the scope of the alert to the HOST-IG-1 host, which has the Dynatrace entity ID of HOST-DE7EB04EB33F3040.
The API token is passed in the Authorization header.
You can download or copy the example request body to try it out on your own.
Curl
curl -X PUT \https://mySampleEnv.live.dynatrace.com/api/config/v1/anomalyDetection/metricEvents/1b06b18a-82df-4e18-a4aa-d4543b227734 \-H 'Authorization: Api-Token dt0c01.abc123.abcdefjhij1234567890' \-H 'Content-Type: application/json' \-d '{"metricId": "com.dynatrace.builtin:host.disk.freespacepercentage","name": "Low disk space","description": "The available disk space is below 4%","aggregationType": "AVG","eventType": "CUSTOM_ALERT","alertCondition": "BELOW","samples": 10,"violatingSamples": 9,"dealertingSamples": 10,"threshold": 4,"entity": "HOST-DE7EB04EB33F3040","enabled": true,"tagFilters": []}'
Request URL
https://mySampleEnv.live.dynatrace.com/api/config/v1/anomalyDetection/metricEvents/1b06b18a-82df-4e18-a4aa-d4543b227734
Request body
{"metricId": "com.dynatrace.builtin:host.disk.freespacepercentage","name": "Low disk space","description": "The available disk space is below 4%","aggregationType": "AVG","eventType": "CUSTOM_ALERT","alertCondition": "BELOW","samples": 10,"violatingSamples": 9,"dealertingSamples": 10,"threshold": 4,"entity": "HOST-DE7EB04EB33F3040","enabled": true,"tagFilters": []}
Response code
204
Result
The updated configuration has the following parameters: