Top web requests
The highly flexible Top web requests view enables you to analyze the top web requests across all your services and to look for requests that originate from or are destined to specific URLs. This view is easily configurable and serves as a convenient entry point for in-depth analysis of your services.
To access the Top web requests analysis page
- Go to Multidimensional Analysis.
- Click the Top web requests tile.
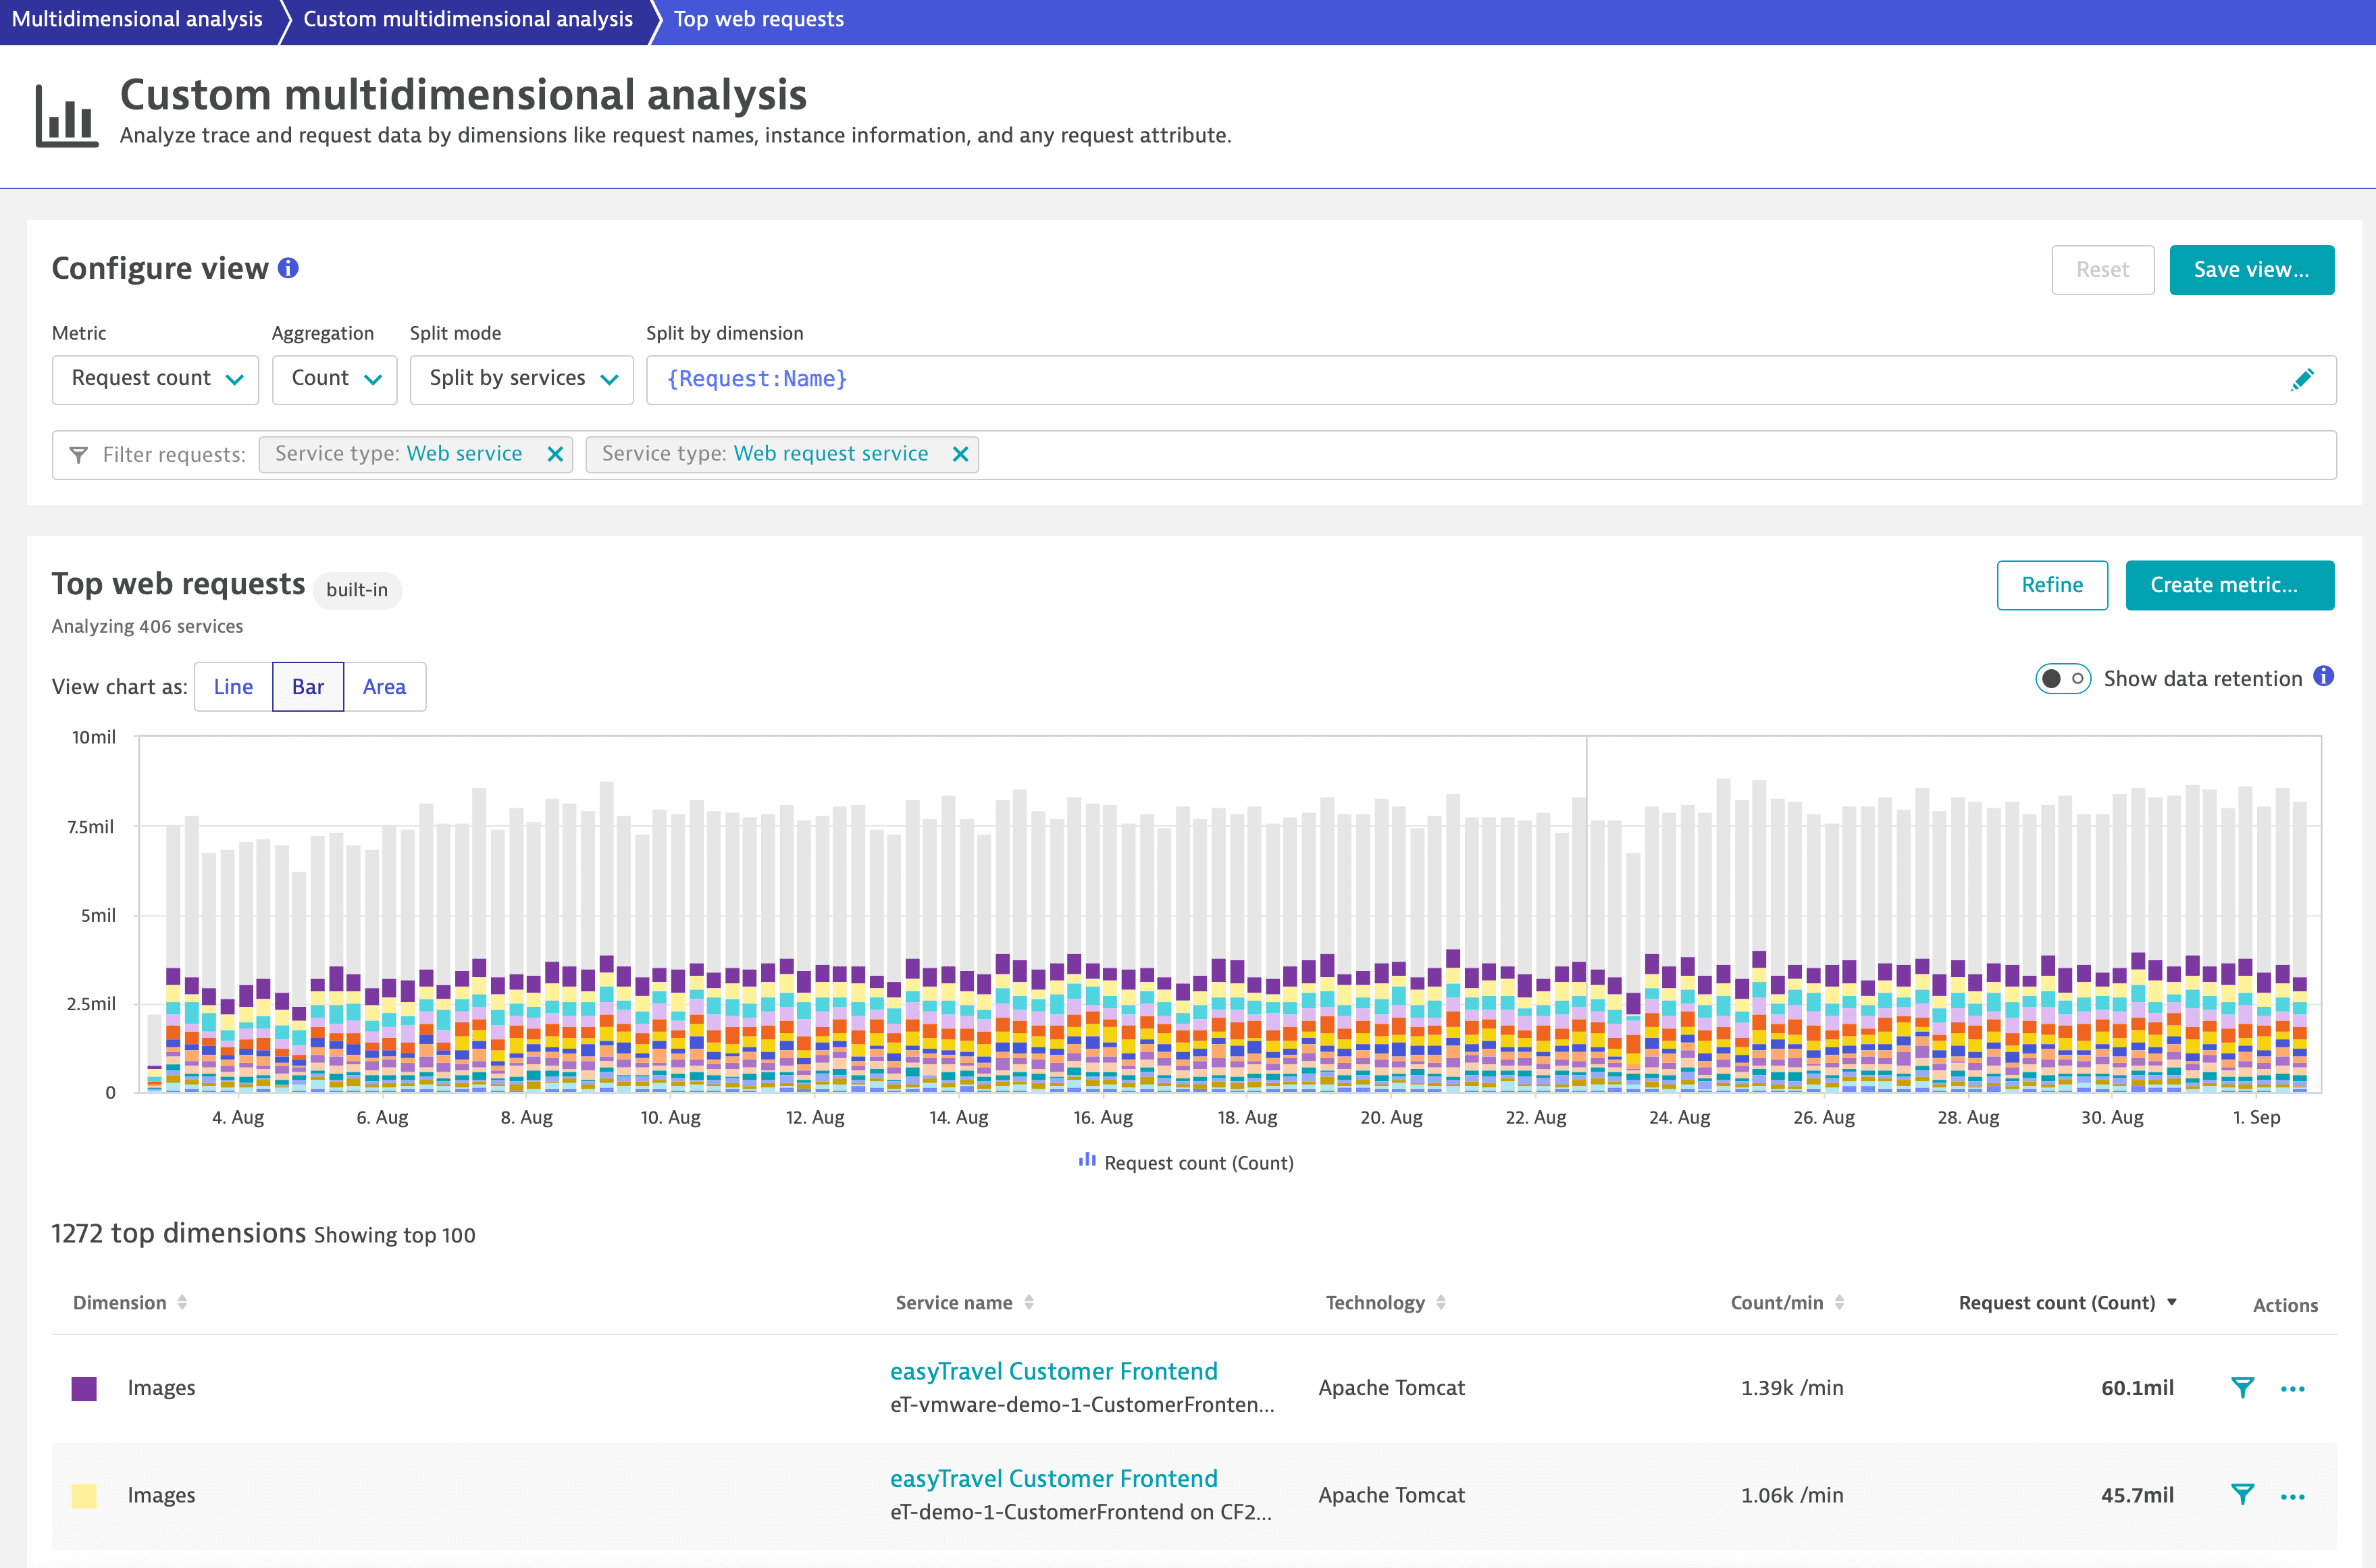
Configure view
The Top web requests page lists all web requests that occurred during the selected timeframe and within the selected management zone. In Configure view, you can set up multiple filtering capabilities. The view updates automatically as you change the parameters.
| Parameter | Description |
|---|---|
Metric | The metric to be analyzed—set by default to Request count. |
Aggregation | How the metric values are aggregated—available aggregations depend on the selected metric. |
Split mode | How dimensions specified in Split by dimension are treated.
|
Split by dimension | A list of dimensions by which the requests are split. By default the request name ( You can specify several dimensions. Place your cursor in the input field to see the available options. The requests are split by dimension in the specified order. |
Filter requests | Filter the requests to be included to the view. By default the following criteria are set:
You can provide additional criteria. Place your cursor in the input field to see the available options. Criteria of the same type are grouped by the OR logic. Criteria of different types are grouped by the AND logic. |
Once the view is configured, you can save it for quick access in the future. Just select Save view and provide a name.
You can also save the configuration as a calculated service metric and use it as any other metric in Dynatrace (for example, for alerting).
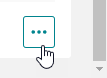
You can export the table data in a comma-separated values (CSV) file.
-
In the lower-right corner of the page, select Show export menu
 .
.
-
Select Export visible data or Export table data.
Option Exported data Fields Number of entries Export visible data
The currently displayed area of the table, taking into account applied filters
Only visible data
Up to 100 top dimensions
Export table data
All table data
All the available data related to top dimensions
Up to 100 top dimensions
View
-
The chart on the Top web requests page shows the top 15 dimensions (all other dimensions are aggregated into a single dimension), and the table beneath contains up to 85 more dimensions, bringing the total number of chartable dimensions to 100. The view instantly adapts to the changes you make in the Configure view pane.
-
The chart uses trace and request data, which has different data retention periods. For timeframes containing data older than 10 days, you can turn on the Show data retention toggle to better understand which data is available for which period directly from the chart.
-
In the Actions column of the table, you can select:
- Filter
 to filter the view for the specified dimension.
 - More (…) to access further analysis options from the Analyze menu.
- Filter
Example use cases
Here you can find some use cases for the Top web requests view.
Find a particular URL
With Top web request view you can focus your analysis on requests that come from or are going to a particular URL.
- Specify
{URL:Host}{Relative-URL}in the Split by dimension field to split your requests based on URLs. - Now filter the requests to a particular URL. In the Filter requests field, select the
Web request URLfilter type and provide the pattern for the URL. Note that this filter uses the CONTAINS operator.
Find requests with error response codes
You can easily narrow down your requests to those that returned an error response code (that is, any error code in the range 4xx). After you configure the dimensions that you're interested in, place your cursor into the Filter requests field and select the HTTP response code filter type (you can start typing to narrow down the suggestions). Then select the 4xx criteria and wait for data processing to complete.
Find POST HTTP requests
You have two options for viewing your POST (or any other HTTP method) at a glance: (1) set the HTTP method dimension or (2) filter the request by HTTP method.
Dimension
In this case you'll see all your requests grouped by HTTP method and by any other dimension you provide. Just specify {HTTP-Method} in the Split by dimension field.
Filter
In this case, all non-POST requests are filtered out, so you can focus your analysis. Just specify the HTTP method and select POST value in the Filter requests field.