Analyze database services (classic page)
Starting with Dynatrace 1.269, we have totally redesigned the database overview page.
- To switch to the new database overview page, just turn on Try it out at the top of the database overview page. You can switch back to the classic design if you decide that you prefer it.
The documentation below describes the classic design.
Dynatrace monitors the response time, failure rate, throughput, and more of every database statement executed by your applications.
To analyze the performance of a database
- Go to Database Services or Database Services Classic (latest Dynatrace).
To access a database service overview page, select the database you want to analyze.
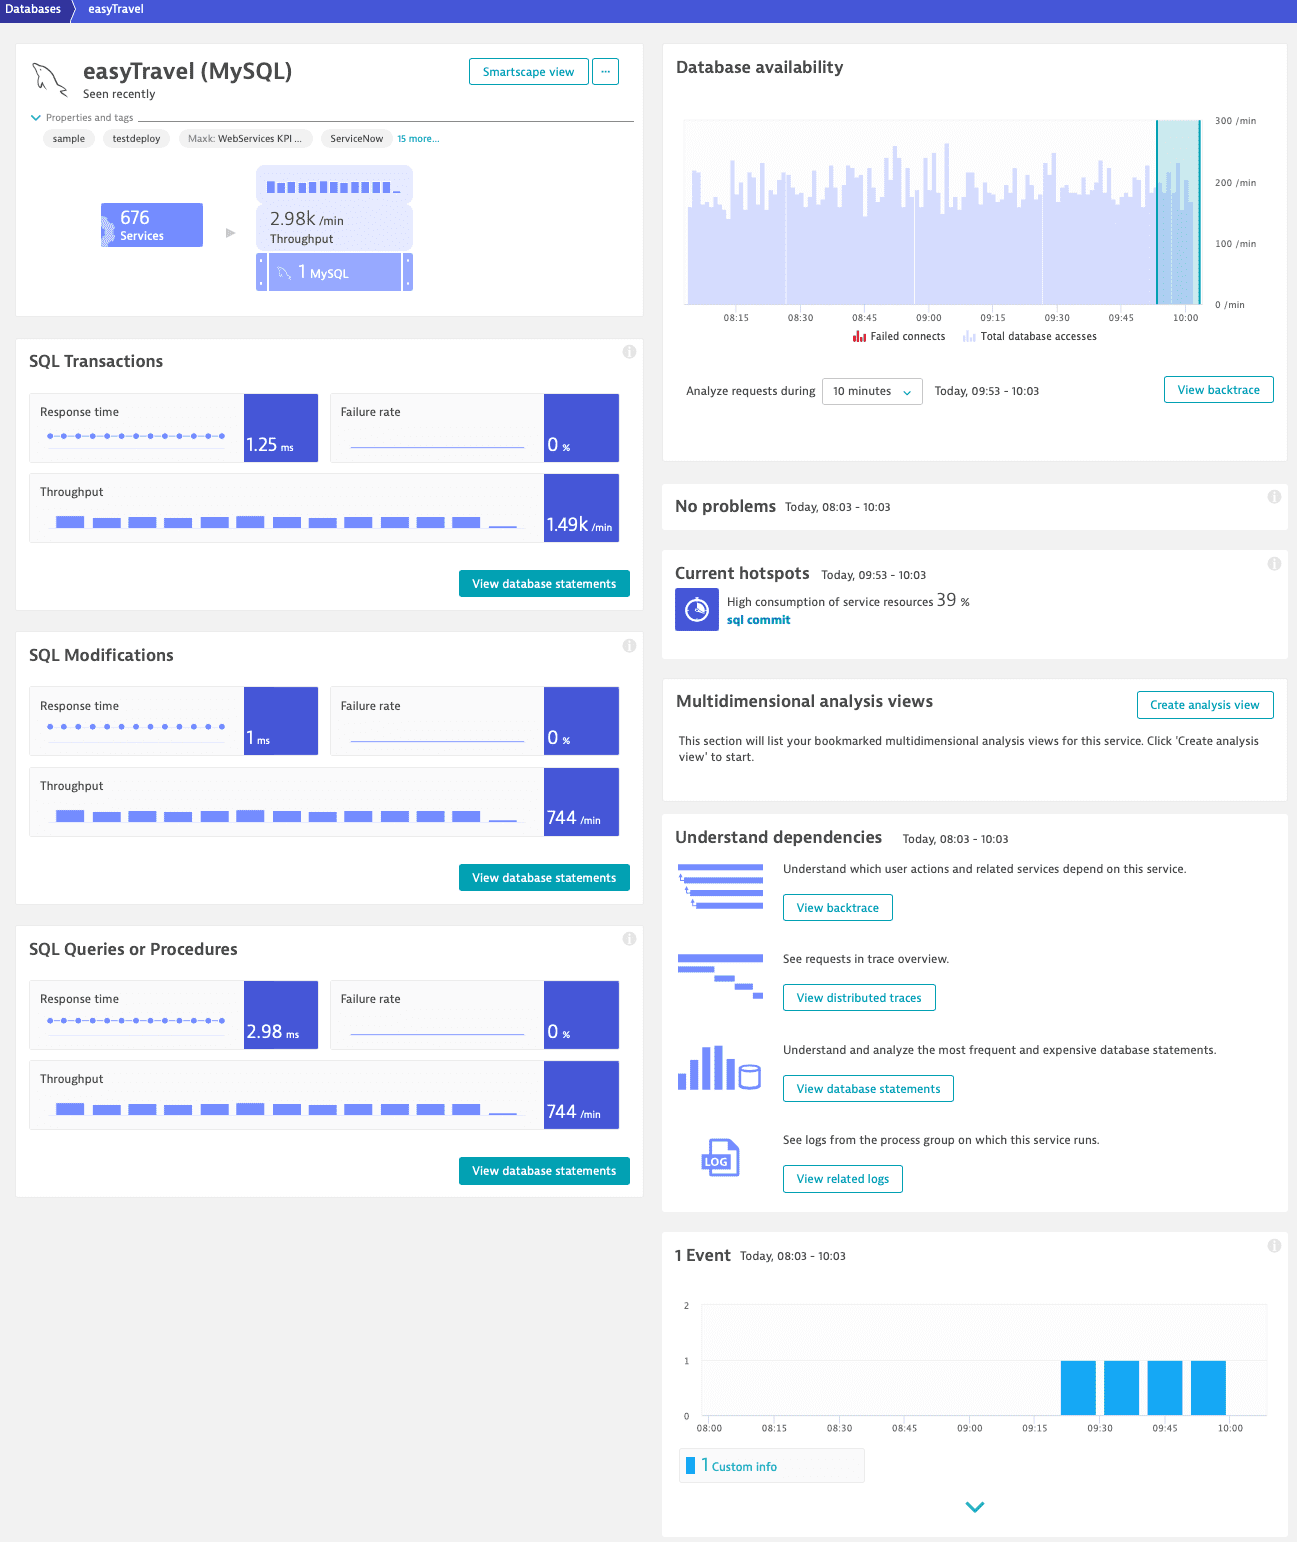
The infographics on the database service overview page provide insight into various aspects of database performance, including SQL queries or procedures, SQL modifications, SQL transactions, any detected problems or availability issues, hotspots, and more. The exact list of included tiles depends on the database technology you're monitoring. Each tile contains Response time, Failure rate, and Throughput metrics.
To analyze the individual statements that contribute to a database statement, in the database overview page, select View database statements.
Database details
At the bottom of the Details page, you can find a list of all the Database statements executed during the selected timeframe. By default, they are sorted by median response time, but you can sort the list by total time, response time, or slowest 10%, and filter it by statement, database name, vendor, process, or hostname.
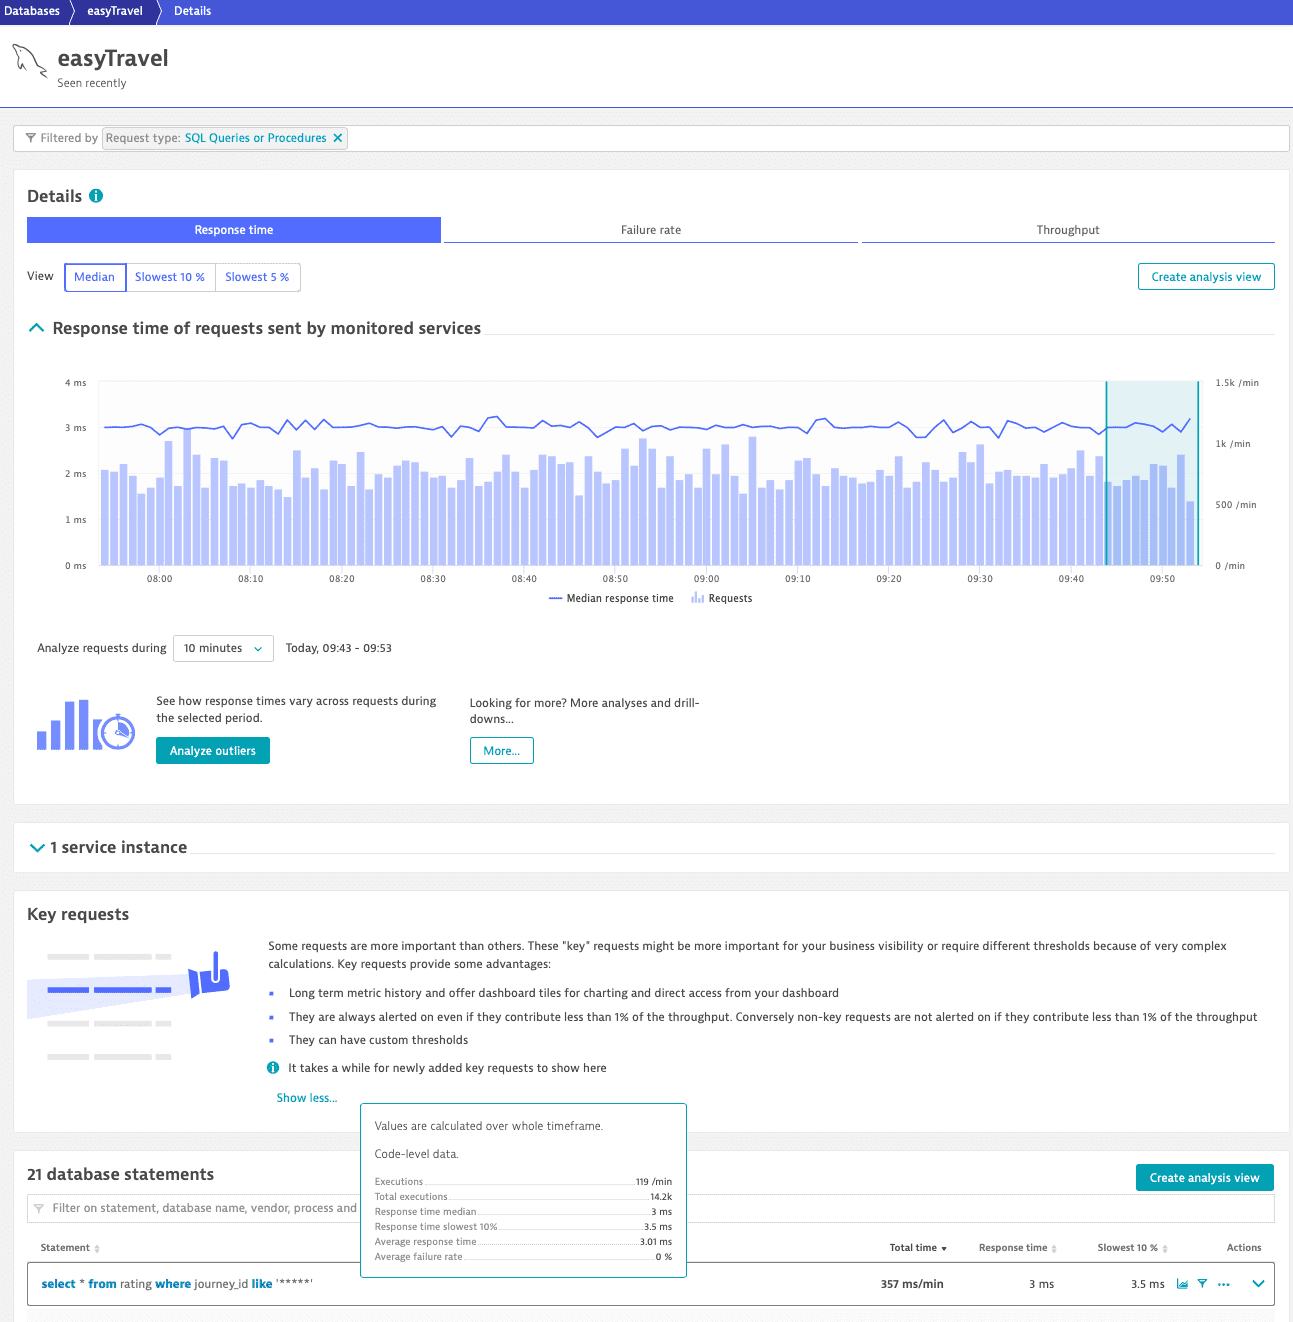
Select any statement to view its full details. For each statement, Dynatrace shows the number of Executions/min, Total executions, Total time, Response time median and slowest 10% of executions, and Failure rate.
By default, the length of database statements is limited to 4KB (KiloBytes). This setting isn't configurable. Database statements that exceed this limit are trimmed to 4KB.
Database service backtrace
To access backtrace analysis for a certain statement
In the database statements list, go to the row of the statement you want to analyze.
- Select More (…) > Service backtrace.
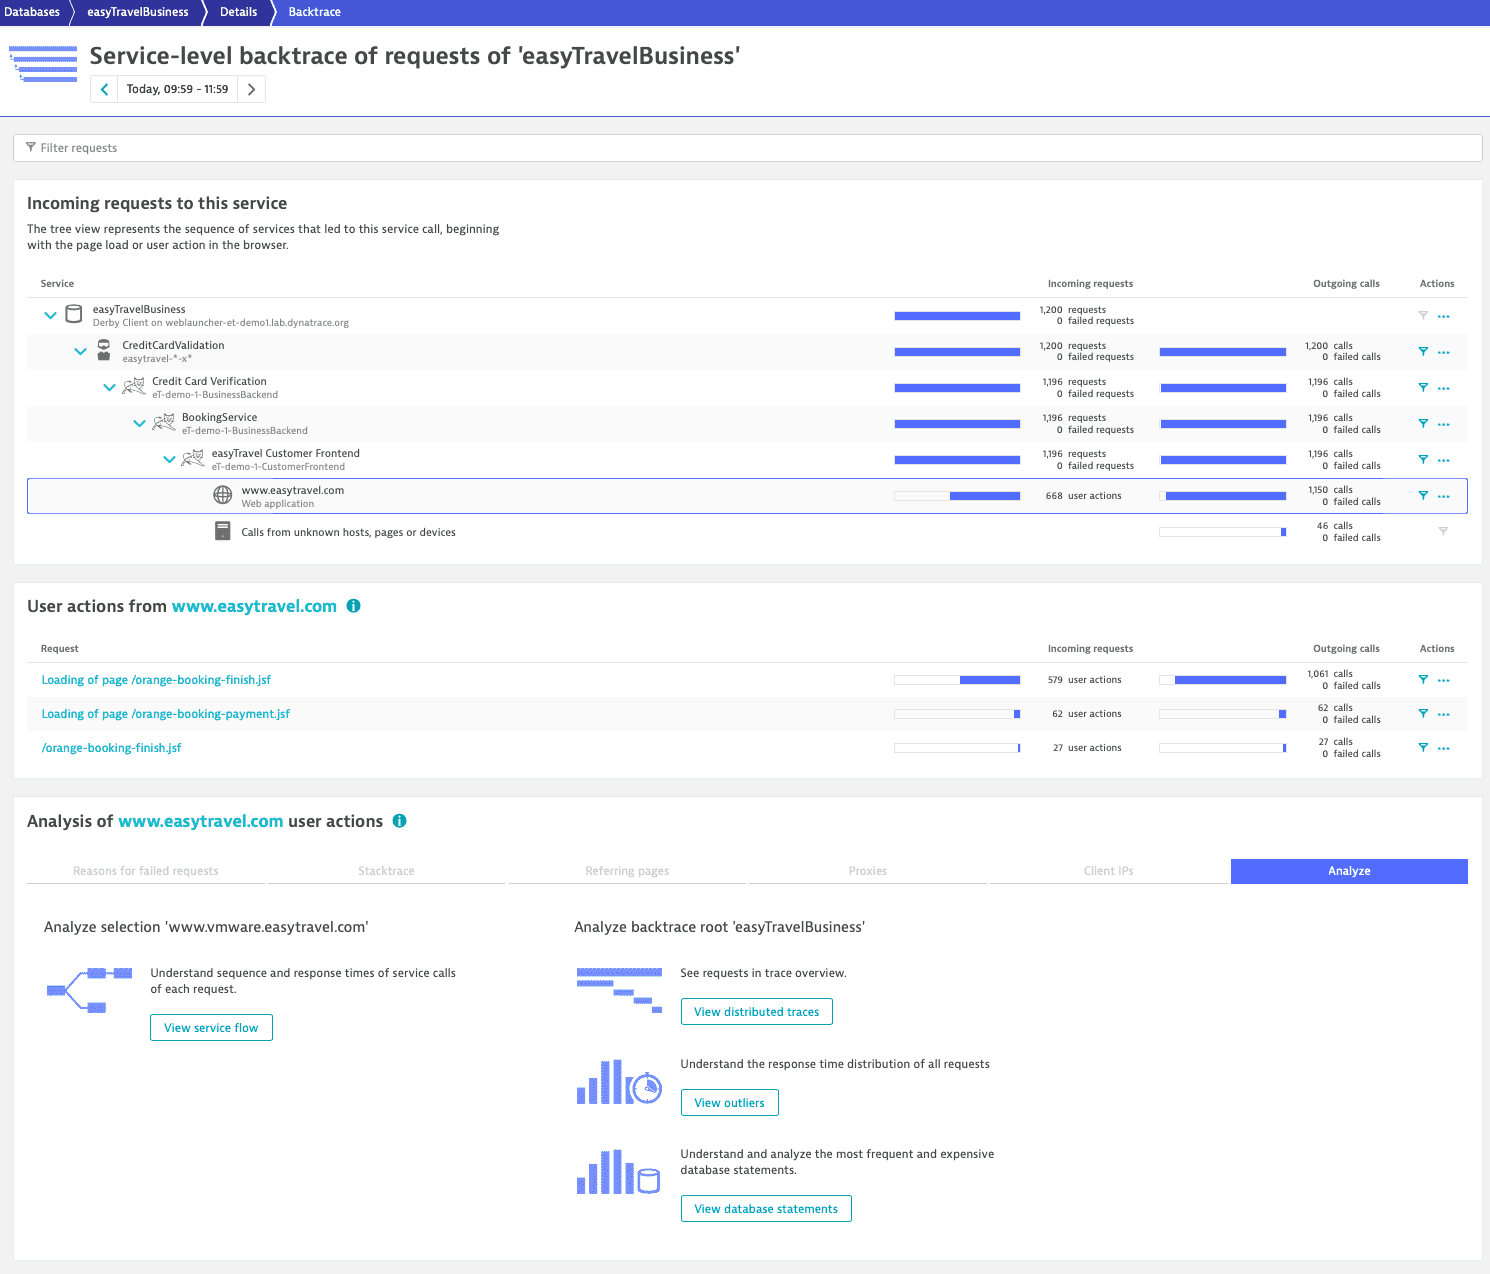
The Backtrace page provides details on the clicks that triggered the selected permutation of the SQL statement, and it allows you to see which chain of services and which code leads to a particular statement. By selecting a specific application in the backtrace, you can find all the user actions from this application that trigger the database statement you're analyzing.
In the image above, you can see in the Incoming requests column that 1,200 database requests on easyTravelBusiness originate from 668 user actions.
By selecting www.easyTravelBusiness.com, the row indicating that 668 user actions led to 1,150 requests on easyTravel Customer Frontend is highlighted. With this selection, you see that three different user actions from www.easytravel.com trigger this statement. You can also see the chain of services that trigger it. To investigate further increments of the number of requests in the chain, select any of the subsequent statements in the service call chain.
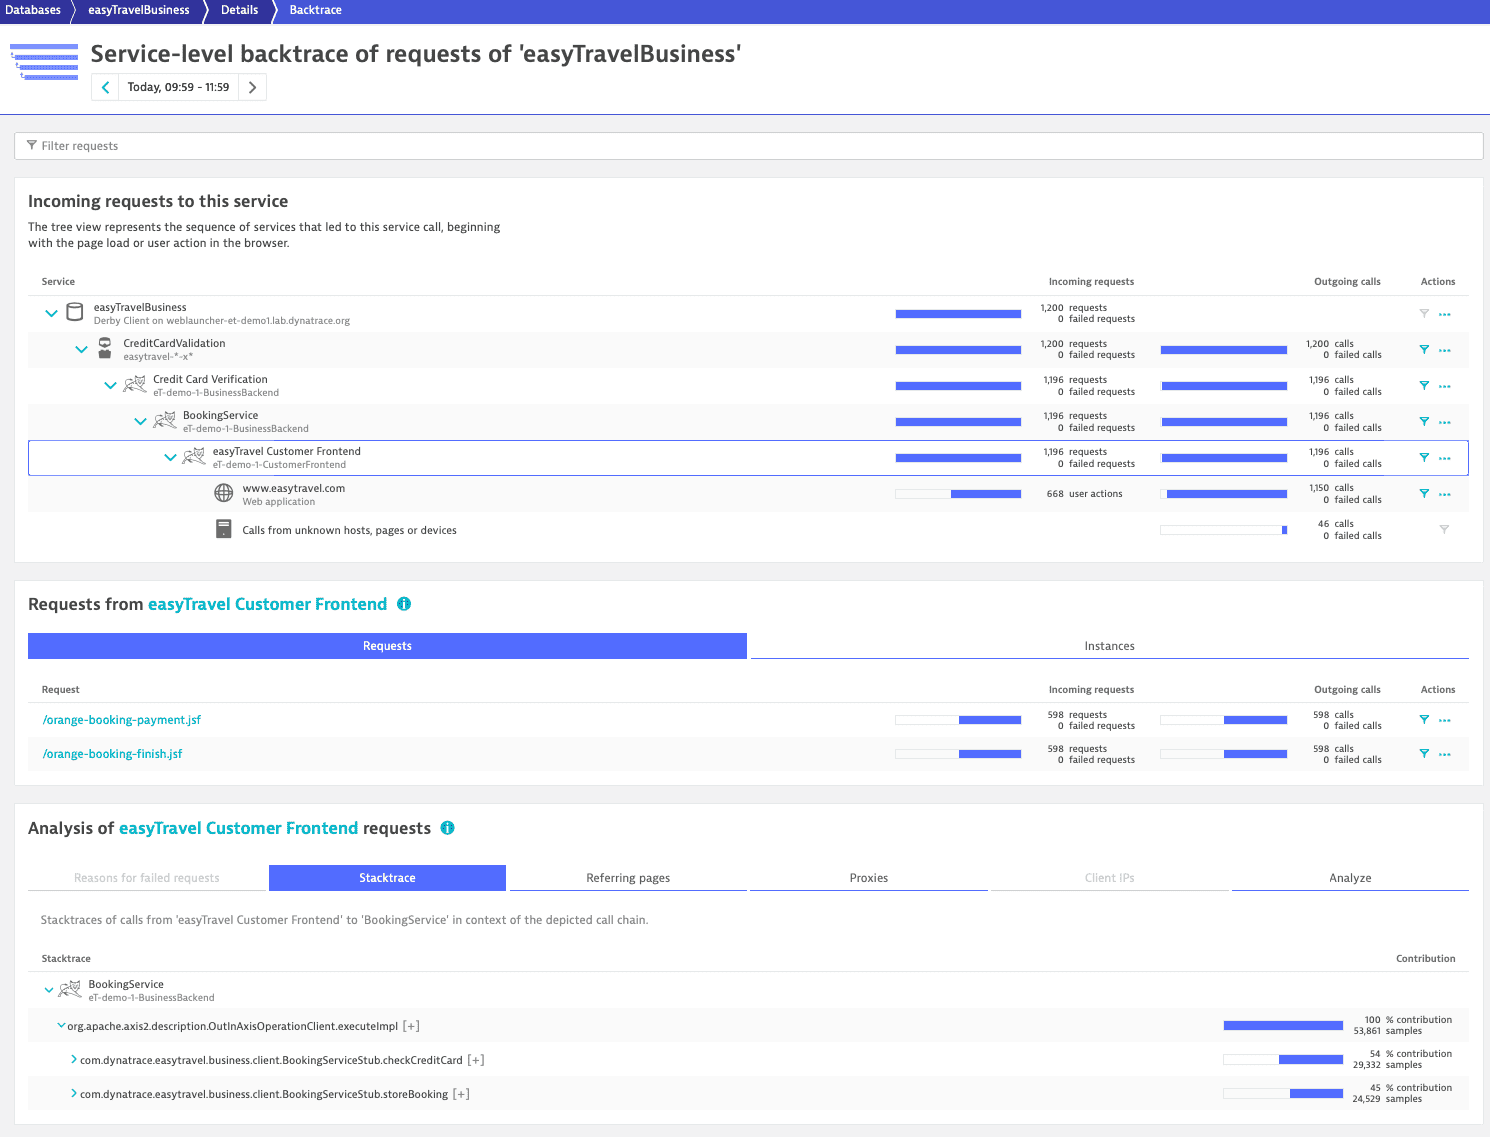
With a new selection (easyTravel Customer Frontend in the image above), the lower section of the service backtrace page adapts, and you now see that the 668 user actions from www.easyTravelBusiness.com call two requests on easyTravel Customer Frontend (/orange-booking-payment.jsf and /orange-booking-finish.jsf). If some of these requests have failed, you can analyze them in the corresponding tab, Reasons for failed requests. In this example, we're more interested in the code that leads to the database calls, so we select the Stacktrace tab to view the executed code in context.
Response time distribution
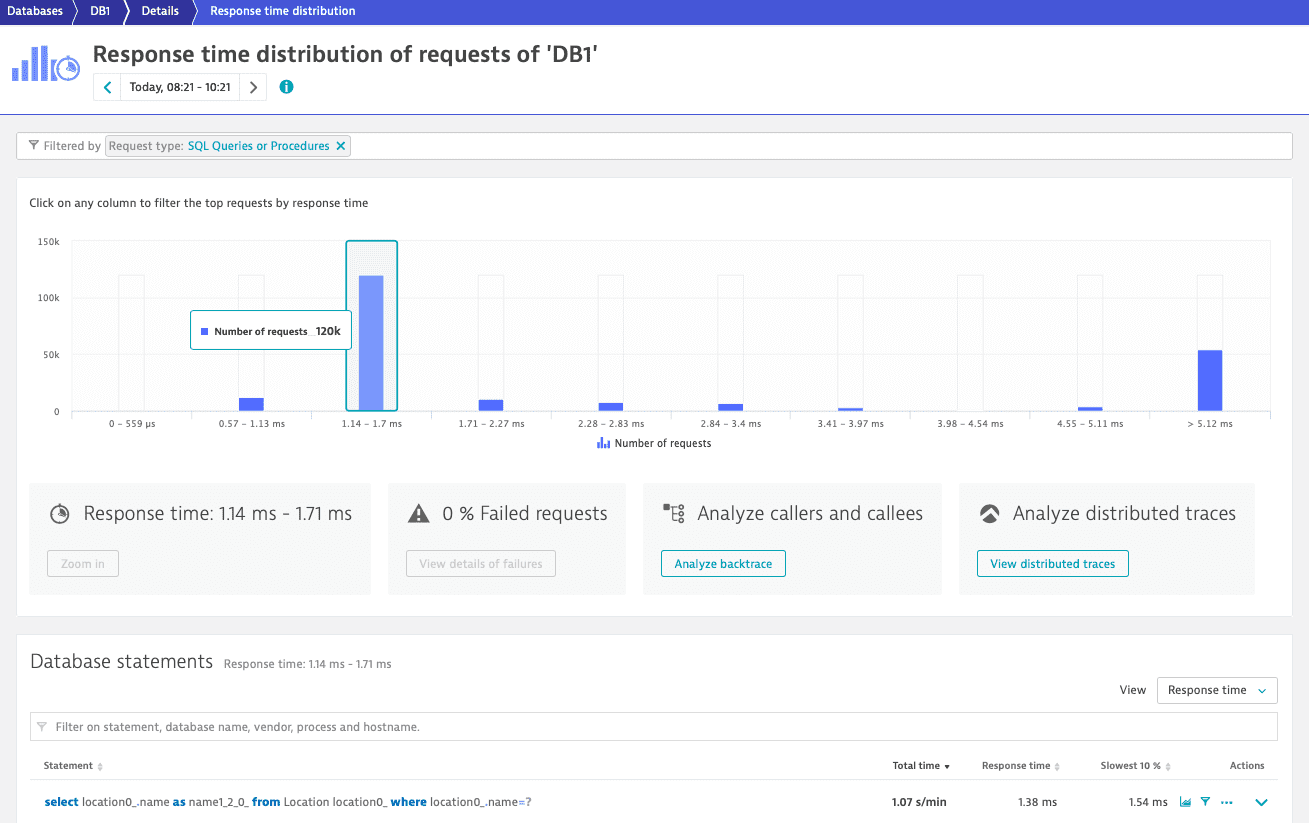
To understand the response time distribution of the command, select Analyze outliers on the Details page.
The Response time distribution page shows the number of requests that fell within various response time ranges. Select any column in the chart to analyze the requests that fell within that specific response time range. This enables you to see if certain statements are called frequently and contribute relatively significantly to the response time.
Analyze performance degradation
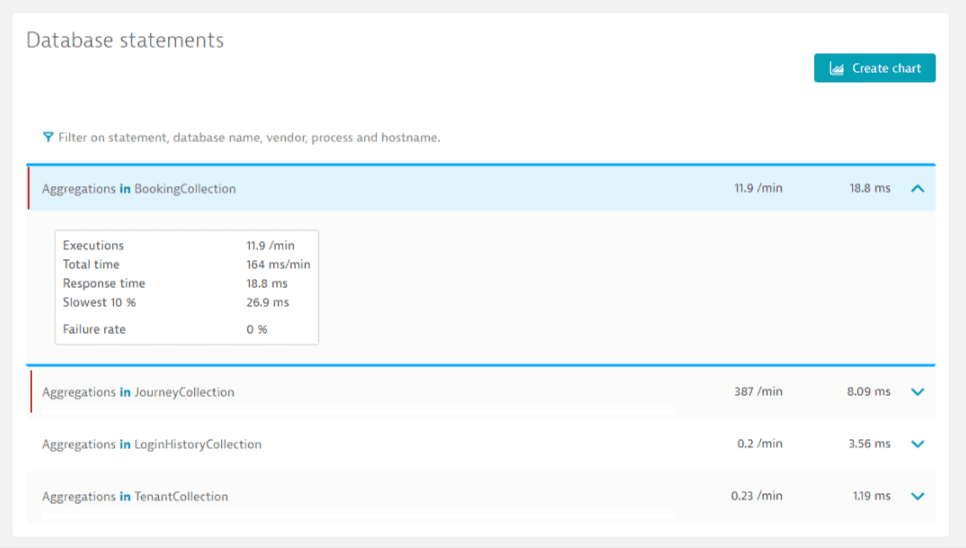
With Dynatrace database monitoring, you can analyze performance degradation. The statements responsible for a detected slowdown are highlighted in the list of statements at the bottom of the Details page.
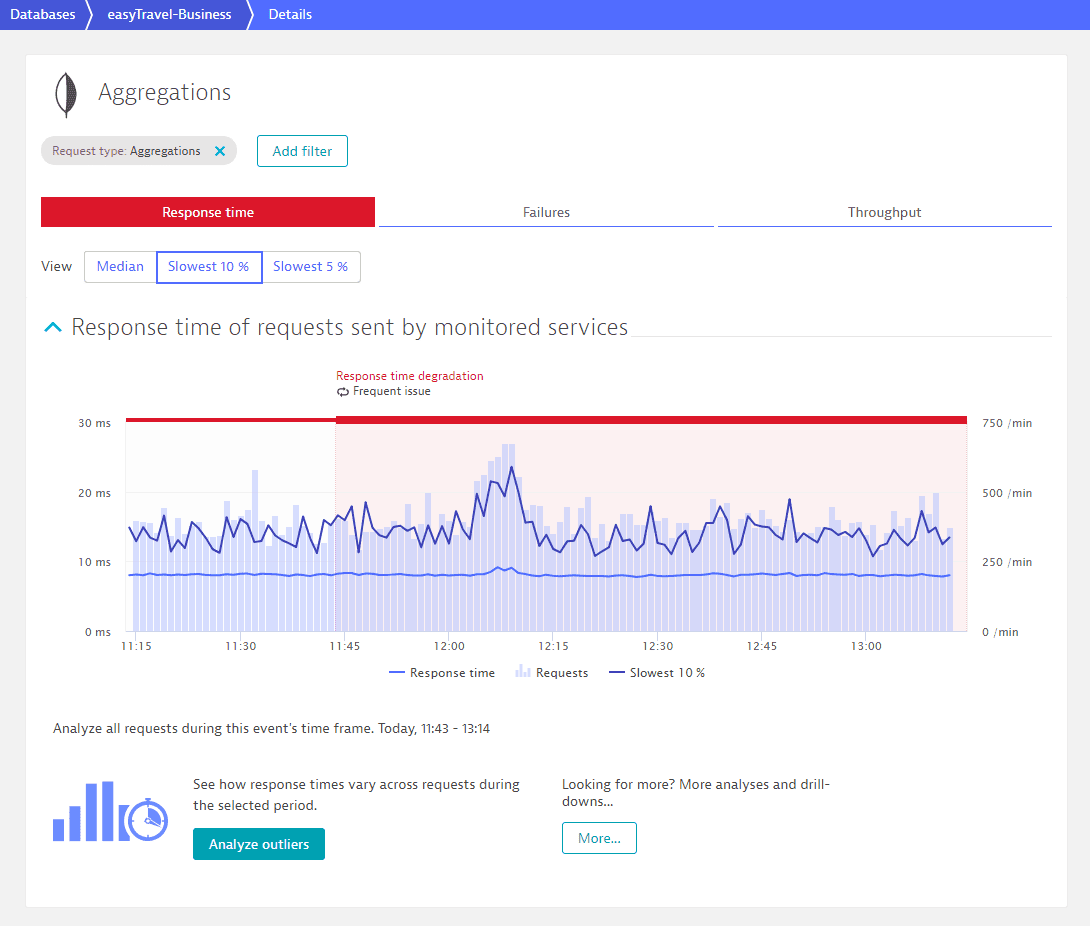
In the example below, the detected response time degradation was caused by two statements (Aggregations in BookingCollection and Aggregations in JourneyCollection).
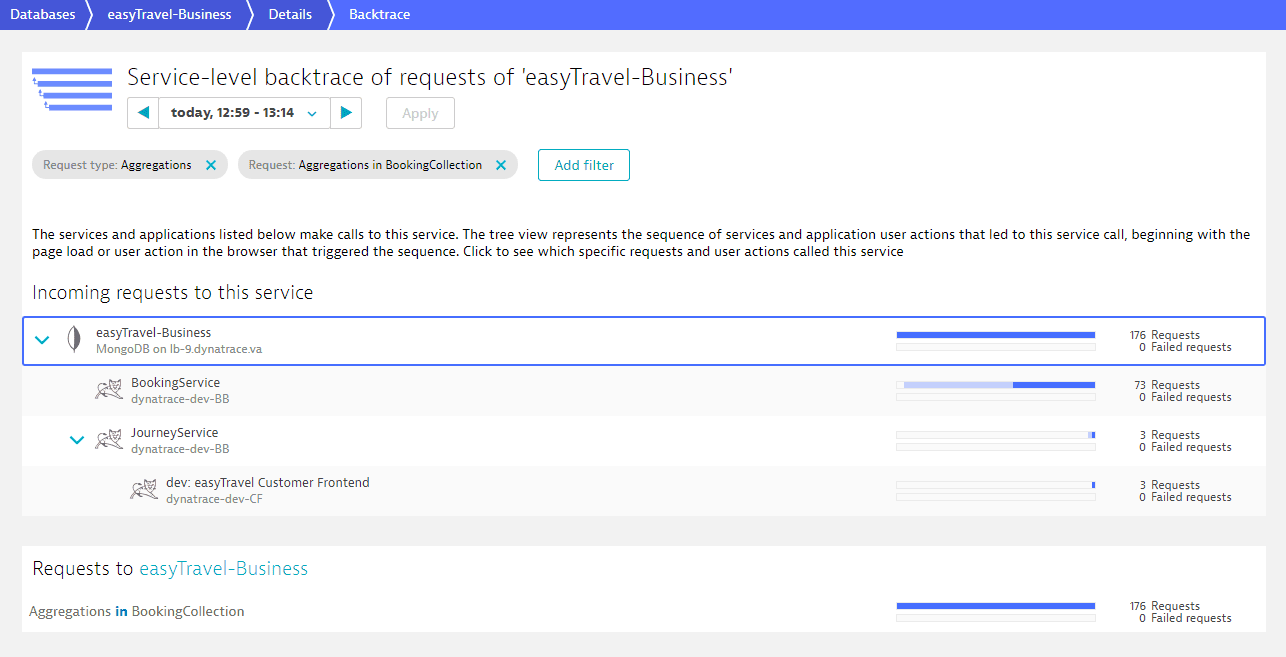
To see which service executed a specific statement that led to a database slowdown, go to the statement backtrace.
Here, easyTravel-Business is the service executing the statement causing the slowdown.
Analyze database errors
Each tile on the database service overview page features a Failure rate graph (1).
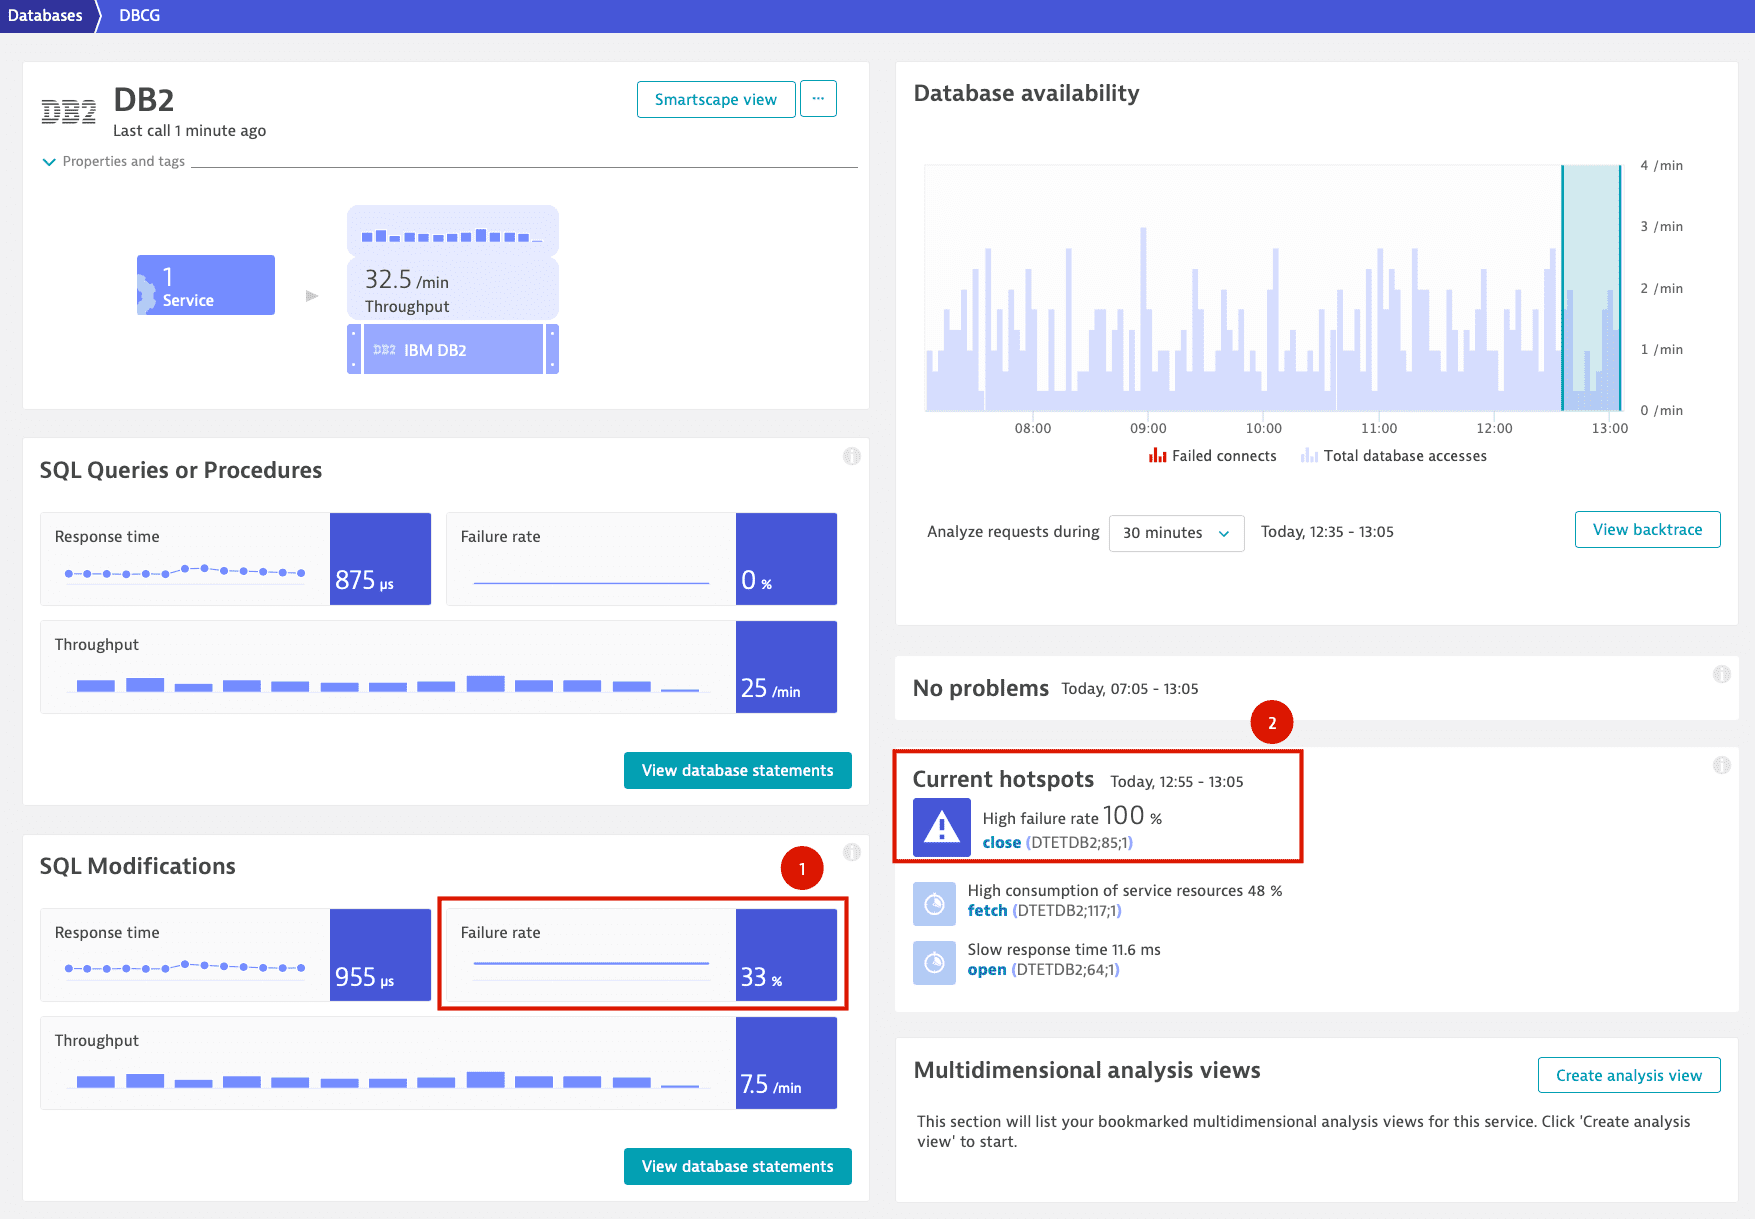
Select the Failure rate graph (1) to open the failures tab on the Details page.
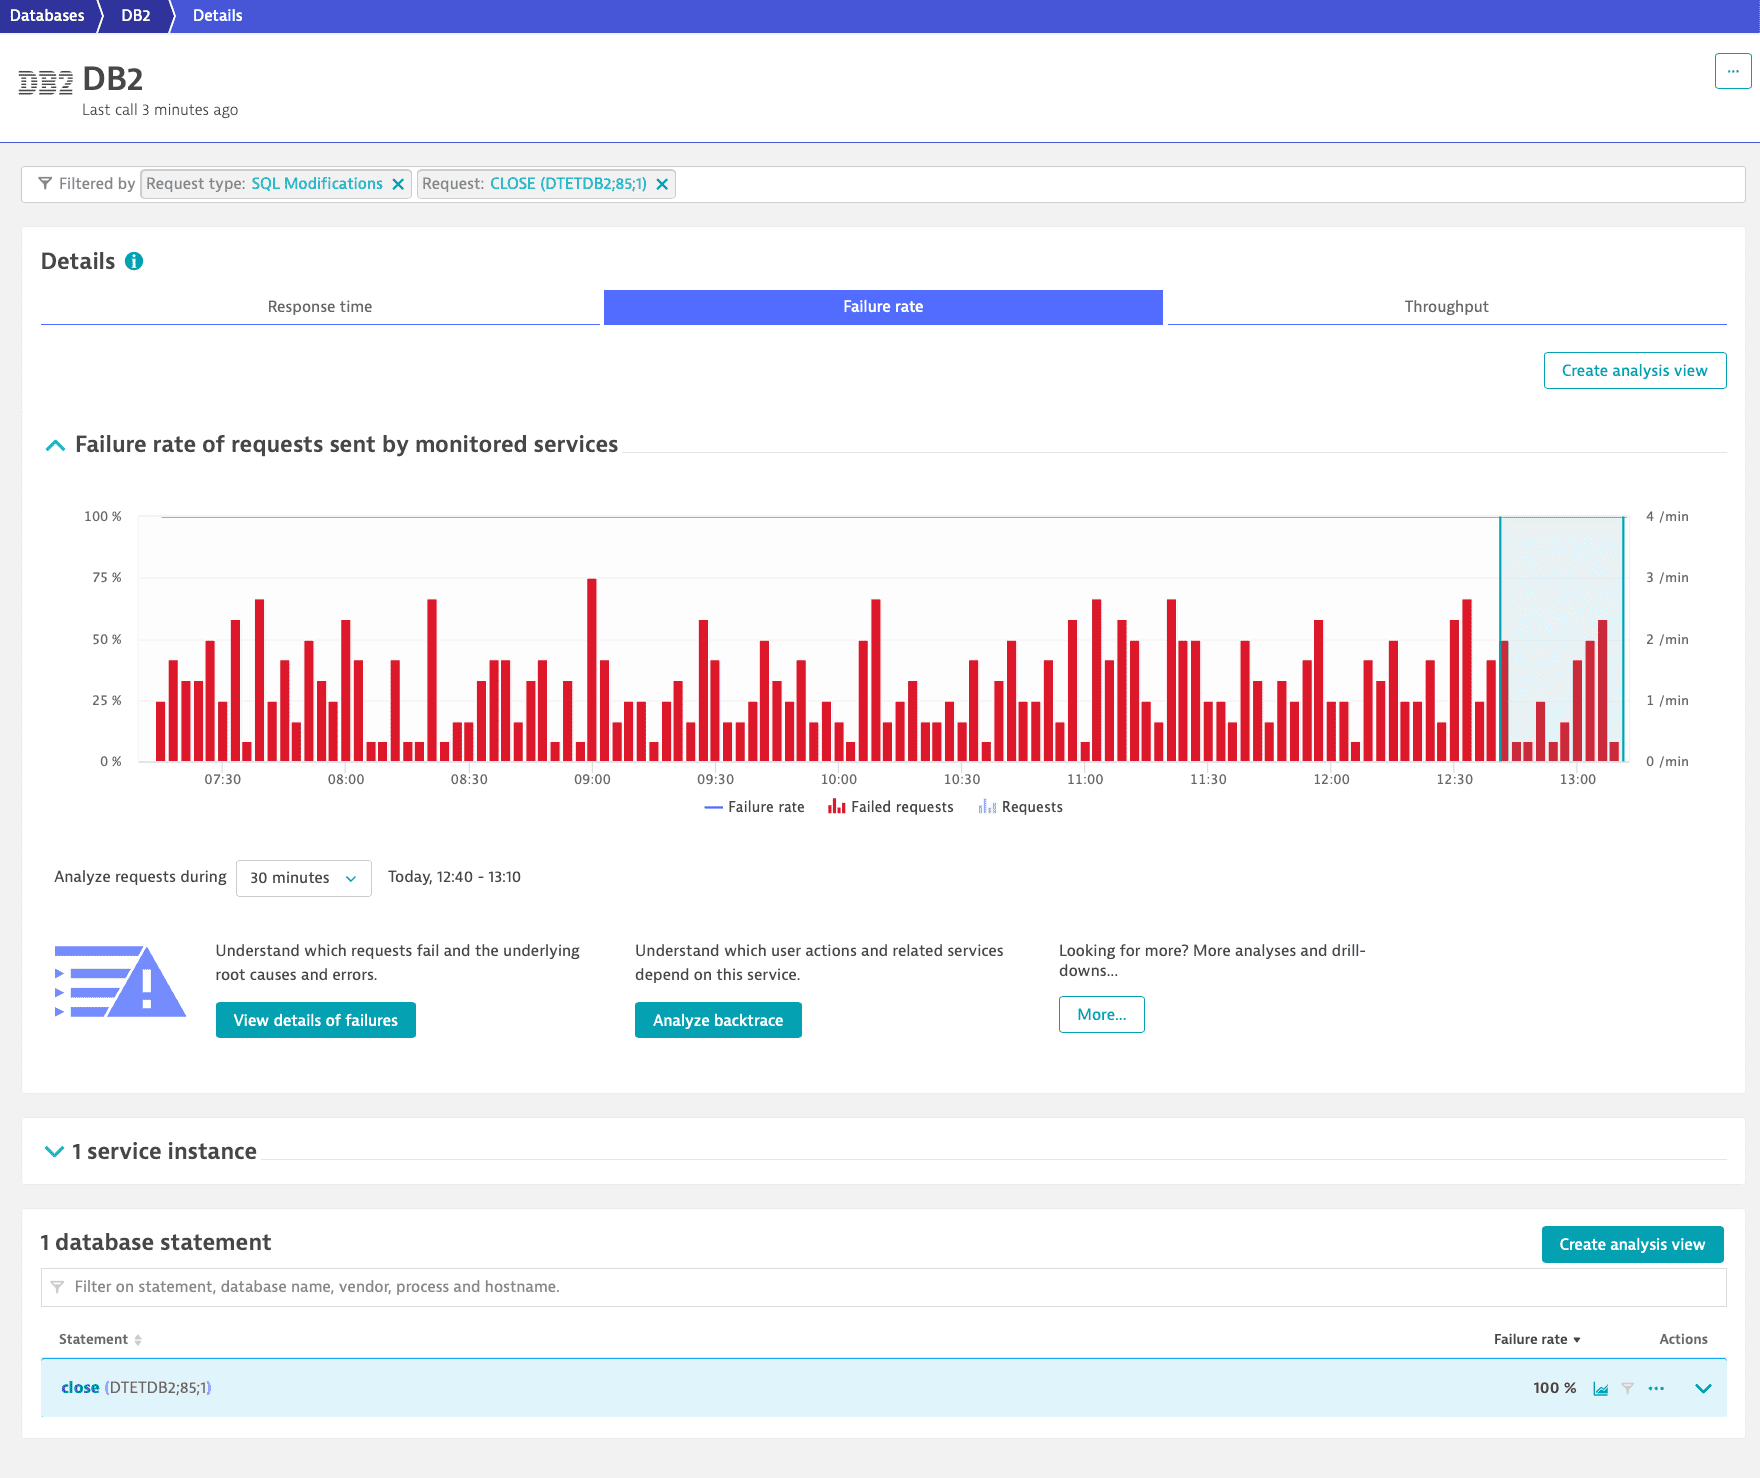
The failed database statements table at the bottom of the page immediately shows which statements failed along with their failure rates.
-
Select View details of failures to understand the root cause of the failures.
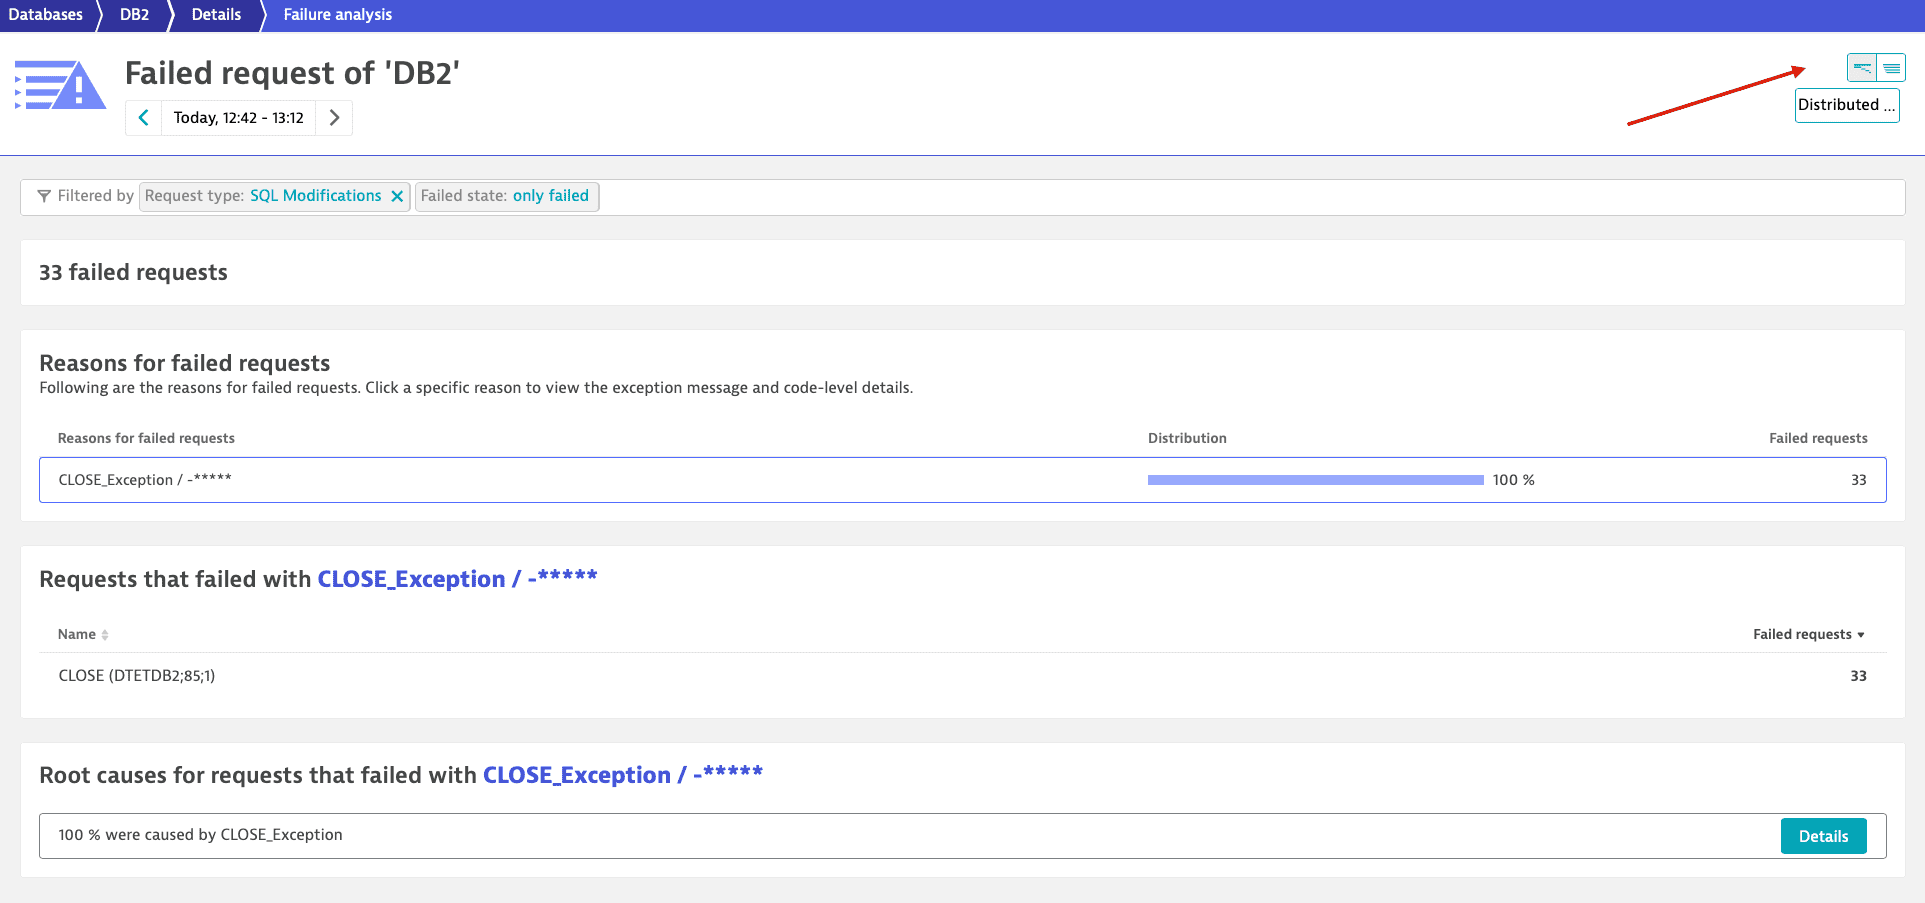
Dynatrace determines the causes of the high failure rate, giving you the information to resolve database issues and eliminate future errors.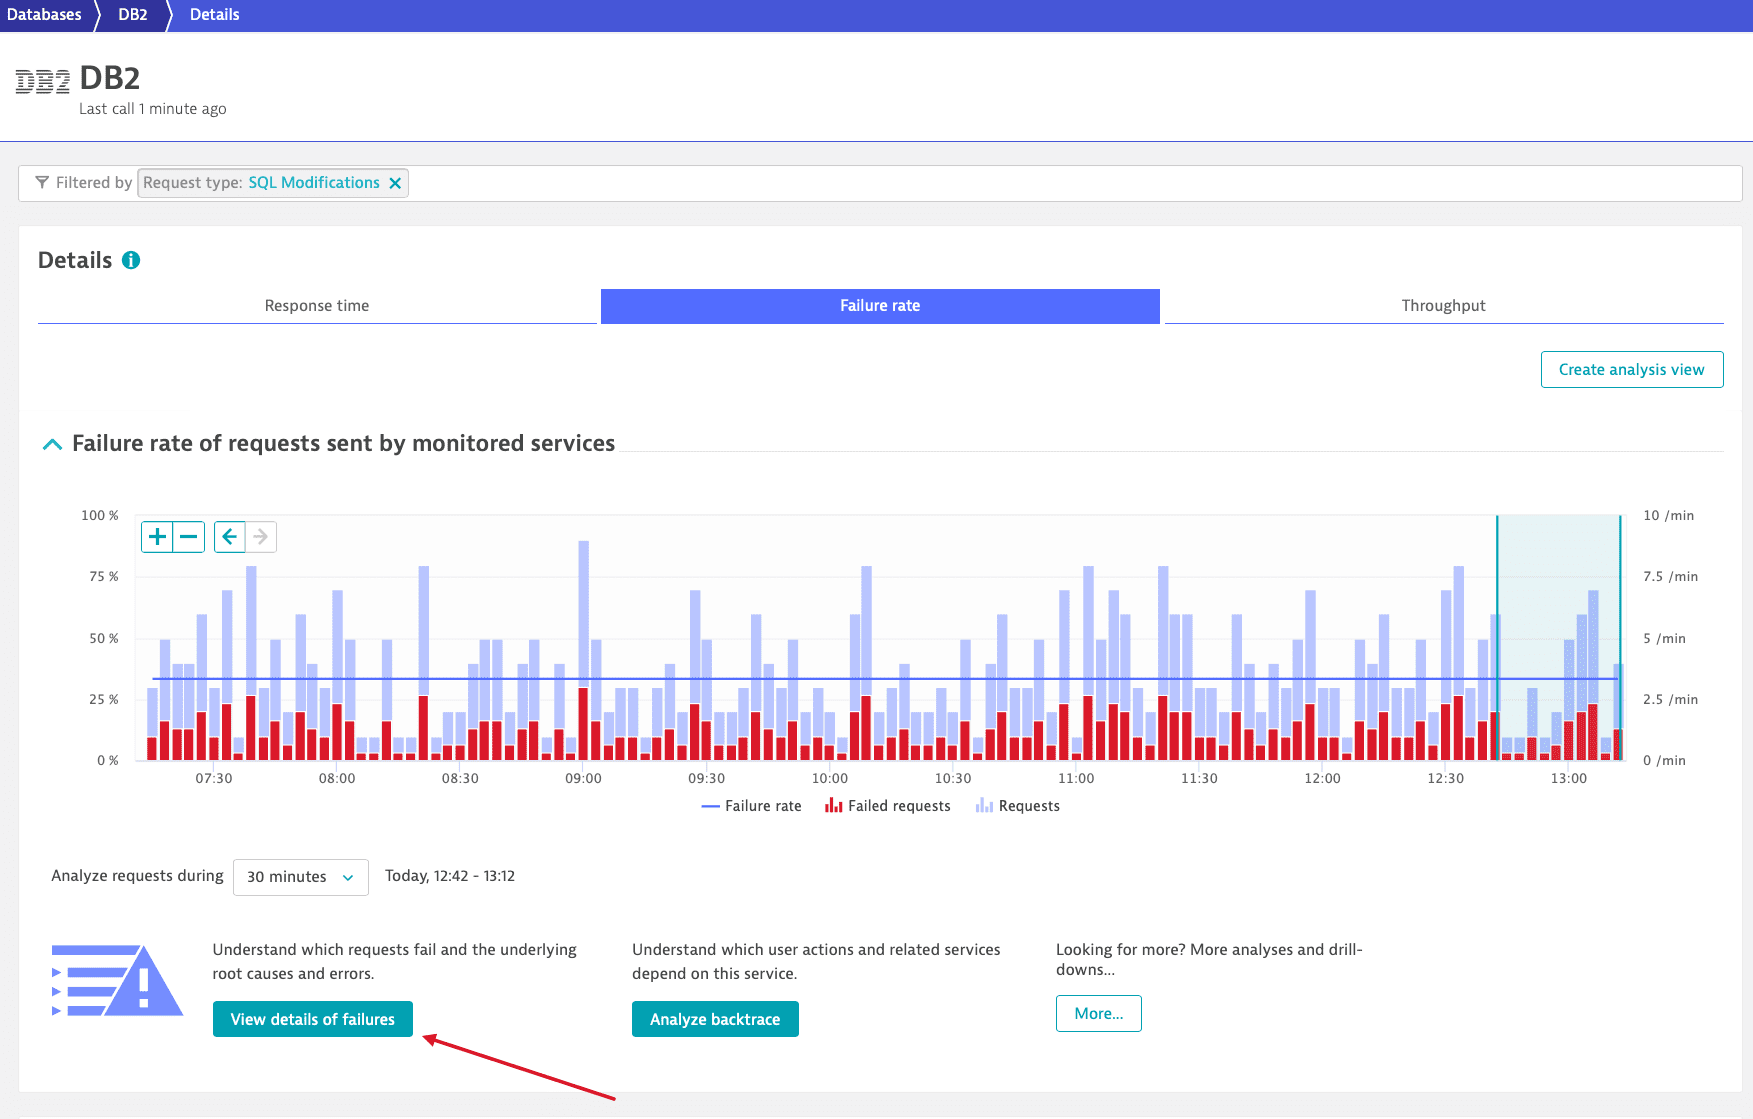
-
To further analyze the issue, select Distributed traces
 or Backtrace
  .
.
Quick problem overview
On the database service overview page, the Current hotspots section (2) offers a quick view of the problem, highlighting the statement with the highest failure rate. By selecting a statement in this section (2) you can directly view the failures tab on its Details page.
Service flow for SQL analysis
Service flow visualizes the sequence of service calls that are triggered by each service request in your environment. With the service flow, you see the flow of service calls, including database-service calls, from the perspective of a single service, request, or their filtered subset. While SQL analysis is available at multiple locations in the service-analysis workflow, it's the primary analysis view for databases in the Service flow view.
To view the service flow triggered by a specific database service
- Go to Services.
Select the service you want to analyze.
- On the service overview page, under Understand dependencies, select View service flow.
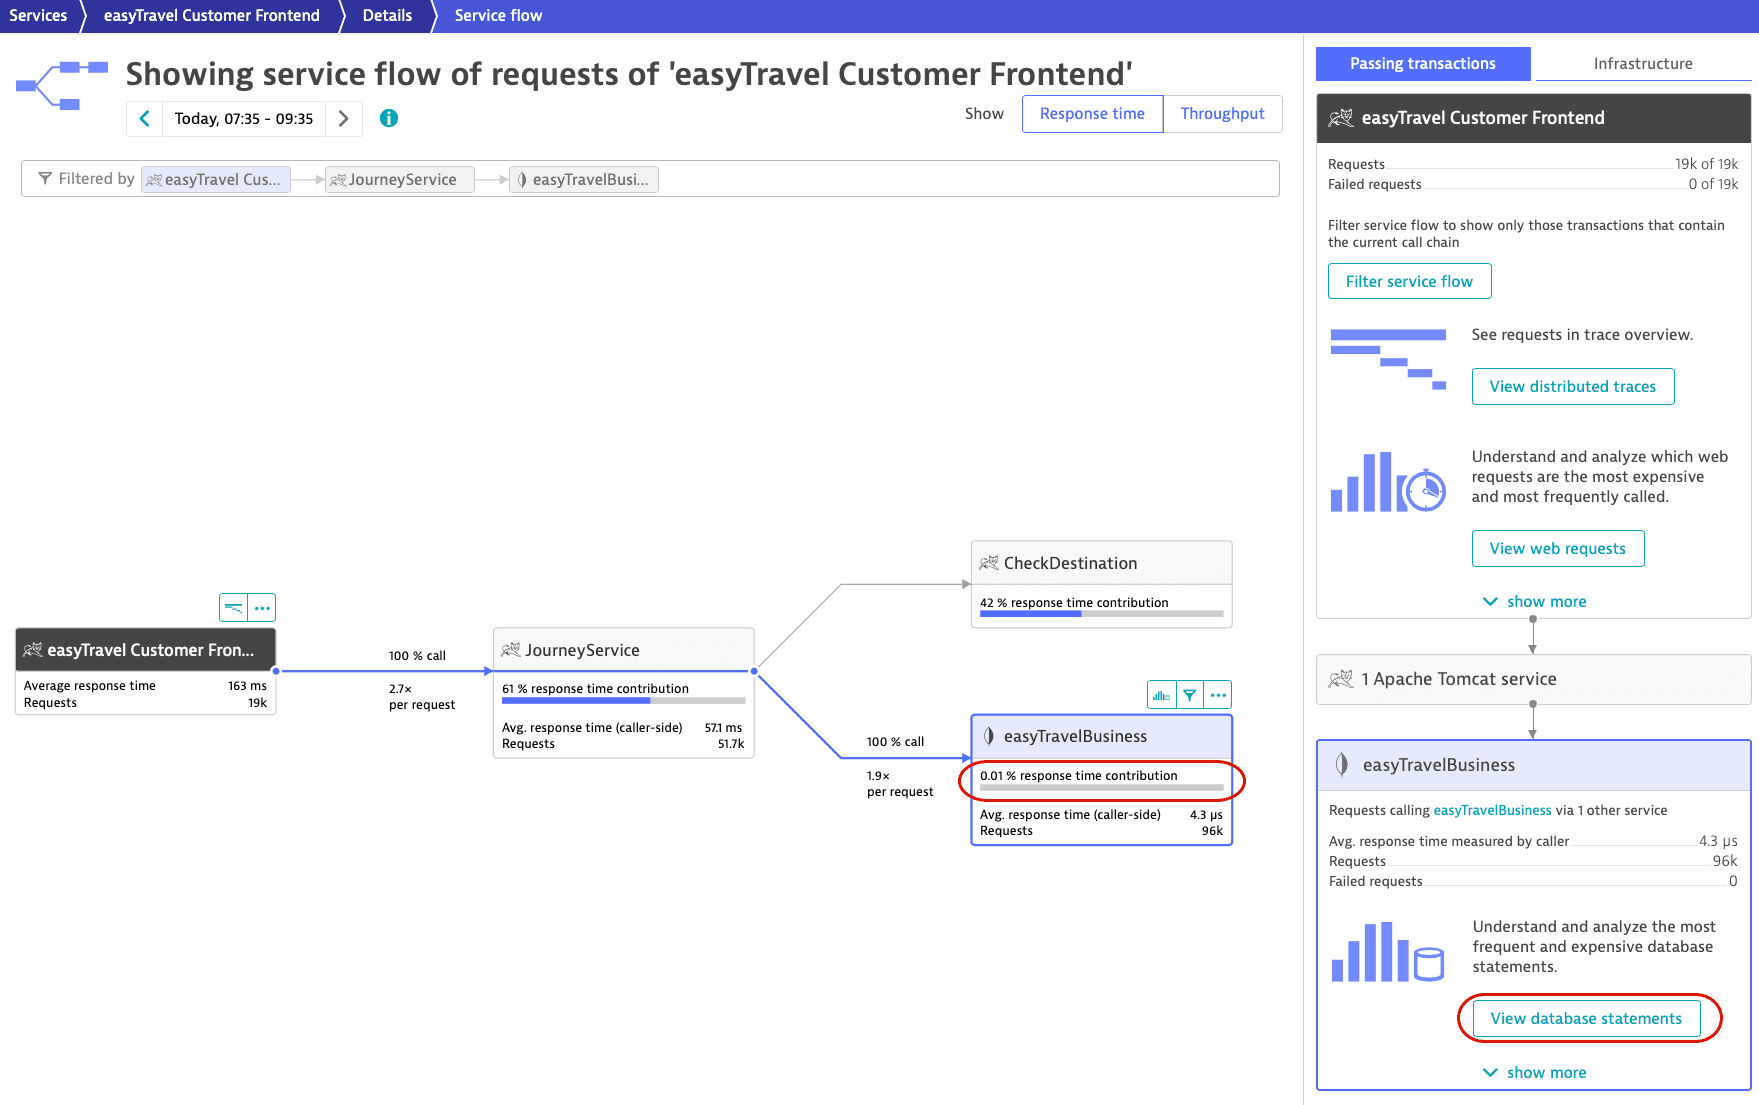
In the example above, the database-service flow is filtered to focus on a particular chain of calls. Whenever the easyTravel Customer Frontend calls JourneyService, 0.01% of the response time contribution can be attributed to EasyTravelBusiness MongoDB service.
To view the database statements that were executed by the selected flow within the analysis time frame, select View database statements. This can be tremendously valuable because it helps you understand why a database contributes a certain amount of time.
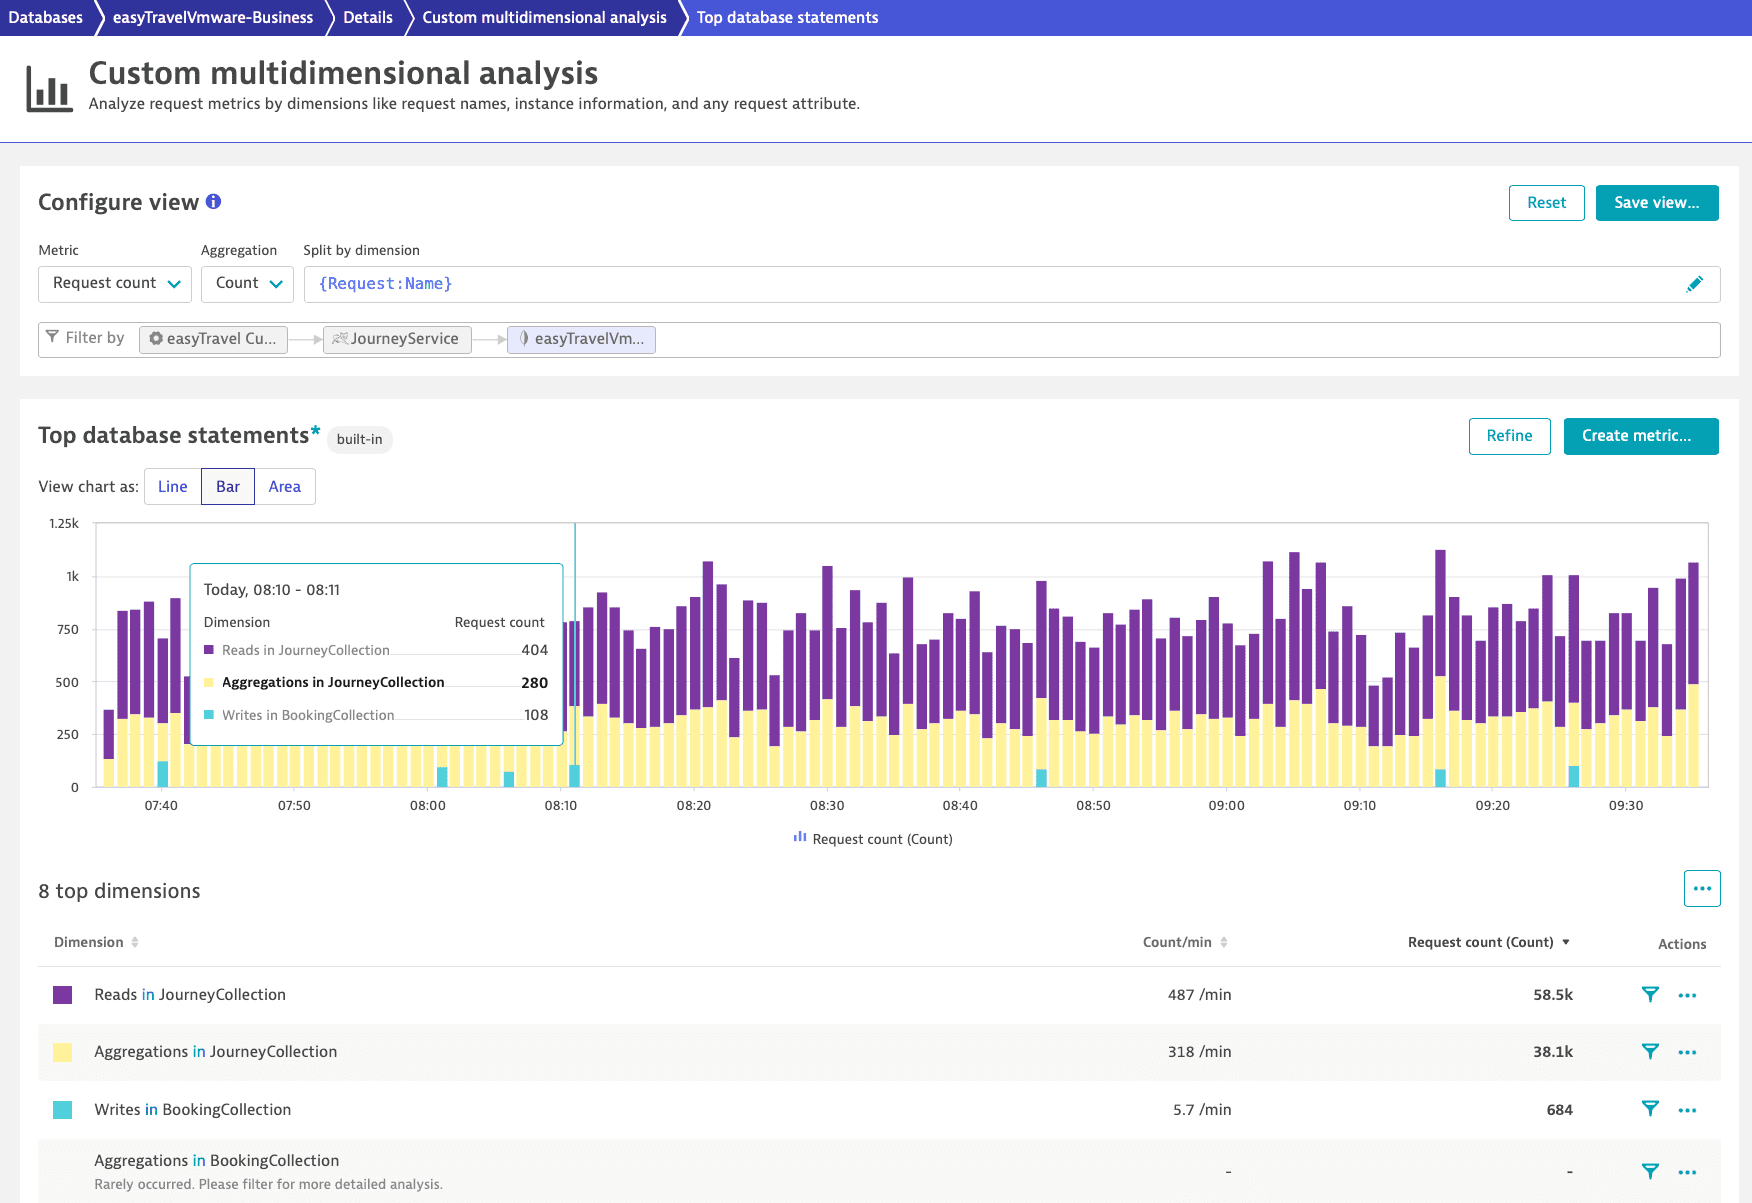
For one of the top dimensions, select More (…) and then
- Select Outliers to understand the spread of response times.
- Select Statement details to understand the evolution of each SQL statement over time, along with the average Rows returned count.
- Select Service backtrace to see which user clicks led to the slowest executions of this MongoDB statement.
As you can see, Dynatrace database-statement analysis views provide powerful database usage-focused analysis.