Deep dive application monitoring and performance management
Monitor and optimize application performance and business transactions at scale with gap-free code-level data
Try for free See the magic


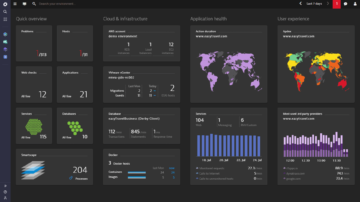
See all performance metrics in real-time
Application performance monitoring (APM) is critical to business success today. Dynatrace automatically sees and analyzes every single user transaction, all the time. All relevant metrics, environment changes, and application deployments are shown in real-time.
- Dynatrace captures every transaction, across every tier, without gaps or blind spots.
- Pre-configured dashboards provide all relevant metrics down to the SQL statement and code level.
- In under five minutes OneAgent automatically discovers your entire application stack.
Get all the details you need for application performance monitoring
- Every single click and page load
- Response time and code-level hotspots
- Failure rate and root causes of errors
- Throughput and cluster distribution
- Request and response sizes
- All database statements
- All Apache and Nginx module timings
- Restarts, crashes, & deployment changes
- Apdex score
- CPU and memory usage
- Garbage collection metrics
- Network traffic for each host and process
- TCP requests and retransmissions
- All requests, all dependencies
- All CDN and 3rd party requests
Follow every single transaction, end-to-end
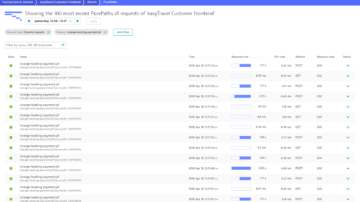
Dynatrace uses patented PurePath Technology® to capture timing and code-level context for every transaction, across every tier, without gaps or blind spots.
- Drill into all services and components called upon with each user interaction.
- Analyze response times and find hotspots at the method level.
- Understand the impact of methods and database statements on user experience using our unique Service backtrace feature.
Blog post
APM solutions vs. APM tools
Why does some APM succeed where others fail? This blog post Choose an APM tool for the solution—not for the problem! summarizes 4 factors to consider when looking at APM vendors.
See all the Dynatrace blogs—about performance, digital customer experience, smarter monitoring for cloud natives.
Blog post
The brutal truth about application performance engineering and operations
If you're responsible for your company's application performance, then don't miss out on our PurePerformance podcasts—the industry's leading source of real-world practical advice, best practices, and hard-won lessons learned. Be prepared to learn a lot about metrics.
Sign up for Dynatrace application performance monitoring today!

“Dynatrace told us exactly how we’re using our environment, so we know what resources to move to the cloud for greater productivity and efficiency. You get instant value from Dynatrace.”

Go from user click to code-level in seconds
Dynatrace application performance monitoring locates problematic methods throughout your entire stack, from user clicks to the application code.
- Identify methods that result in CPU or network bottlenecks.
- See a breakdown of service execution times at the method level and analyze failure rates.
- Get an overview of how much time is spent on garbage collection so you can tweak your application’s heap memory settings.
No gaps, no guessing, no boundaries—no problem
Download the Dynatrace fact sheet to learn how you can tame unruly applications before they become problems, moving you from reactive crisis mode to proactive management.
Sign up for Dynatrace APM today!
Monitor database query executions
Dynatrace tracks and inspects all the SQL statements and NoSQL queries that your application sends out.
- Get instant insight into database problems, in a single view.
- Dig into execution frequencies, response times, and long-running queries
- Databases are auto-detected and analyzed without manual configuration.
Dynatrace shows you the root causes of problems!
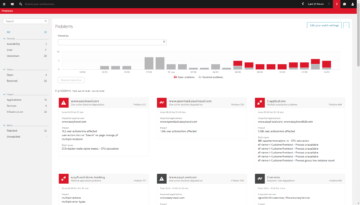
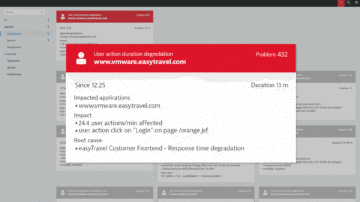
Dynatrace detects and diagnoses problems in real time—pinpointing root causes all the way down to the offending lines of code—before your customers are affected by them.
- Proactively detect availability and performance problems across your stack.
- By applying big data analytics to billions of dependencies within your application stack, Dynatrace directly pinpoints the components that are causing problems.
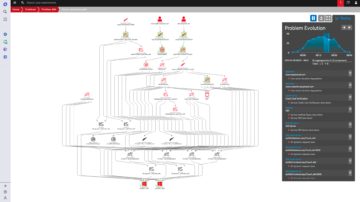
- Visual replay of problem evolution helps you understand how problems evolved over time.


“With Dynatrace, finding a problem only takes us minutes to identify, saving us precious time and resources.”

Automatically discover and map applications and infrastructure
Dynatrace APM automatically detects and visualizes your web application and its dependencies end to end—from website, to application, to container, infrastructure, and cloud. Our application performance monitoring solution works out-of-the-box with zero configuration.
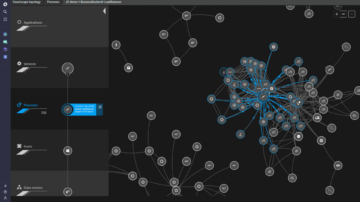
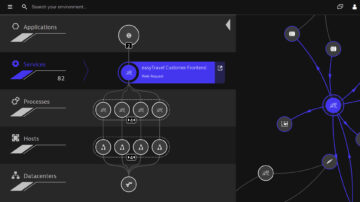
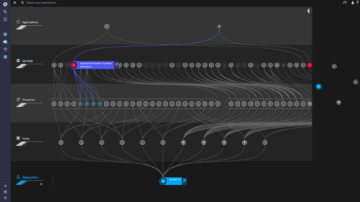
- Dynatrace Smartscape provides an interactive map of your application across all layers.
- See how all components relate to and communicate with one another.
- Our unique performance tool was designed for cloud environments where instances are rapidly created and deployed, making it a perfect fit for microservices environments.
Get the full picture, including network health and log-file analysis
Dynatrace provides a clear picture of all inbound and outbound process connections running over your network interfaces (both physical and virtual) and automatically discovers all log files on your monitored hosts and processes.
- Understand the actual throughput and network-communications data of your communicating hosts and processes.
- Gain direct access and search the log content of all your system’s mission-critical processes.
- Relevant log messages and networking anomalies are factored into problem root-cause analysis.
Continuous integration and delivery
Dynatrace integrates seamlessly with popular CI/CD systems, making performance-driven development and delivery a continuous process.
- We integrate with your DevOps toolchain to automate issue detection during QA and testing.
- Detect regressions automatically, comparing production and dev builds at the code-level.
- A single dashboard displays the current build status from both the functional and performance perspectives.
eBook
7 performance metrics to release better software faster
Download our exclusive eBook 7 performance metrics to release better software faster—no registration required—to see some real-life examples of application failures and how to avoid them.
Blog post
Measure More Frequent Successful Software Releases
Need a more rapid deployment model but not sure if you can technically deliver? Read this blog post to learn which critical success factors to measure and monitor whether you're moving in the right direction.
Start your free Dynatrace trial today!
Gartner recognizes Dynatrace as a 2020 Magic Quadrant Leader for APM
Gartner's 2020 Magic Quadrant
Named a leader for the 10th time
Gartner's Critical Capabilities
Scored highest in 5 out of 6 use cases