After years of “Breaking the Monolith into Microservices” talk, many organizations are at a point where they have either implemented new projects based on a micro-service architecture or have added new features using micro-services and connected them with the backend monolith. Some found ways to “strangle” out services from the monolith, as proposed by Martin Fowler, followed Sam Newman’s Microservice principles or Adrian Cockcroft’s work on State of Art Microservices.
While many organizations are still in that transformation step, the next big thing is looming: Breaking your Services into Functions and running them on “Serverless” platforms such as AWS Lambda, Azure Functions, Google Cloud Functions or Pivotal Function Service.
Whether you are already on the leading edge with Serverless or are still wrapping your head around how to componentize your monolith – there are and will be challenges in that transformation.
I took the liberty and re-purposed (borrowed, stole…) some slides from an AWS presentation I saw at our Dynatrace PERFORM 2018 conference delivered by Tomasz Stachlewski, AWS Senor Solutions Architect. He found a great way to visualize the transformation from Monolith via Services to Functions. I added questions in each of his transformation phases that I keep hearing from companies that are struggling to move along that trajectory:
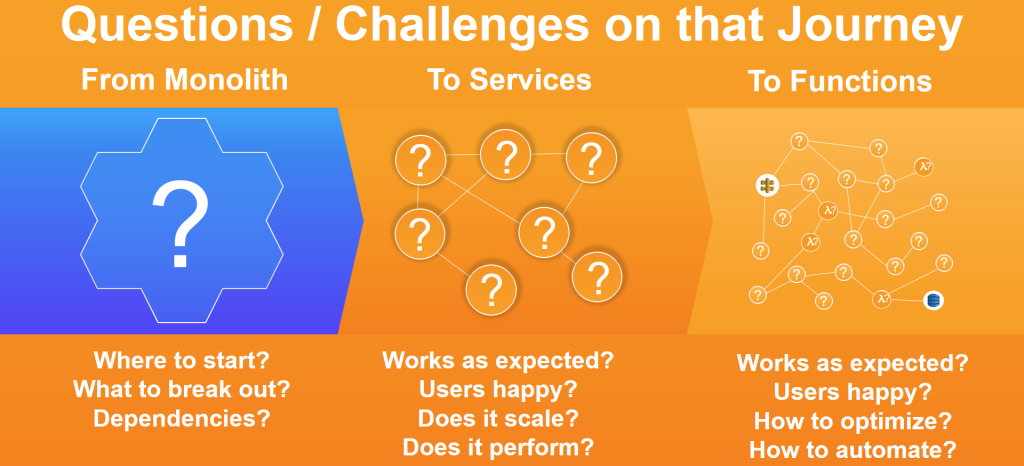
What we learned in our Dynatrace Monolith transformation!
At Dynatrace, we had to ask ourselves the same questions when transforming our monolithic AppMon offering towards our new Dynatrace SaaS & Managed solution. Not only did we transform our culture and approach, we also had to transform our architecture. We ended up with a mix of pretty much everything, such as different tech stacks and 3rd party services to solve individual use cases in an optimal way. Overall, we saw a clear move towards smaller independent components, services, APIs and functions that fulfill different purposes. The success can be seen when looking at some of the metrics we have shown at recent DevOps & Transformation events:
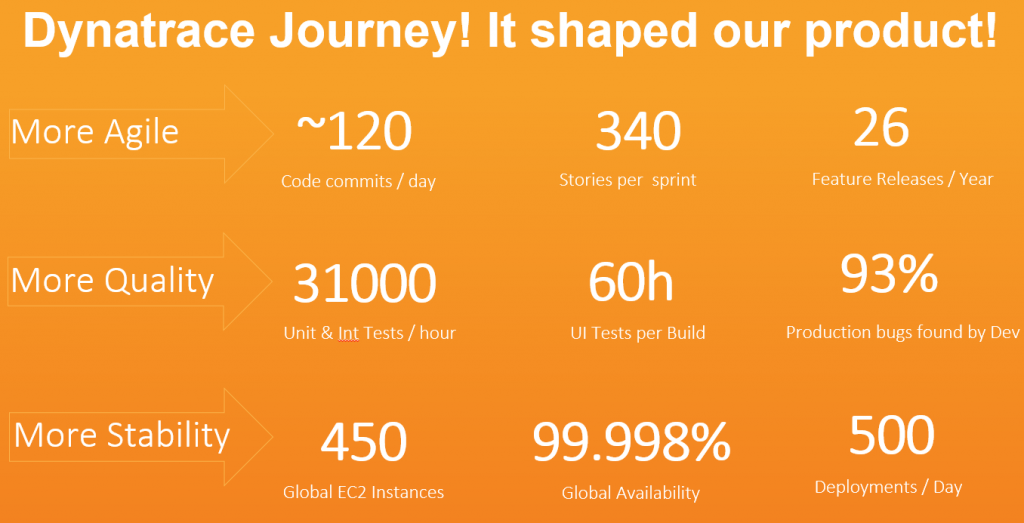
As part of our transformation, we forced ourselves to leverage and shape Dynatrace as much as possible. This resulted in a lot of the features you now see in the product such as:
- OneAgent: A single agent that covers the full stack instead of individual agents
- SmartScape: Automated Dependency Detection to better understand what is really going on
- AI: Automated Baselining, Anomaly and Root Cause Detection. Because your teams can’t keep up with the complexity in the old way we did monitoring
- API-First: Everything must be doable via an API to integrate Dynatrace into our pipelines
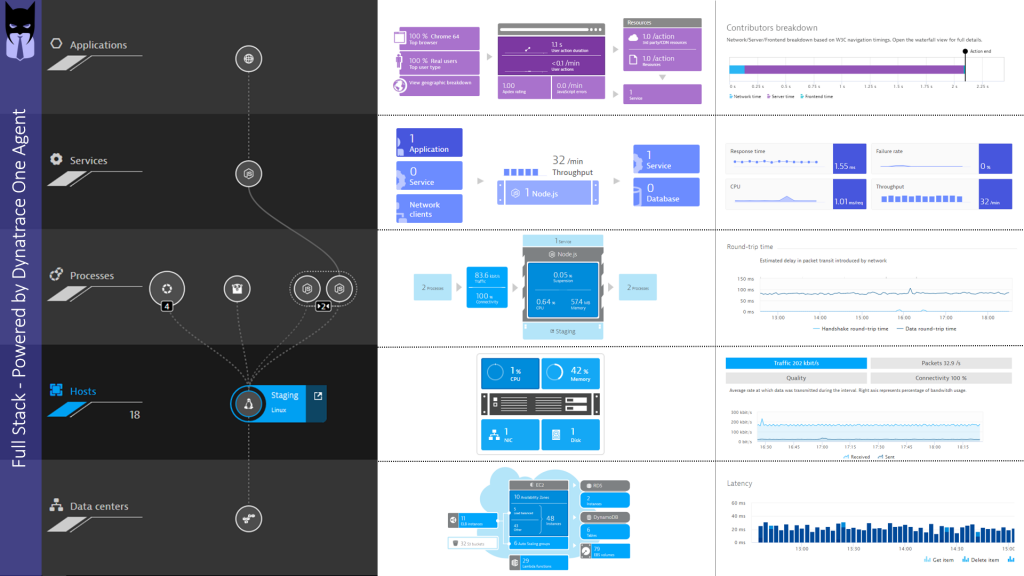
11 Use Cases you must MASTER in your Transformation!
When we look back at the transformation path laid out by Tomasz, then we believe that we can answer all the questions and allows you to accelerate that transformation, without fearing that something will go completely wrong:
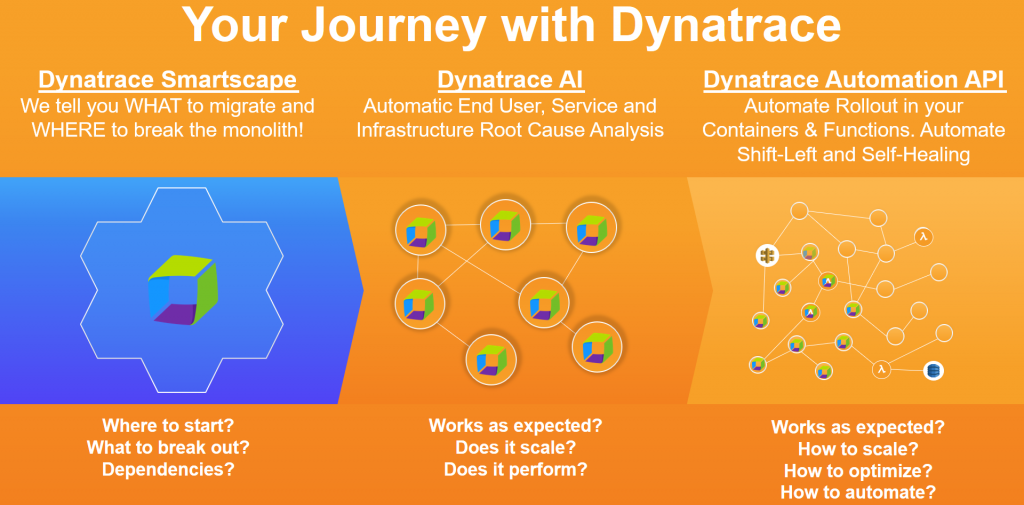
Let me briefly dig deeper into the individual phases of your transformation and how Dynatrace supports you:
#1: What are we migrating? What are my dependencies?
When we started our transformation, we assumed we knew everything about our status-quo, until we saw the real status-quo and knew that we were far off. To make it easier for us – and therefore also for you – to get a better understanding of the status-quo we invested a lot into Dynatrace OneAgent and Smartscape. Simply, drop the OneAgent and it tells you which services are running on which hosts and what other services, processes and hosts they are the depending on. With this information – also accessible via the Dynatrace API – you can make better decisions on which components to migrate and which ones to leave alone (at least for now):
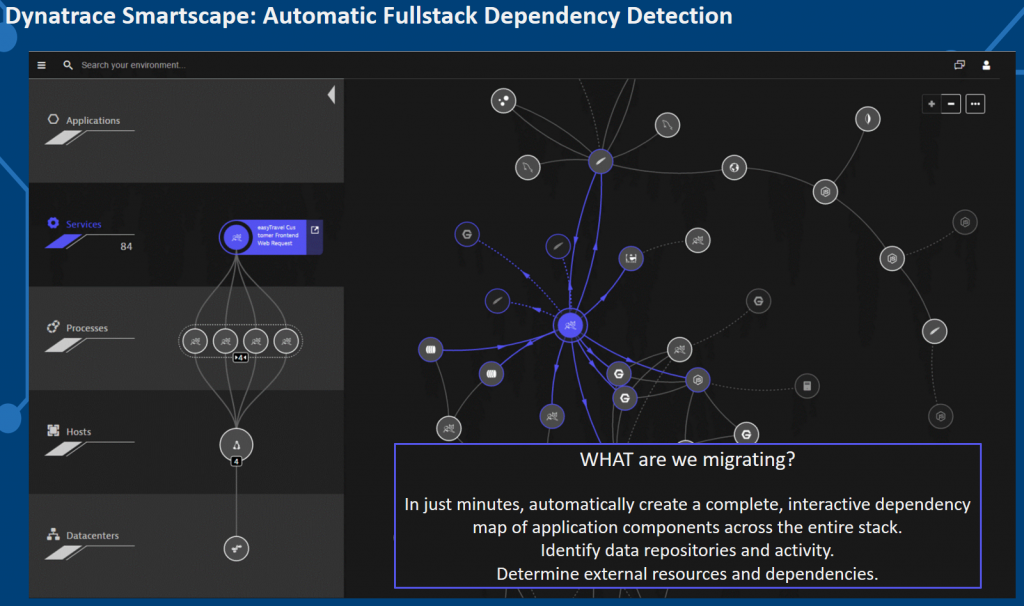
Tip: Smartscape shows you all dependencies based on where services run (vertical dependencies) and whom they talk to (horizontal dependencies). Before picking your monoliths or applications to migrate or break into smaller pieces, make sure you first understand the real dependencies. You might find unknown dependencies to a database, a background process, a message queue or an external service that is only accessible in that environment. Leverage the Smartscape API to automate some of these validation steps.
#2: Where to break the monolith?
A common approach to break the monolith, is by refactoring the monolithic codebase into individual modules or components, designing well-documented interfaces and hosting them in containers. This works well if you know the codebase and understand which part of your code is calling which other parts of your code, so that you can make better decisions on how to refactor and extract. This often leads to many trial & error attempts, as well as lots of iterations of refactoring.
While Dynatrace doesn’t solve the problem of refactoring and extracting your components into services, we built a cool feature into Dynatrace that allows you to “virtually” break the monolith into services and let Dynatrace tell you how your current monolith would look like in case you extract code along these “seams” (methods or interfaces). The feature is called “Custom Service Entry Points,” which allows you to define those methods that will become your new “service interfaces”.
Once you define these entry point rules, Dynatrace will visualize end-to-end Service Flows, not by drawing a single monolithic but by showing each service interface as an actual “virtual” services. The following animation shows what this mentioned ServiceFlow looks like. Instead of a single monolith you see it “broken into services”. All of this without having to make any code changes.
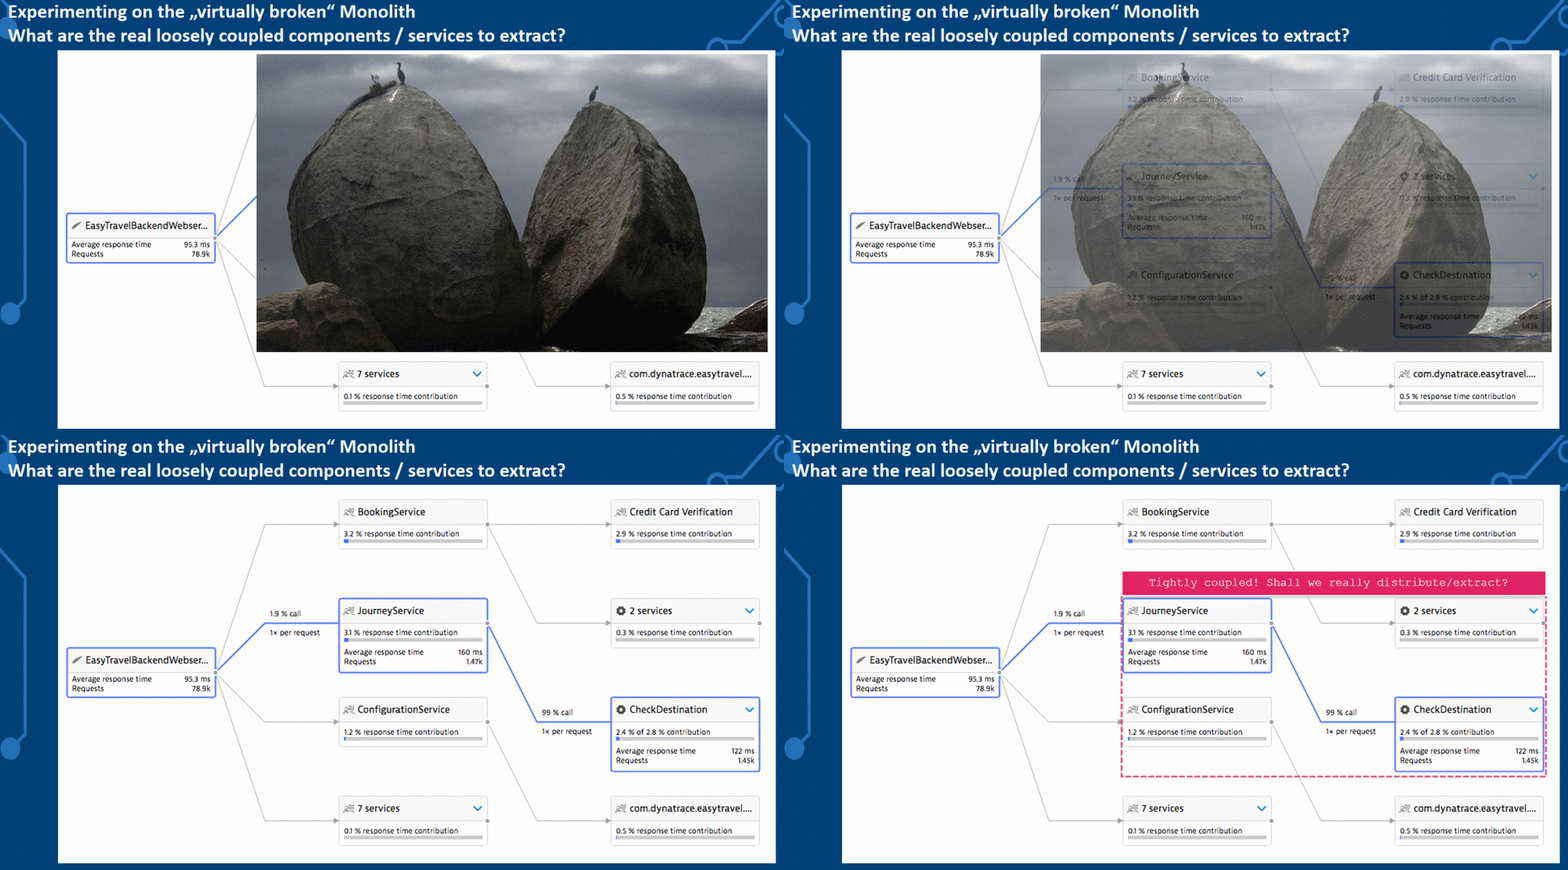
Tip: The ServiceFlow gives you a lot of powerful insights into how these services are interacting with each other. You can identify services that are tightly coupled or send a lot of data back and forth. These are all good indicators that you might not want to break it along those lines. If you want to automate that analysis you can also query the Smartscape API as it provides “relationship” information between services and processes. This avoids somebody having to manually validate this data through the WebUI.
#3: Did we break it successfully?
After extracting your components into services and running them standalone or in containers, Dynatrace OneAgent and Smartscape can help us validate whether the new architecture and deployment really turned out as expected, like where do these services run? How many are there? How are they distributed across data centers, regions or availability zones? Are they running the same bits and provide the same service endpoints?
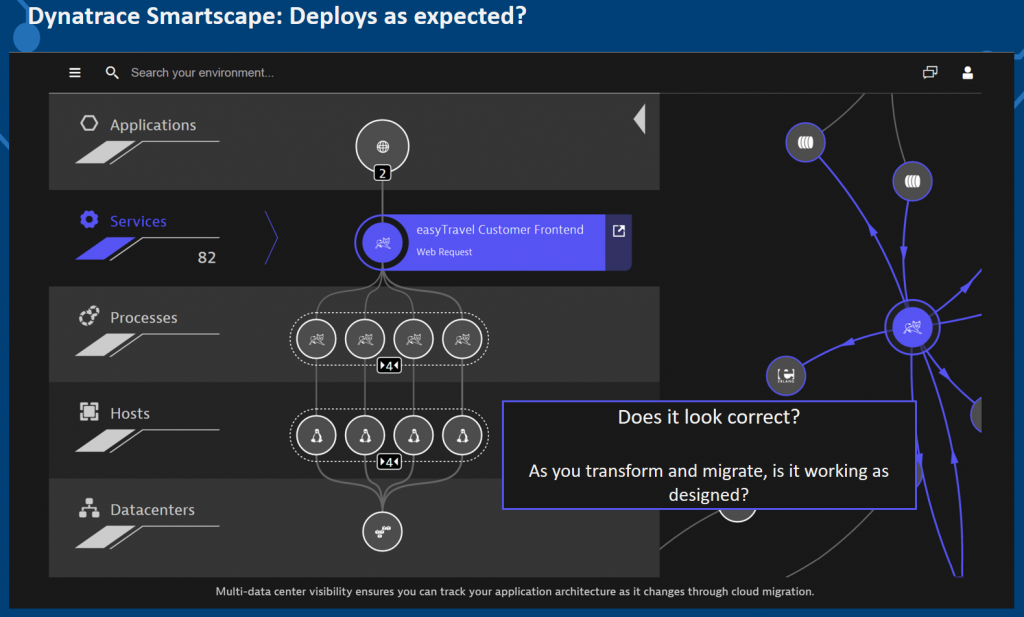
Tip: Like my previous tip, use the Smartscape API to automate validation, as all this data you see in the Smartscape view can be accessed via the API. This allows you to automatically validate how many service instances are really running, where they run and what the dependencies are. It’s a great way to flag dependencies that shouldn’t be there as well!
#4: Does it PERFORM as expected?
When migrating from one system to another, or from one architecture to another, we want to make sure that key quality aspects don’t deteriorate. Performance, stability and resource consumption are some of these key quality attributes. With Dynatrace, we can compare two timeframes with each other to validate if metrics such as Response Time, Failure Rate or CPU consumption have changed:
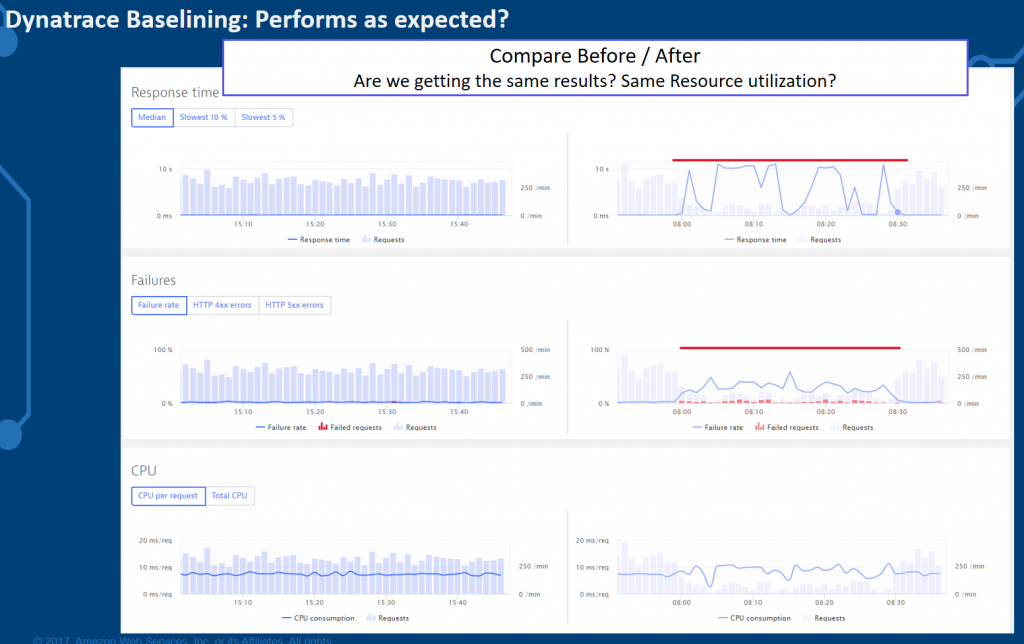
Tip: The Dynatrace Timeseries API allows you to pull all these – and even more metrics – automatically from Dynatrace for any type of entity and timeframe. This allows you to automate the comparison. Check out my work on the “Unbreakable Delivery Pipeline” where I implemented this automatic comparison between builds that get pushed through a CI/CD DevOps Pipeline.
#5: Does it SCALE as expected?
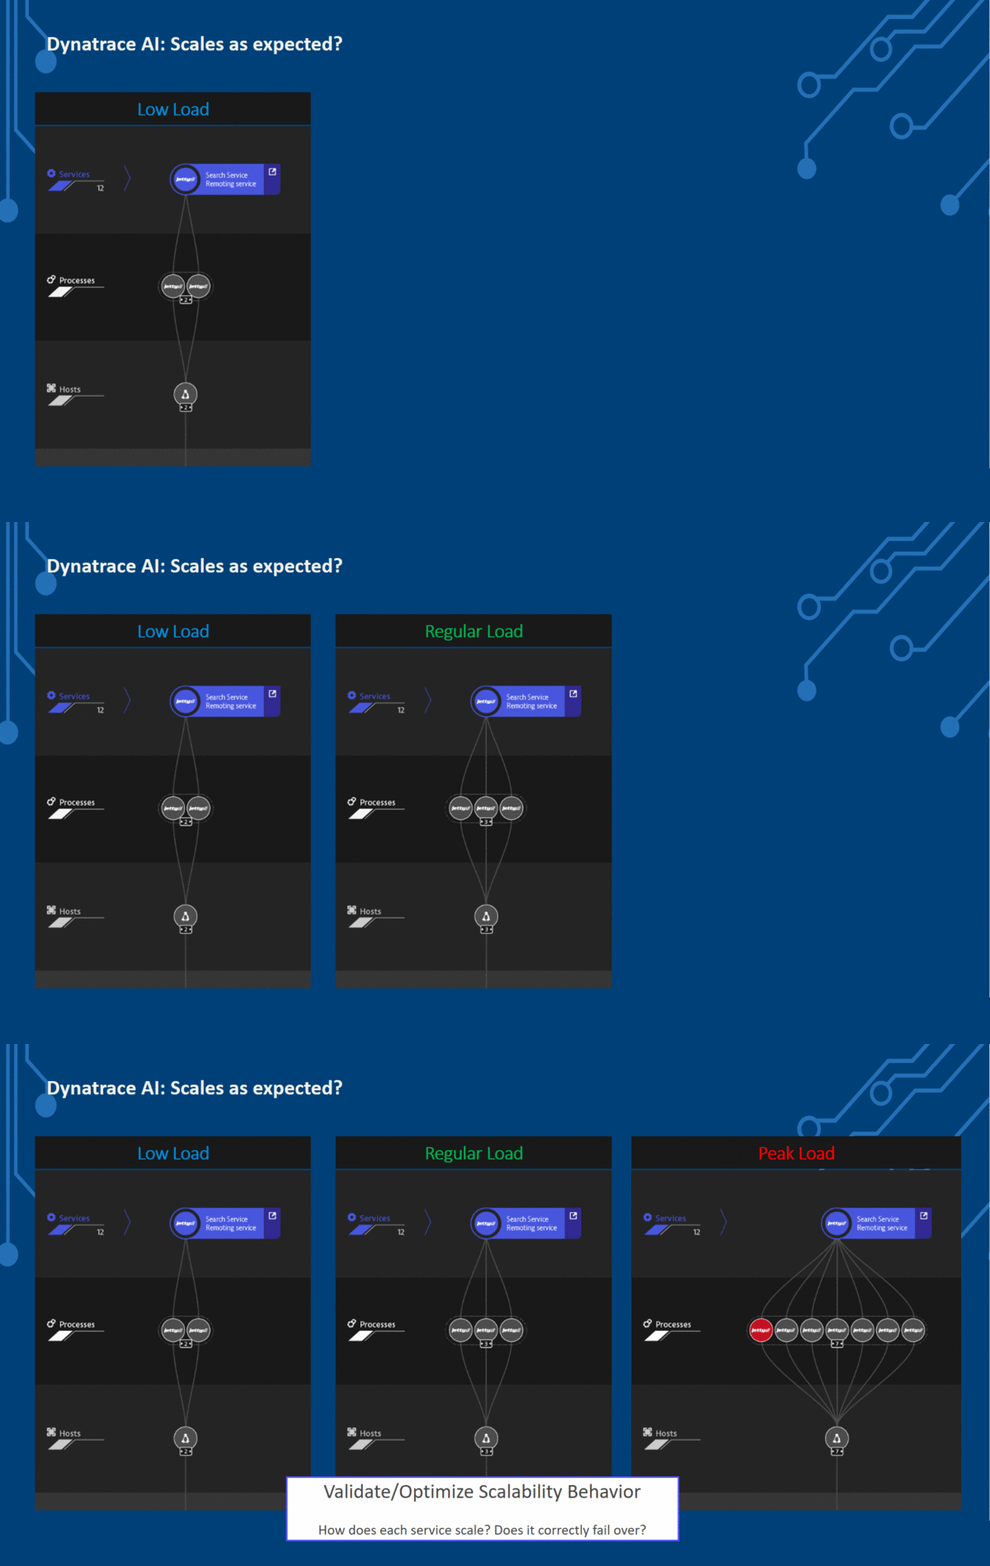
One of the reasons we break a monolith into smaller pieces, is to enable dynamic scaling of individual components/services depending on load or to ensure a certain level of service. With Dynatrace, we observe how your architecture scales under load and when we reach scalability limits. The following screenshot shows that we can look at Smartscape for different load scenarios, e.g: during an increase load performance test scenario. We can see how many services are running for each load, we can validate load balancing and we can also observe when service instances start to fail. This is very valuable insights for your architects but also your capacity planning teams:
Tip: Especially for performance and capacity engineers I suggest looking into the Smartscape and Timeseries API. While you run your tests, there is no need to stare at our dashboards (well – you can if you want to). But I suggest using our API and extract the data you need for your Capacity Assessments.
#6: Does it INTERACT as expected?
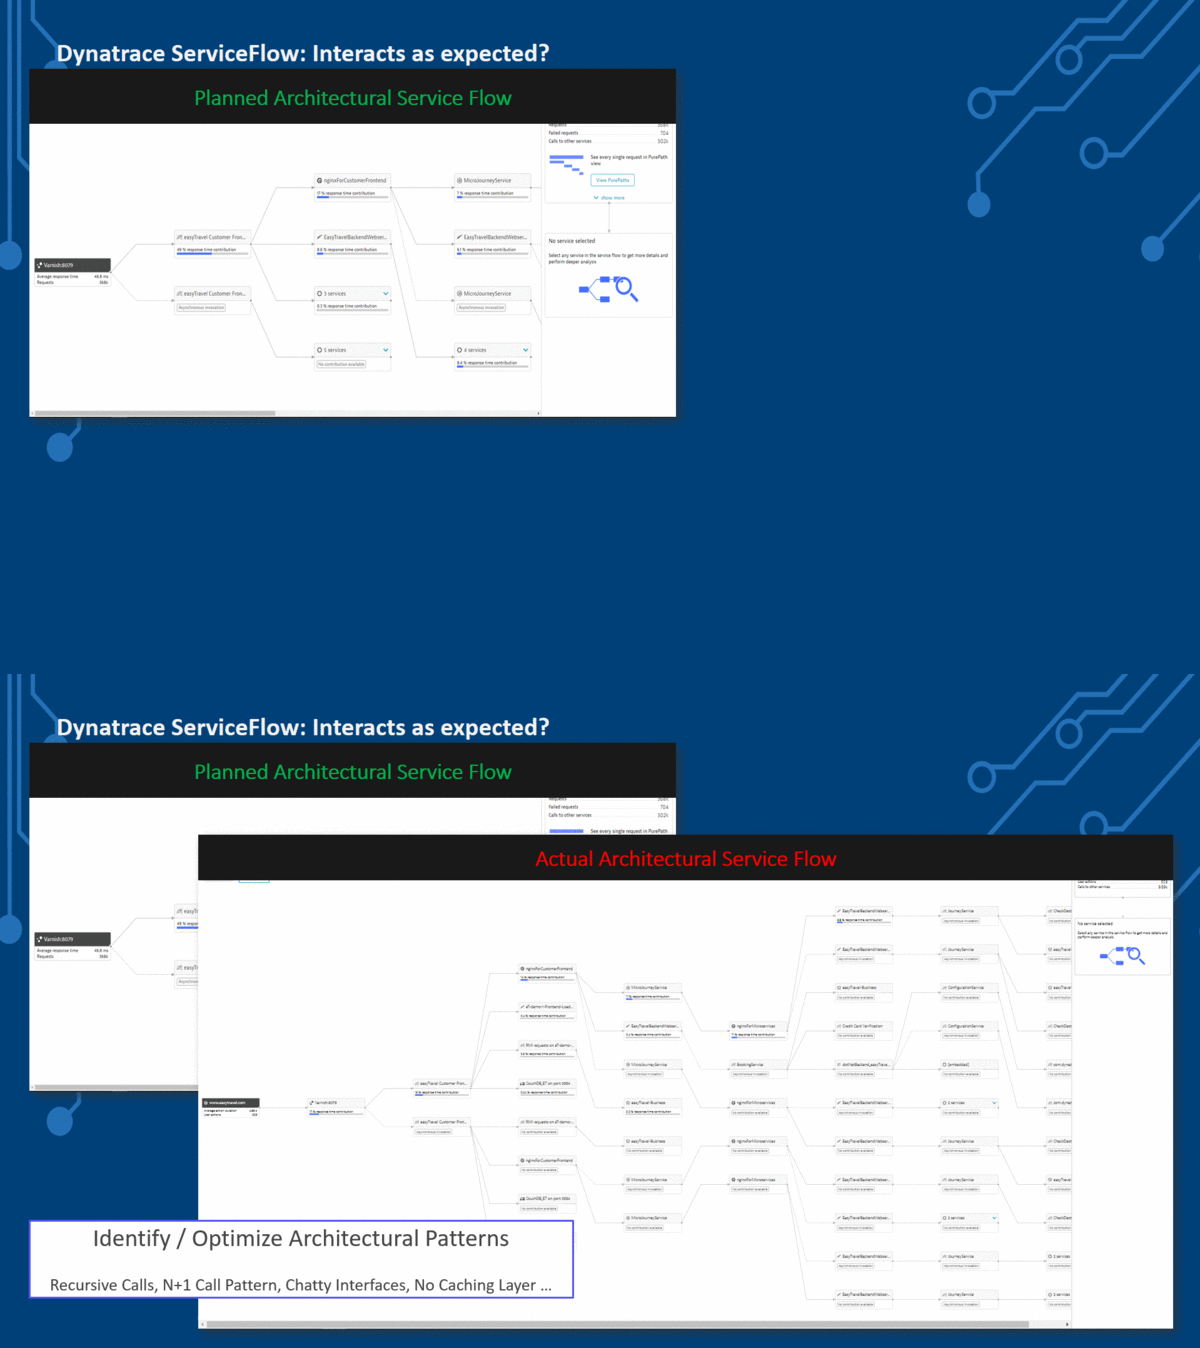
After extracting the monolith into smaller pieces, we should have a clear picture in our mind on how the end-to-end transaction flow looks like. At least on paper! But what is the reality? Which service calls are really involved in end-to-end transaction execution? Do we have an optimized service execution chain or did we introduce any bad architectural patterns such as N+1 Service or Database calls, missing caching layer, recursive calls …? Simply look at the ServiceFlow and compare what you had in mind with what is really happening:
Tip: The ServiceFlow provides powerful filtering options allowing you to focus on certain types of transactions or transactions that have a certain behavior, e.g: transactions that flow through a certain service, that use a certain HTTP Request Method (GET, POST, PUT, …) or those that show bad response time. For more details check out the blogs from Michael Kopp on Extended Filtering, Problem and Throughput Analysis and Enhanced Service Flow Filtering.
#7: Does user BEHAVIOR change as expected?
Bottom line with any transformation is that our end users should not experience any negative impact on using our services. That’s why it is important to monitor your end users, their behavior and how that behavior changes once moving over to the new architecture.
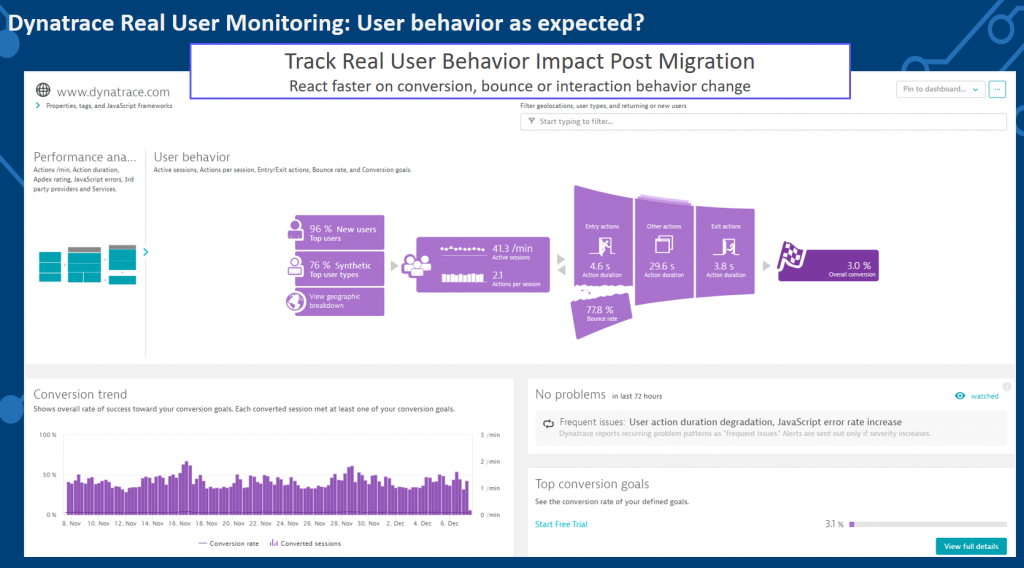
We should NOT expect any negative impact – in fact – we should at least expect the SAME or BETTER behavior, e.g: more user interaction, increased conversation rates, etc. With Dynatrace, we simply look at RUM (Real User Monitoring) data where we automatically track key user behavior metrics:
Tip: There are many great real user monitoring metrics we can look at, analyze and start optimizing. If you want to learn more about how to use Dynatrace RUM to optimize your user behavior check out the Performance Clinic with David Jones on Unlock your Users Digital Experience with Dynatrace. Oh yeah – did I mention we have an API for that as well? You can query application-level metrics through the Timeseries API and automate these validation checks!
#8: How to manage and control cloud and cloud service usage?
It’s great to move applications and services to the cloud and leverage existing cloud services instead of building it yourself. But without knowing what your code is really doing and which of your applications and services are using which cloud services you got to pay for, e.g: DynamoDB, EC2, … you might be surprised at the end of the month when you get your cloud providers usage bill.
Dynatrace integrates with all major cloud provides and gives you insights on WHERE your custom code runs and WHICH paid cloud services are consumed in which extend. You can even break this down to individual features and service endpoints.
This allows you to allocate cloud costs to your applications and services and gives you a good starting point to optimize excessive or bad usage of cloud resources which will drive costs down.
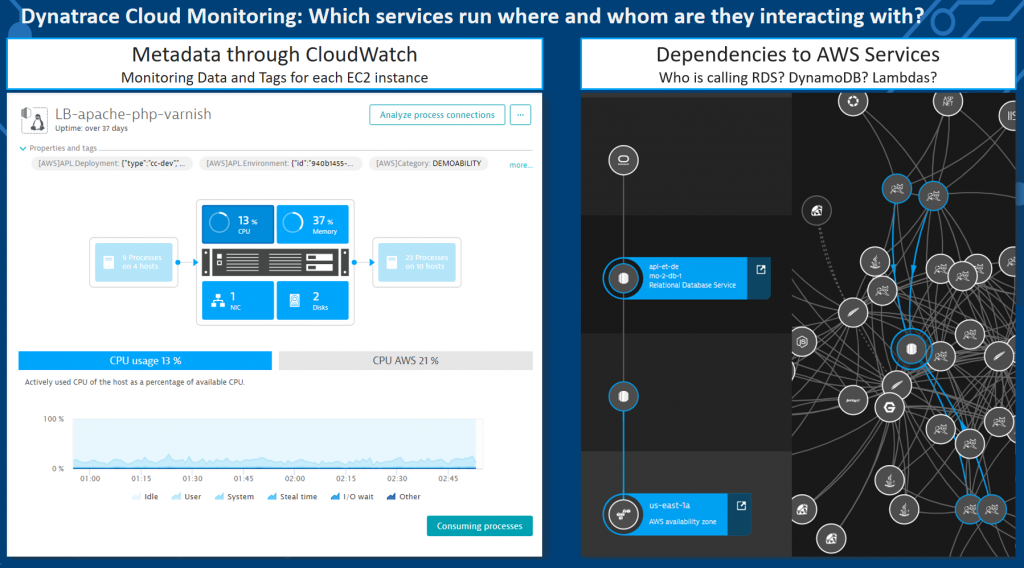
Tip: Dynatrace automatically pulls meta data information from the underlying virtualization, cloud, container and PaaS environment. This meta data can be converted into tags which make it easy for you to analyze and organize your monitoring data. To learn more about proper tagging check out Mike Gibbons 101 Tagging with Dynatrace performance. And as mentioned many times before: leverage the Dynatrace API to extract this information to automate auditing and controlling of your cloud usage.
#9: How to manage logs in a cloud environment?
With all the automatic instrumentation and tracing that monitoring tools provide we still rely on logs. There are many great log analytics tools out there but not all of them are built for the challenges of the cloud, which is: you do not always know which log files are written, where they are stored and how long are they available? Think about containers – that might be short lived – and so are the logs: you don’t want to implement custom log capturing strategies depending on the container technology, cloud or PaaS provider.
Dynatrace OneAgent automatically takes care of that. Once installed, OneAgent automatically analysis all log messages written by your code, by 3rd party apps and processes and by the cloud services that they rely on. Everything accessible in the Dynatrace Web UI!
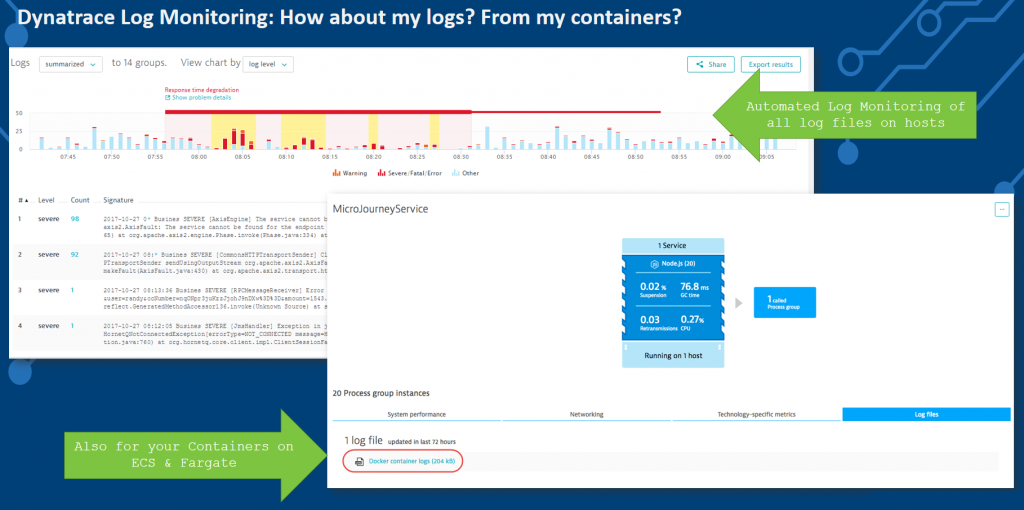
Tip: Dynatrace automatically detects bad log entries and feeds these to the Dynatrace AI for automatic problem and root cause analysis. Make sure to check out some of the advanced options such as defining your custom log entry rules as well as our recently announced updates such as centralized log storage.
#10: How to manage containers?
You eventually end up using some flavor of containers in your deployments. Whether it is Docker, rkt, Kubernetes (k8s), OpenShift, ECS, Fargate, EKS … Whatever flavor you end up choosing, you will want to know how many of these containers are actually running at any point in time, which services they support and what to do in case something is not working as expected.
Dynatrace provides full container visibility thanks to OneAgent. Not only do we monitor your containers, but we also extract meta data from these containers that make it easier to know what runs in that container, to which project it belongs and whom to contact in case something goes wrong:
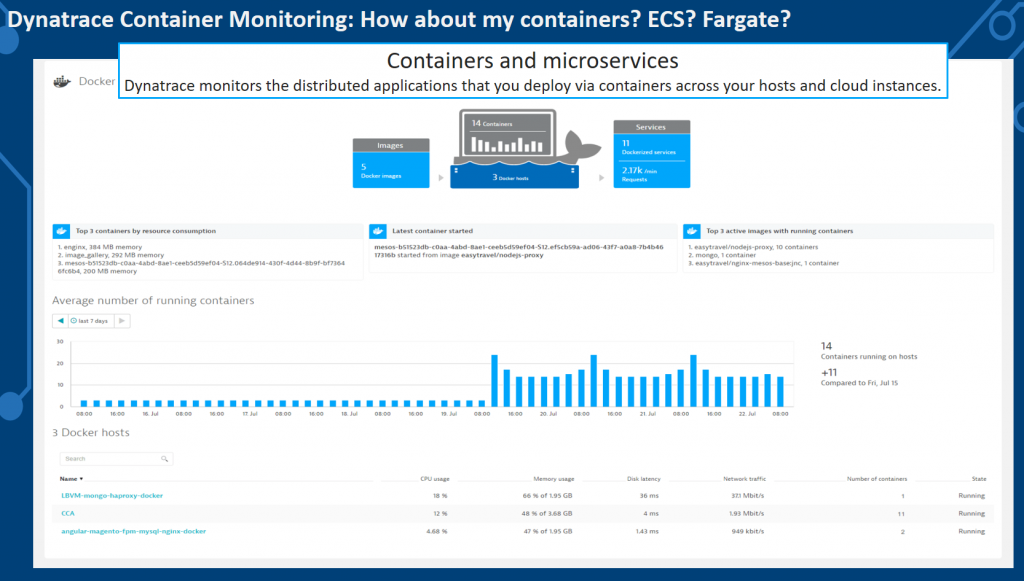
Tip: Take a closer look at the different OneAgent deployment options we provide for containers. Whether it is installing the OneAgent on the Docker host, whether running the OneAgent as an OpenShift DaemonSet or whether installing it into the container itself. You will always get the visibility you need! For information on k8s, Mesos, GKE, Fargate, ECS make sure to check the latest documentation on container monitoring.
#11: What are my Serverless Functions doing?
Once you start leveraging serverless you want to know what your AWS Lambda, Azure Functions, Google Cloud Functions or Pivotal Function Service are really doing when being executed. You will be charged by the number of execution and total execution time, so you better understand whether you have a performance bottleneck in one of these functions or whether your functions are accessed too often in a wrong way, e.g: N+1 Function Call Pattern, Recursive Calls, Missing Result Caches, …
Dynatrace provides end-to-end visibility for AWS Lambda and Azure Functions and is actively working on providing end-to-end code-level visibility for other upcoming Function as a Service (Serverless) providers:
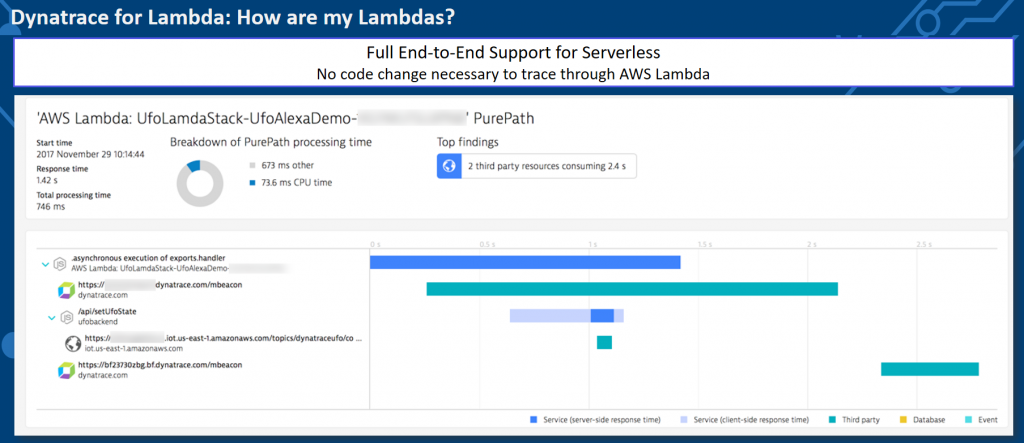
Tip: I’ve done some AWS Lambda development in the past. While the built-in debugging, logging, and monitoring support slowly improves, it is still very hard to do proper large-scale monitoring and diagnostics. You must invest a lot of time into writing proper logs. With Dynatrace this all goes away as all the data you need is collected and provided through our various analytics views. If you want to learn more make sure to check out the latest Dynatrace blogs around serverless.
You will fail, eventually. We help you recover fast!
Along this journey, you will end up with problems – despite following my steps. It is natural as we are not dealing with a simple problem. We also fail – on a continuous basis. But we continuously recover and we are doing this faster with every time we fail and we are automating as much as possible.
This process shaped our Dynatrace AI, the automatic anomaly and root cause detection which not only reduces MTTR if you are manually analyzing the AI-provided data. It also allows you to implement smart auto-remediation and self-healing. The following animation shows the rich-ness of data, the context and the dependency information Dynatrace provides as part of an automatic detected problem. What you are seeing here is what we call the Problem Evaluation, I call it the “Time Lapse View of a Problem”. This makes it much easier to understand where the problem is, how it trickles through your system and where your architectural or deployment mistake lies.
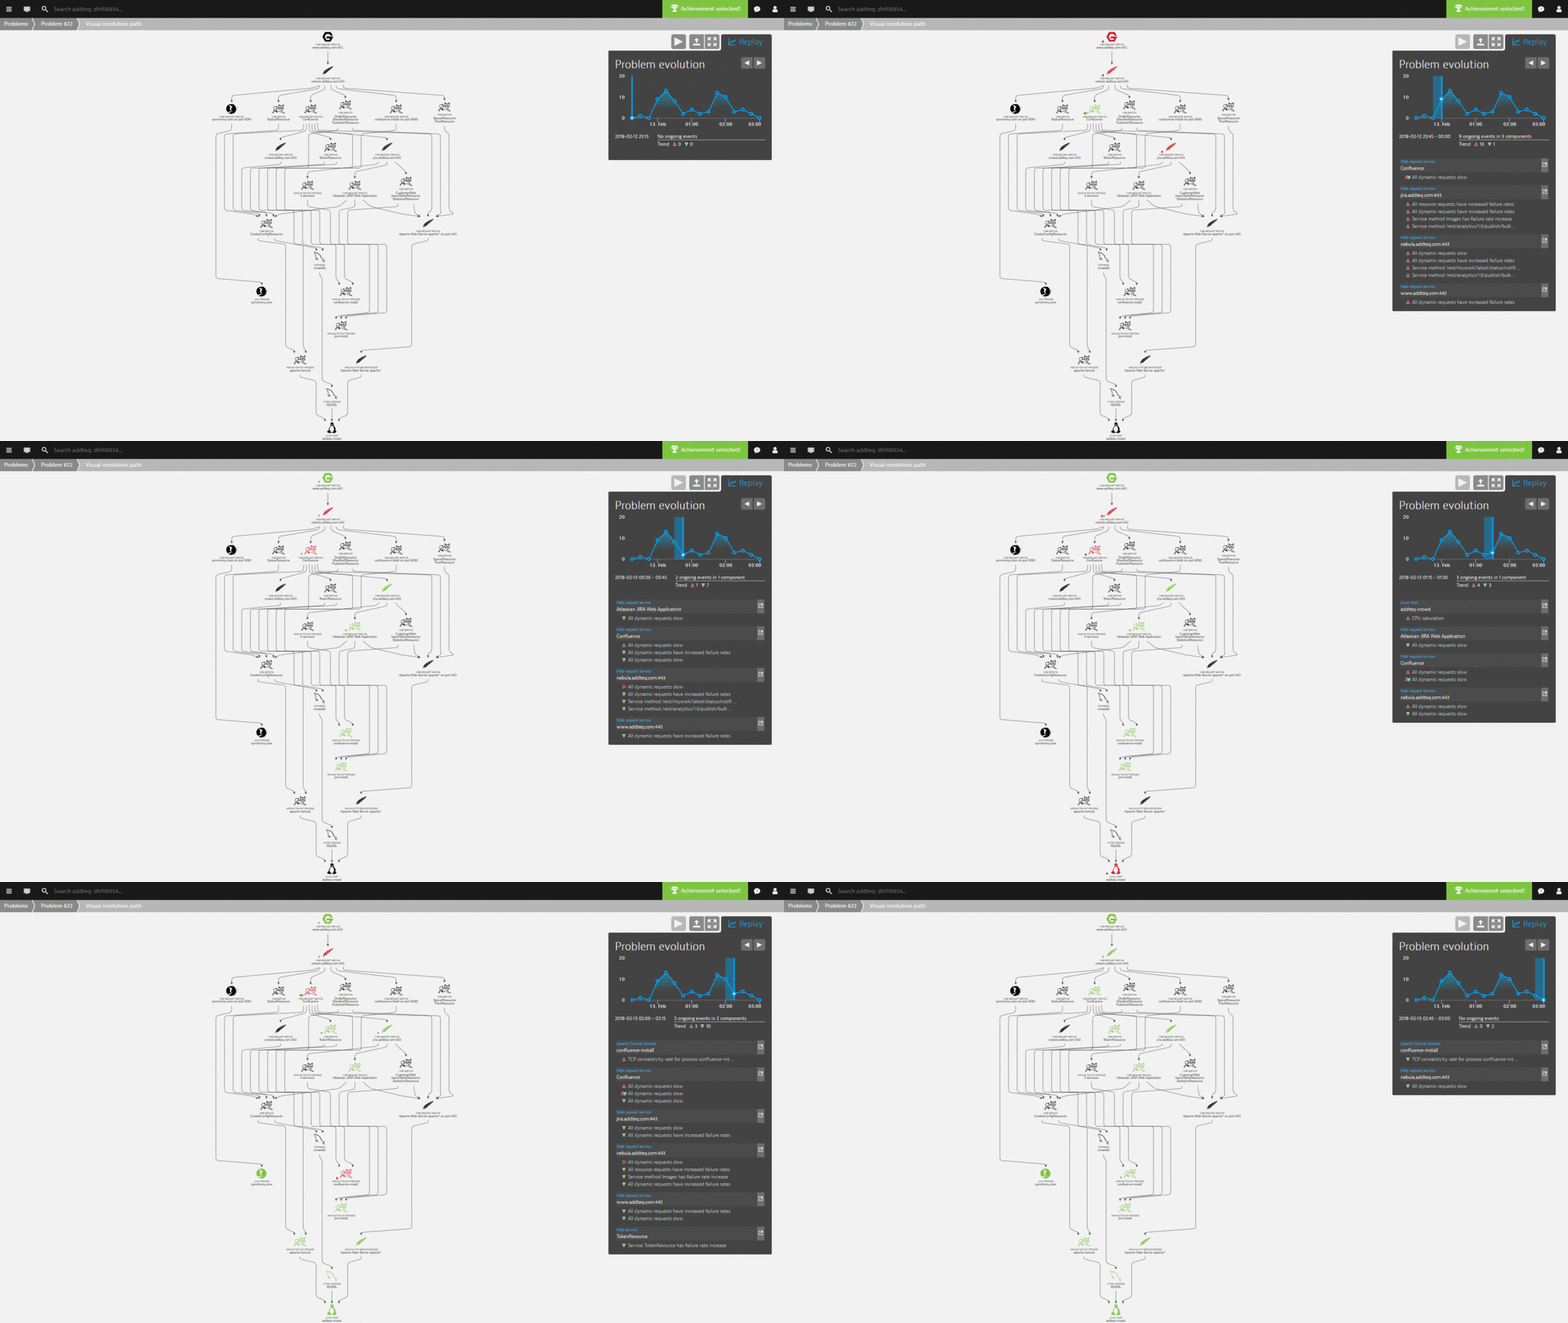
Tip: Check out my recent blog posts on real-life problems detected by the Dynatrace AI and my thoughts on how to automate the remediation of these problems. All the automation is possible through our Problem REST API.
Finally: Accelerate through Continuous Delivery
If you have followed my work, you know I am a big fan of Contiguous Integration & Continuous Delivery. I also have my thoughts on Shift-Left, Shift-Right and Self-Healing.
Whatever you do in your transformation make sure to read through my tips and start automating as many of these “quality gate checks” into your delivery pipeline. The Dynatrace REST API enables you to do this type of automation and thanks to the flexibility of state-of-the-art CI/CD tools we can integrate Dynatrace into your pipeline.
If you have questions feel free to reach out to me. Leave a comment here and tweet at me. Happy to give guidance in your transformation based on our own experience and experiences that others have shared with me!


Looking for answers?
Start a new discussion or ask for help in our Q&A forum.
Go to forum