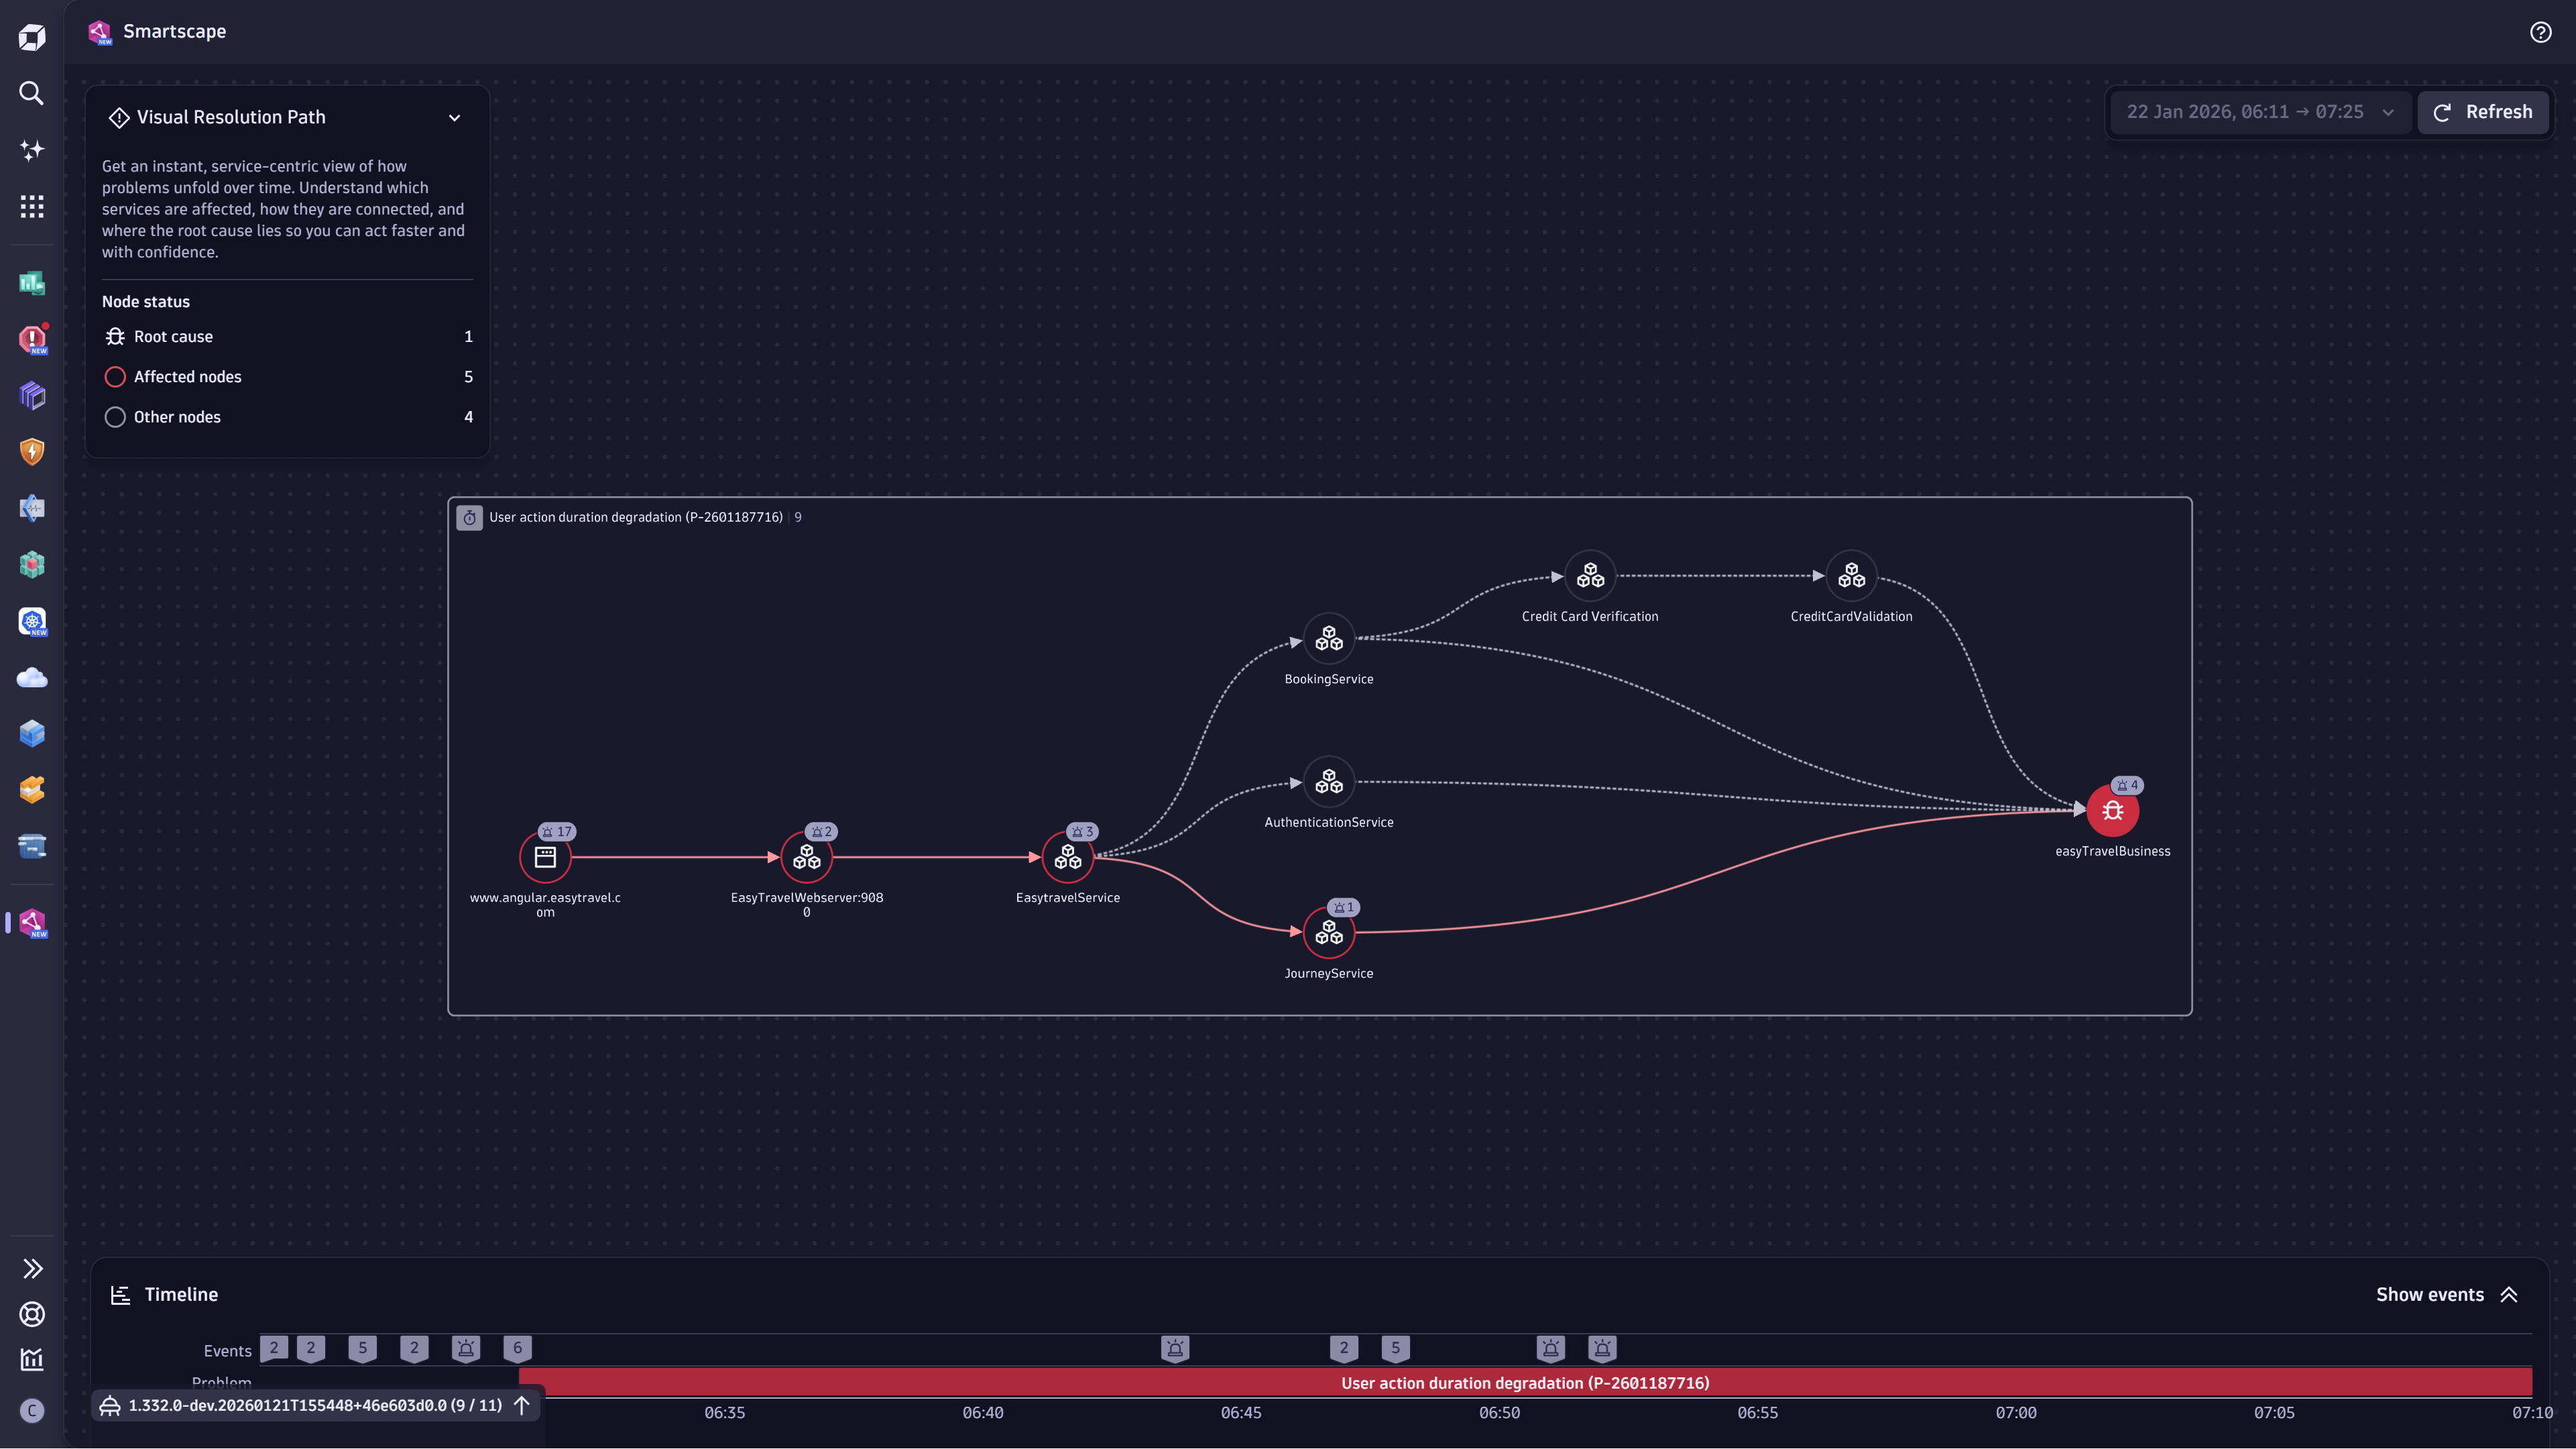
Smartscape®
Real-time dependency graph offering an always-accurate understanding of your entire IT landscape and topology.

Understand your digital systems like never before
Smartscape auto-enriches data with context, enabling autonomous operations powered by Dynatrace Intelligence.

Purpose-built for complex, short-lived IT systems
Zero overhead - Dynatrace automatically manages dependencies without manual tagging or manual upkeep required.
Always-accurate topology, no manual upkeep
Get up-to-date maps across all layers from infra to app, automatically updated as your system changes.
Instantly know cause, blast radius, and ownership
Understand upstream/downstream dependencies, who owns what, and impact—with no effort.
Foundation for Dynatrace Intelligence
Deliver unique capabilities, enabling auto-prevention, auto-remediation, auto-optimization.

The Smartscape technology is really impressive because it shows us a visual diagram of everything it's monitoring, and that allows us to see how systems are interacting in real-time.
Adrian Jacobs Senior Director of Business Engagement & Systems, IP Australia
Provides actionable answers, not just data
Deterministic context for autonomous operations
- Real-time dependency mapping across your entire stack
- Contextual analytics enable automated root cause
- Rapidly and holistically understand all agent interactions
- Context foundation for Dynatrace Intelligence
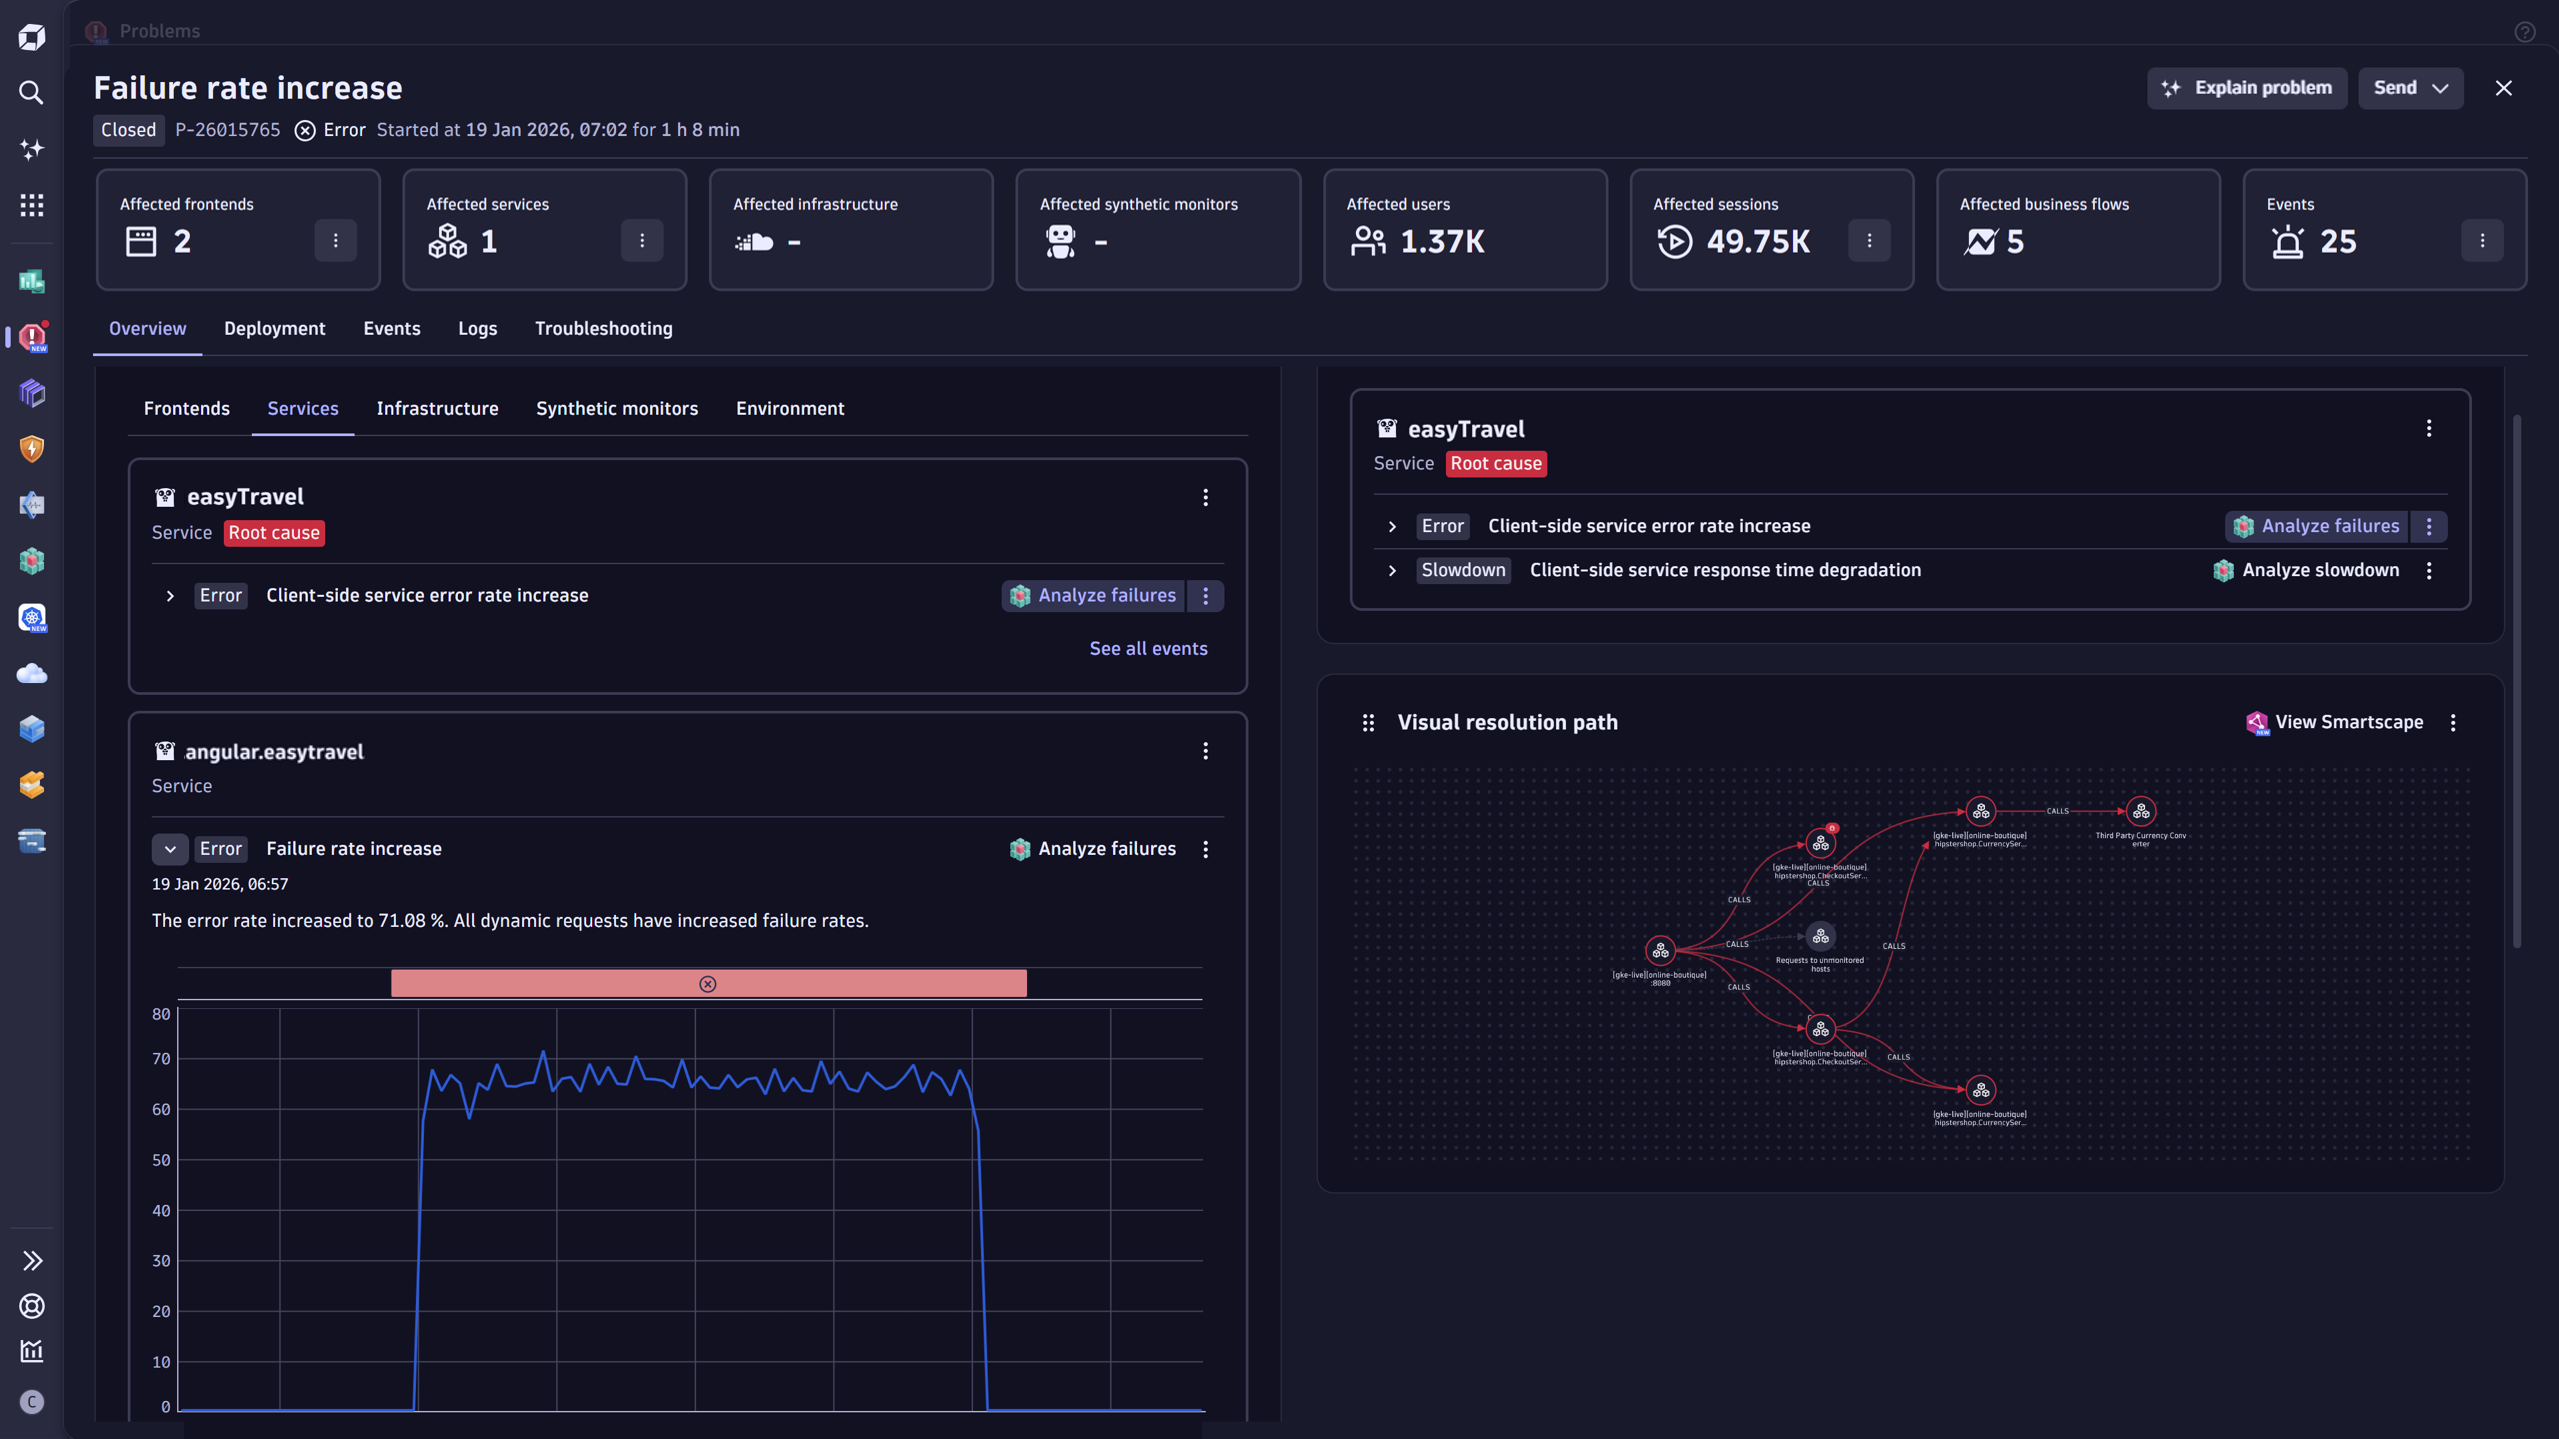
Accelerated incident response
- See exposure and risk in topology context and triage by business impact.
- Pinpoint root cause and blast radius in seconds with Dynatrace Intelligence.
- Route alerts to owners to cut handoffs.
- Speed up collaboration with visual resolution paths.
- Validate runtime vs. intended architecture to prevent drift and regressions.
- Facilitate auto-remediation with the deterministic and agentic AI capabilities of Dynatrace Intelligence
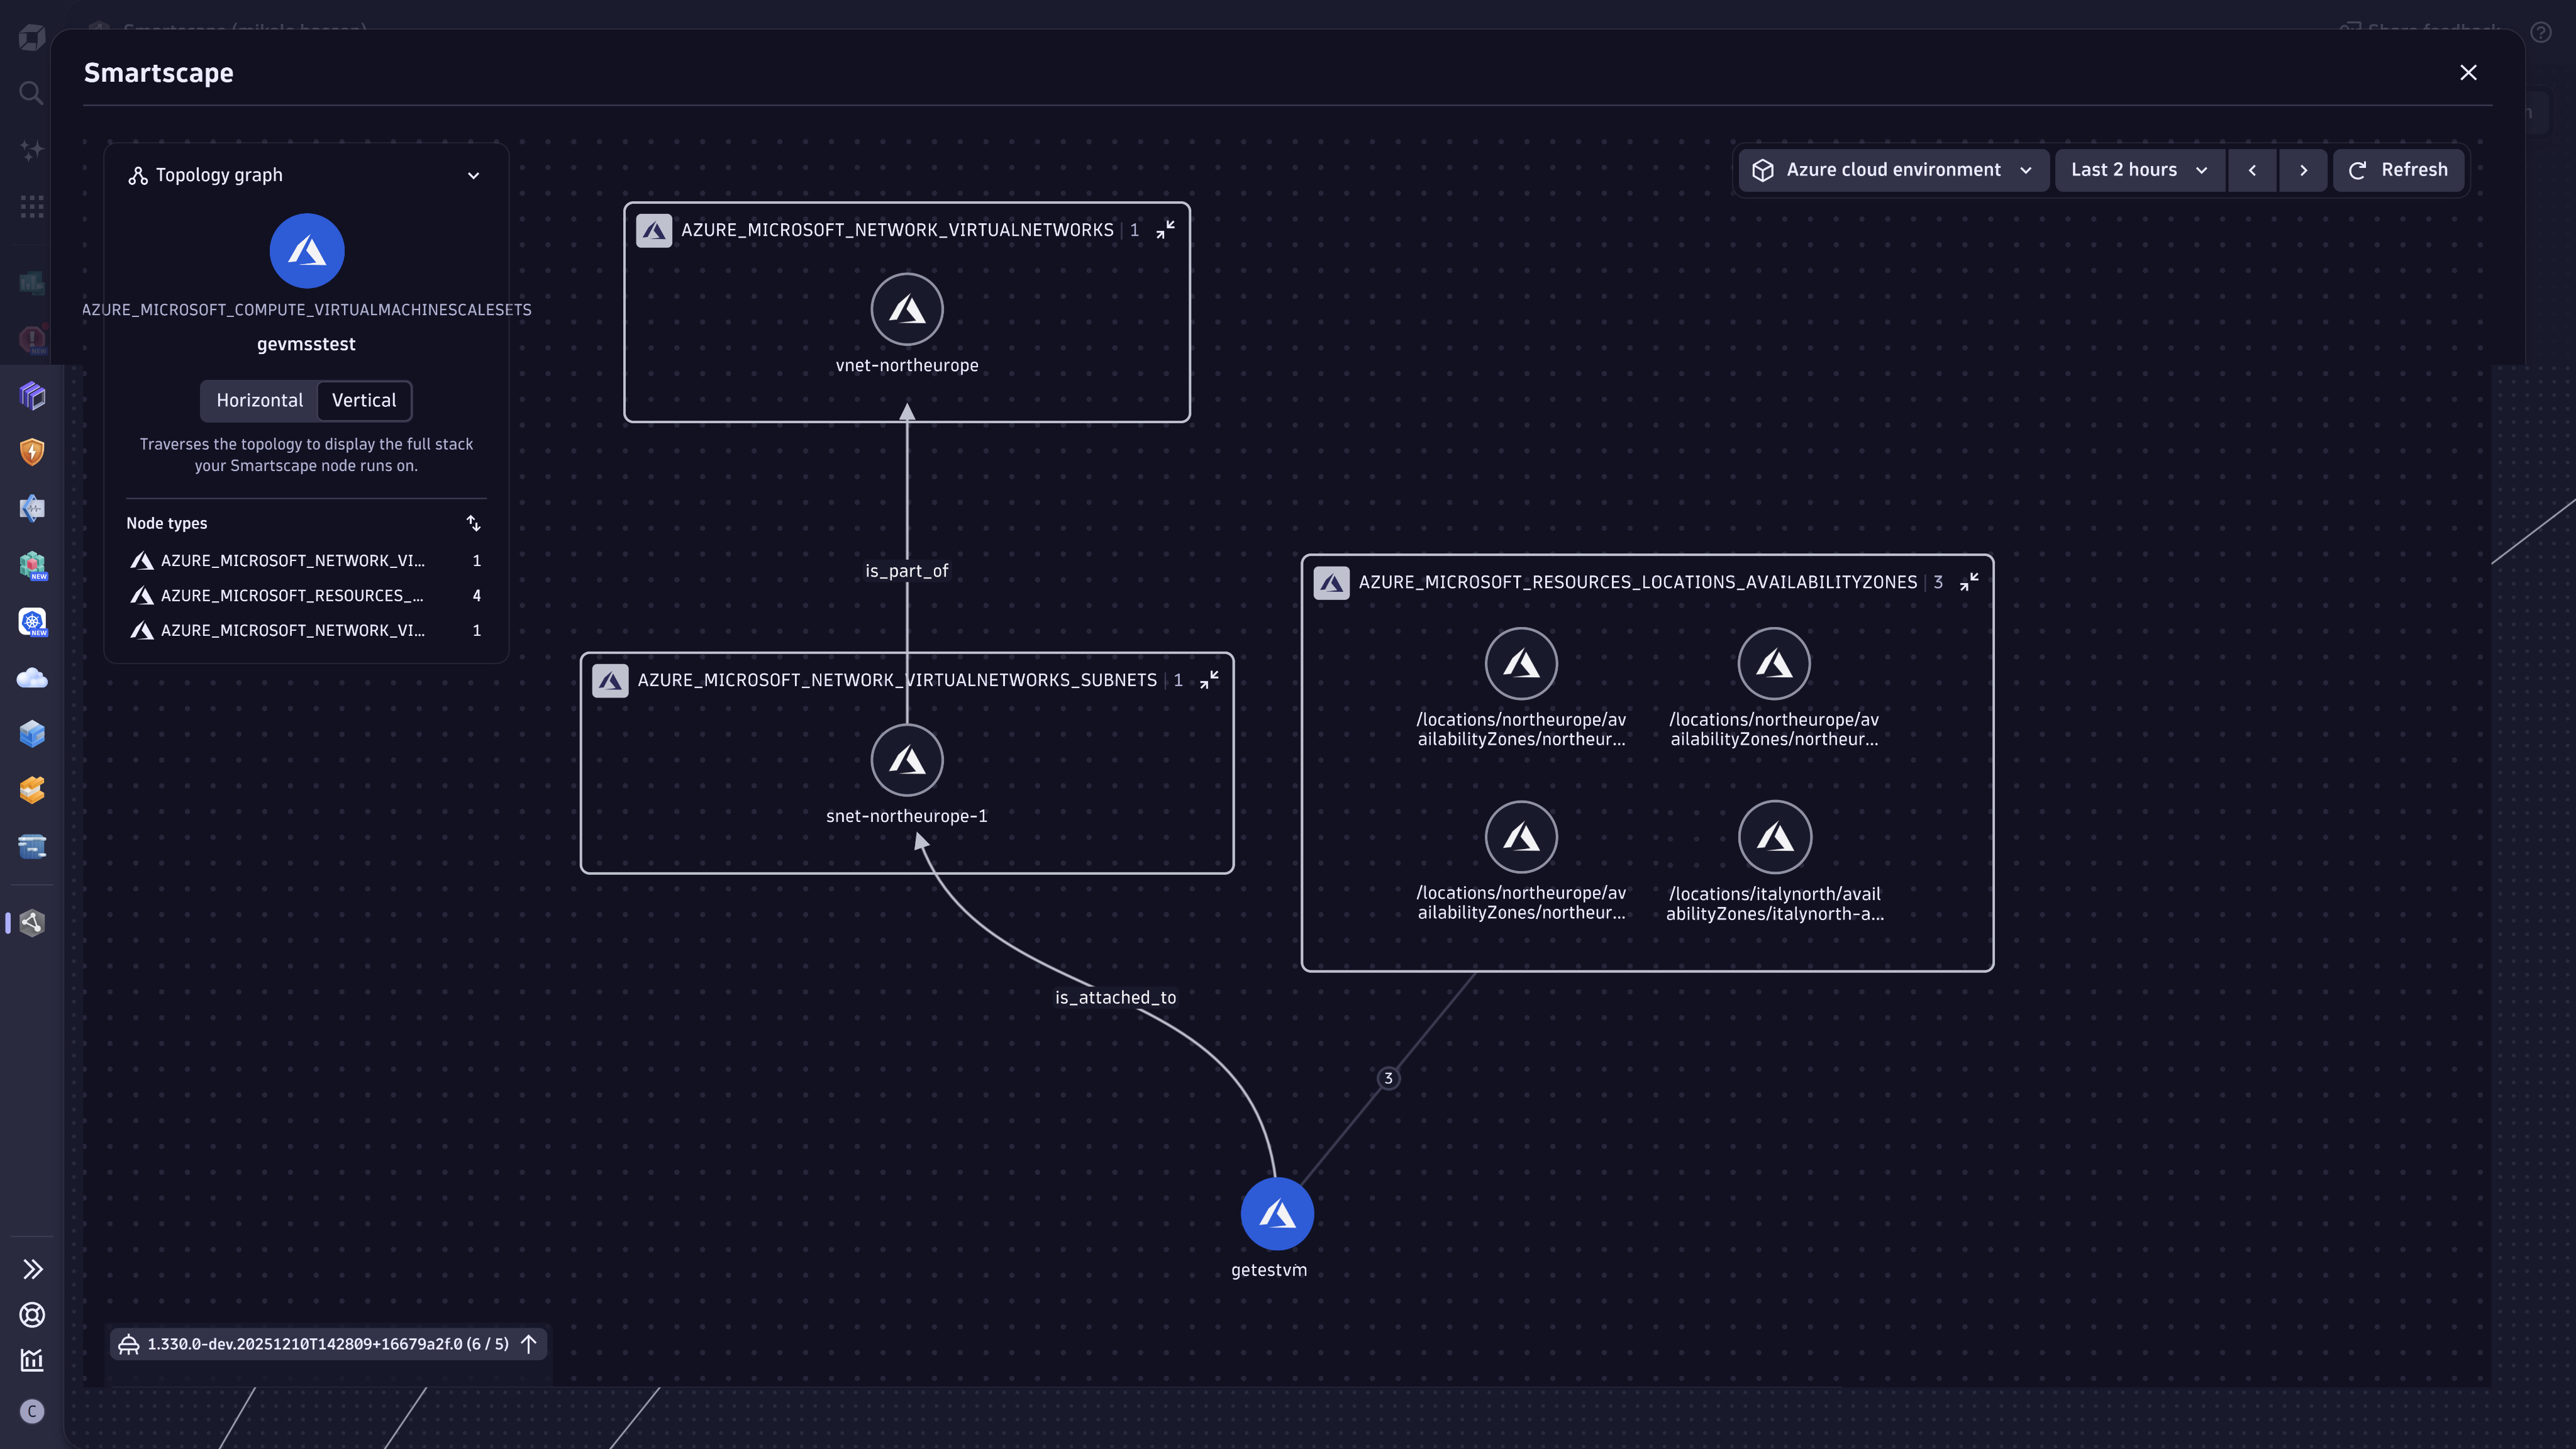
End-to-end visibility across AWS, Azure, and Google Cloud
- Close cloud console gaps with relationship context for rapid SRE decisions.
- Resolve issues faster using config detail, topology insights and contextual analytics.
- Act quickly with topology-aware data segments aligned to team ownership.
- Reduce cloud spend by finding inefficiencies across accounts and services.
- Strengthen end-to-end governance and security with precise, role-based IAM on topology.
- Get a unified topology across multi-cloud and on-prem.
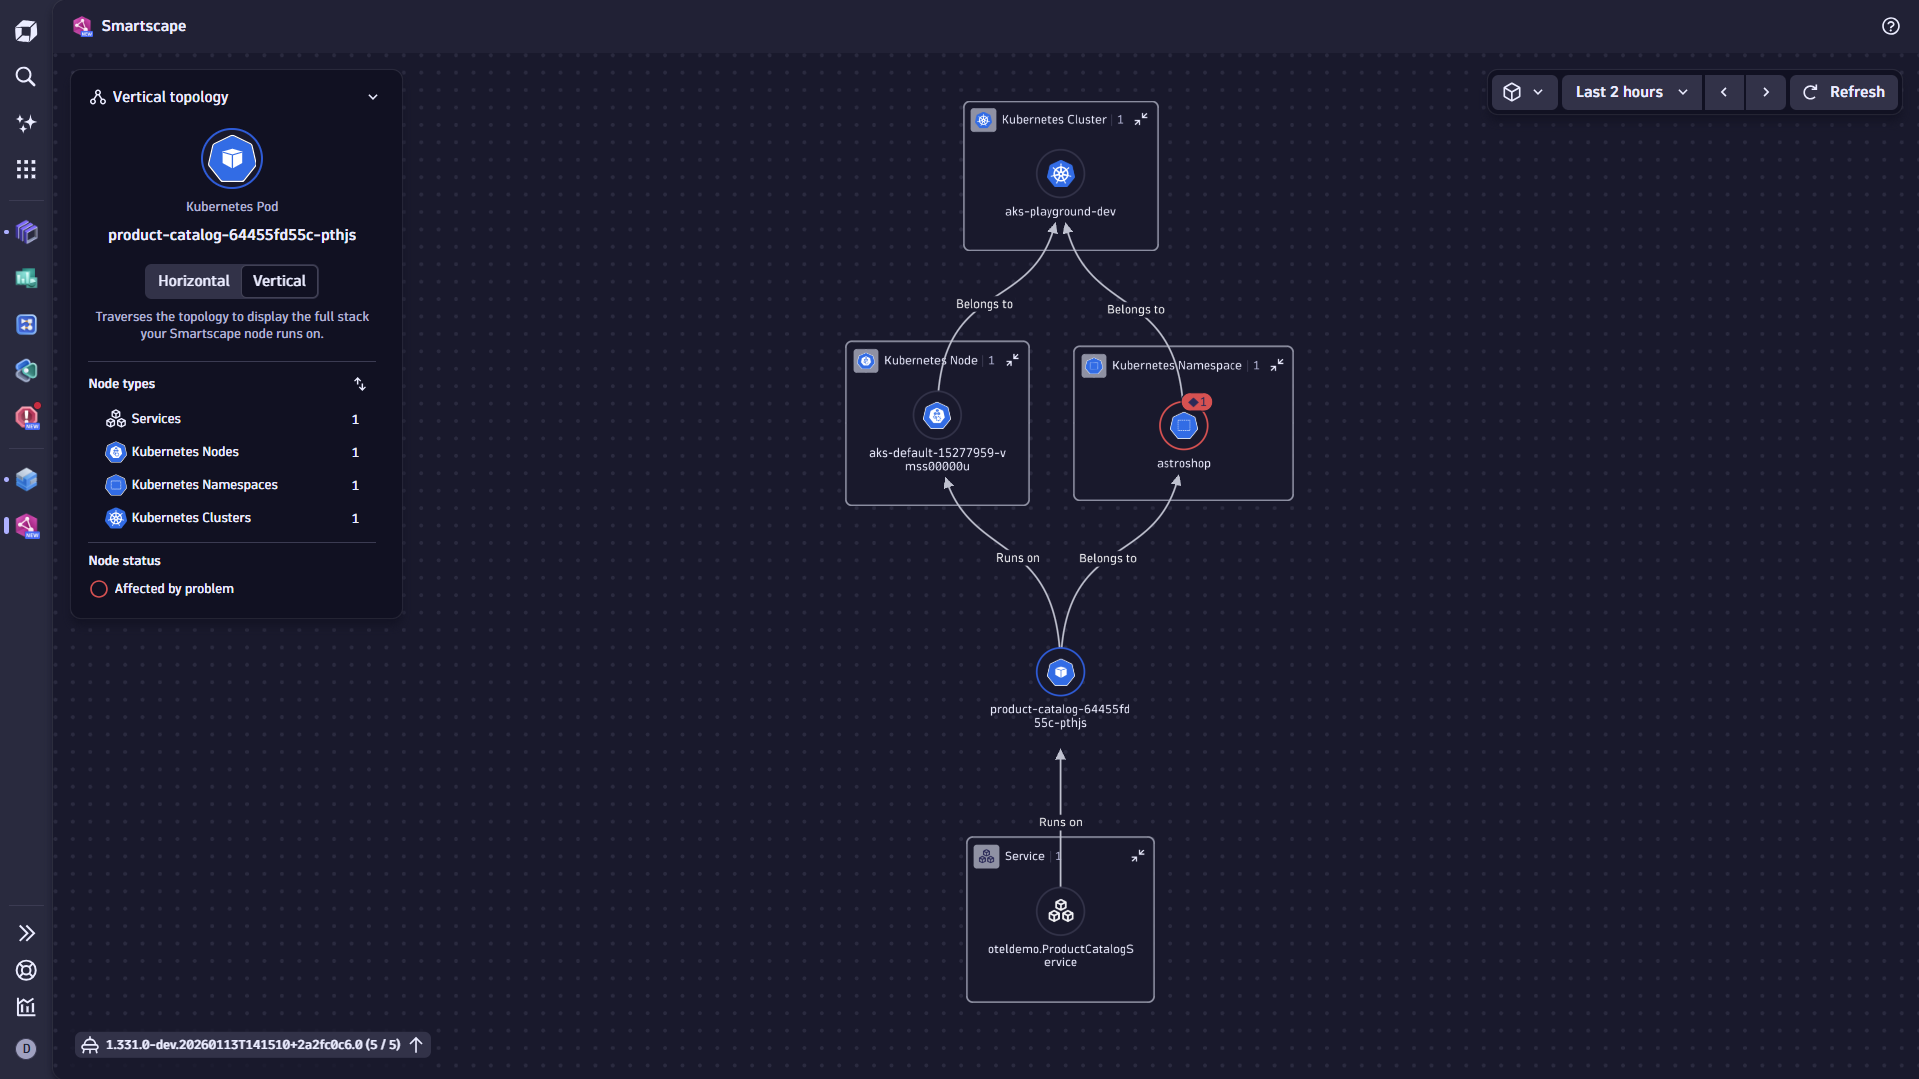
Understand Kubernetes dependencies immediately
- See full-fidelity Kubernetes objects in context for faster diagnosis.
- Direct YAML access surfaces misconfig, missing refs, and policy violations.
- Trace relationships across clusters, namespaces, workloads, services.
- Isolate drift and risky changes quickly with intuitive visual exploration.
- Keep ephemeral updates visible to cut break/fix loops and MTTR.
- Auto-remediate and auto-prioritize issues for optimal Kubernetes functionality with Dynatrace Intelligence.
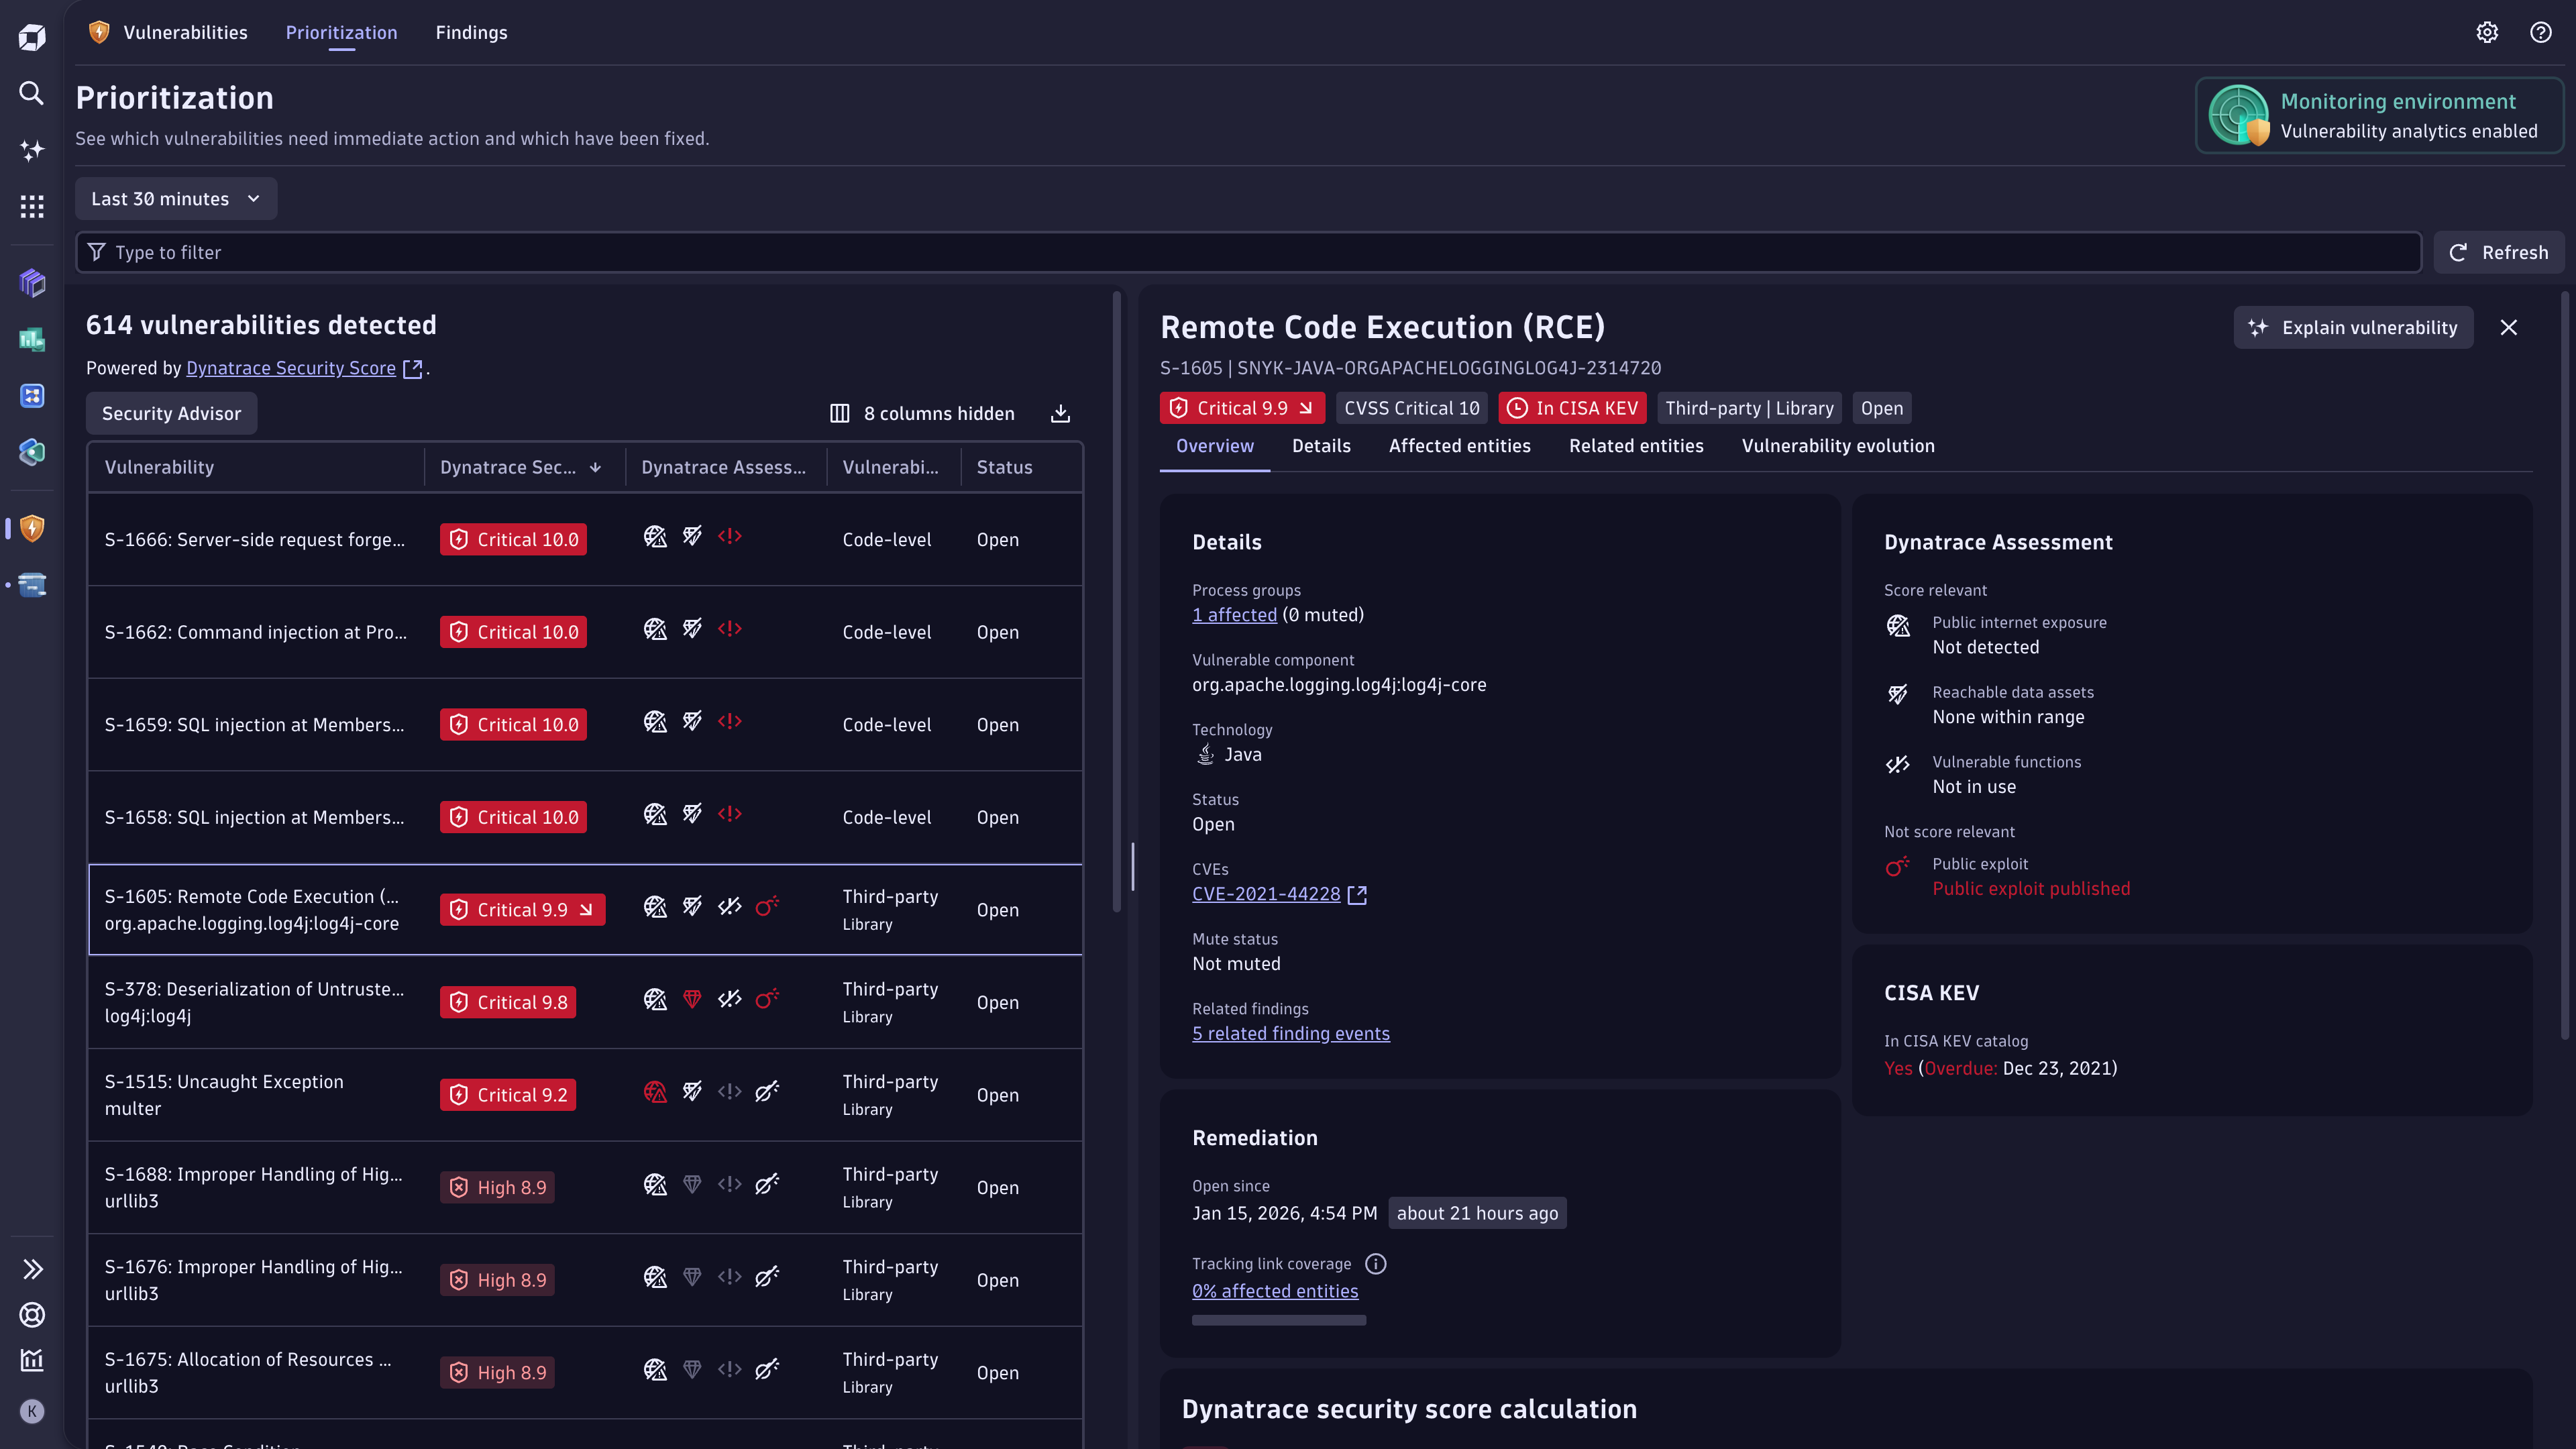
Improve security posture and response through context
- Visualize security exposure and attack vectors to prioritize fixes.
- Combine entity context with signals to triage real risk.
- See blast radius and affected entities for targeted response.
- Surface IAM issues and misconfig to enforce best practices.
- Auto-prioritize remediation by business criticality or compliance requirements with the deterministic and agentic AI capabilities of Dynatrace Intelligence.