
The OneAgent advantage
The "hands-free" agent automates 100% full-stack monitoring

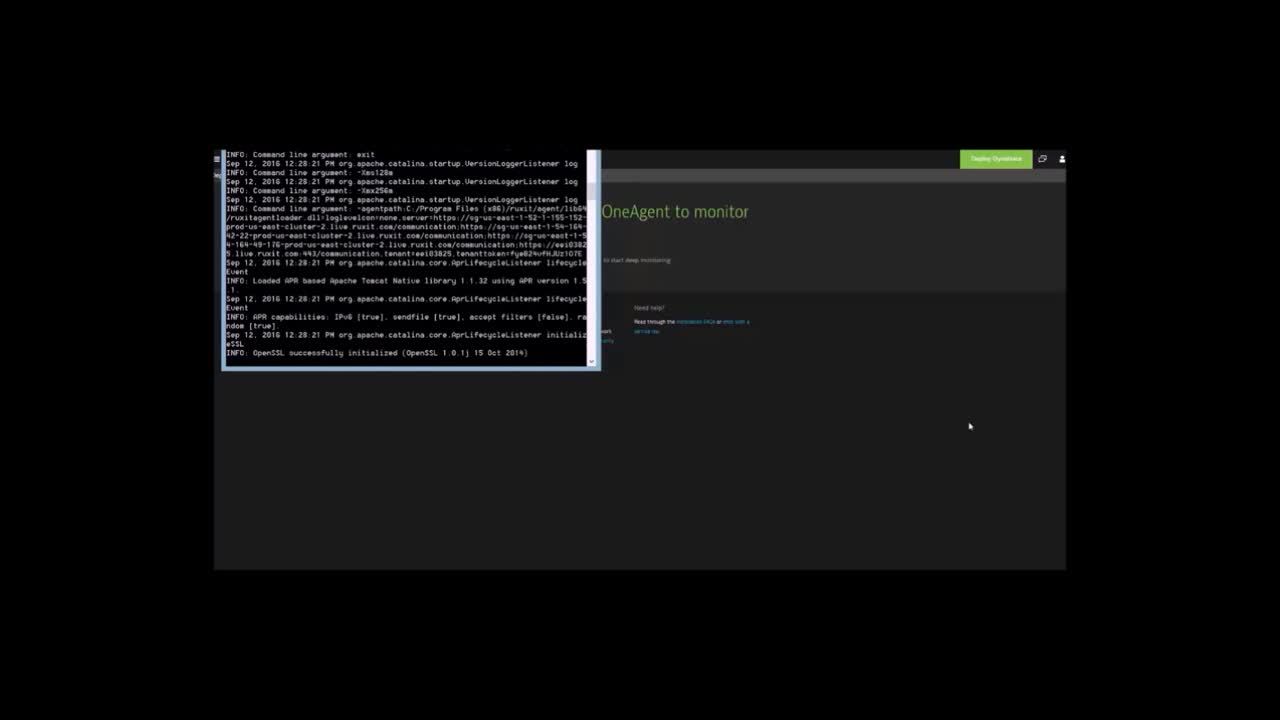
Install OneAgent one time, forever—zero manual configuration
With Dynatrace, install OneAgent only once per host to begin collecting all relevant metrics along 100% of your application-delivery chain. Install it and forget it—we take care of everything.
With just a couple of mouse clicks, Dynatrace OneAgent discovers whatever processes you have running on the host. Based on what it finds, OneAgent automatically activates instrumentation specifically for your stack, as well as auto-injecting tags into web application pages. New components get auto-instrumented on the fly.
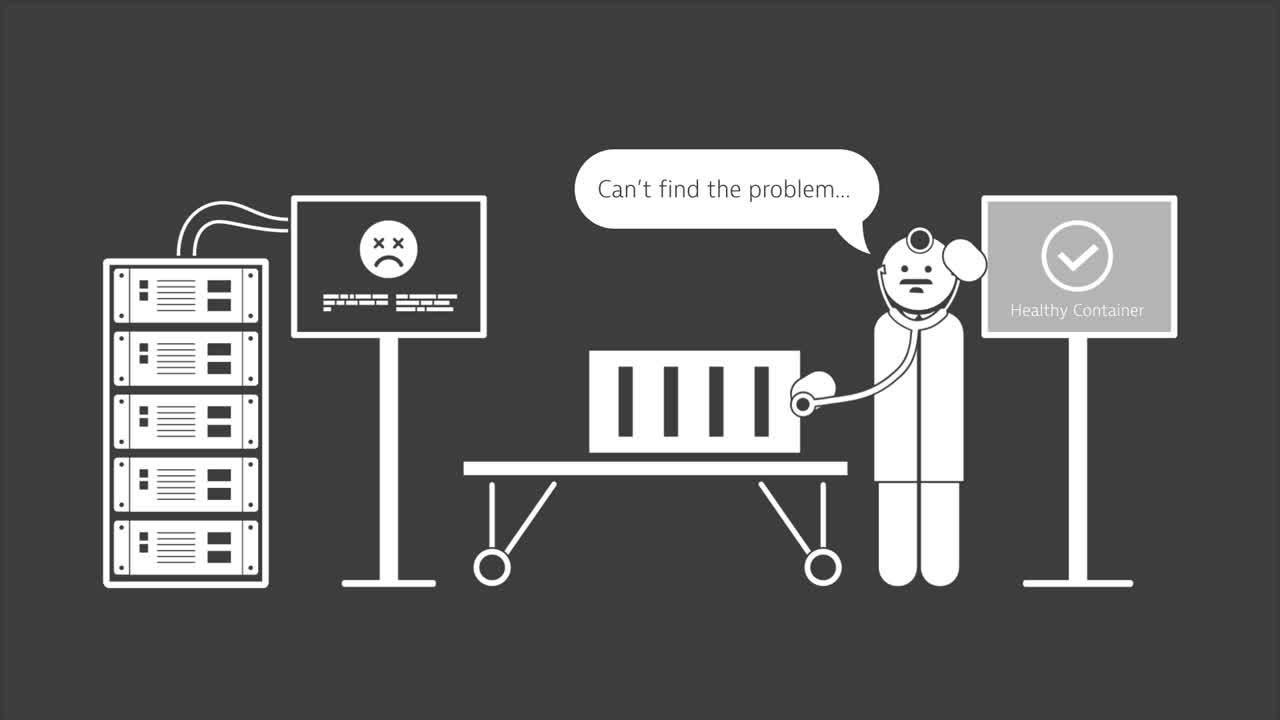
- Other APM solutions make you install multiple different agents per host for monitoring servers, applications, databases, real user monitoring, and so on.
- Some vendors require you to manually code each and every HTML page to get real user monitoring.
- OneAgent works for most technologies right out of the box—no need to cobble together various agents and plug-ins, have any specialized technical knowledge, or configure anything manually.
What exactly is OneAgent?
Dynatrace OneAgent is essentially one binary file comprising a set of specialized services that have been configured specifically for your monitoring environment. These services collect metrics on various aspects of your hosts, including hardware, operating system, and application processes. The agent can also monitor specific technologies (Java, Node.js, .NET, and more) in greater detail by injecting itself into those processes and monitoring them from the inside. This provides you with code-level insight into the services that your application relies on.
For real user monitoring, Dynatrace OneAgent injects a JavaScript tag into the HTML of each application page that is rendered by your web servers. With these tags in place, the agent can monitor the response times and performance experienced by your customers in their mobile and desktop browsers.

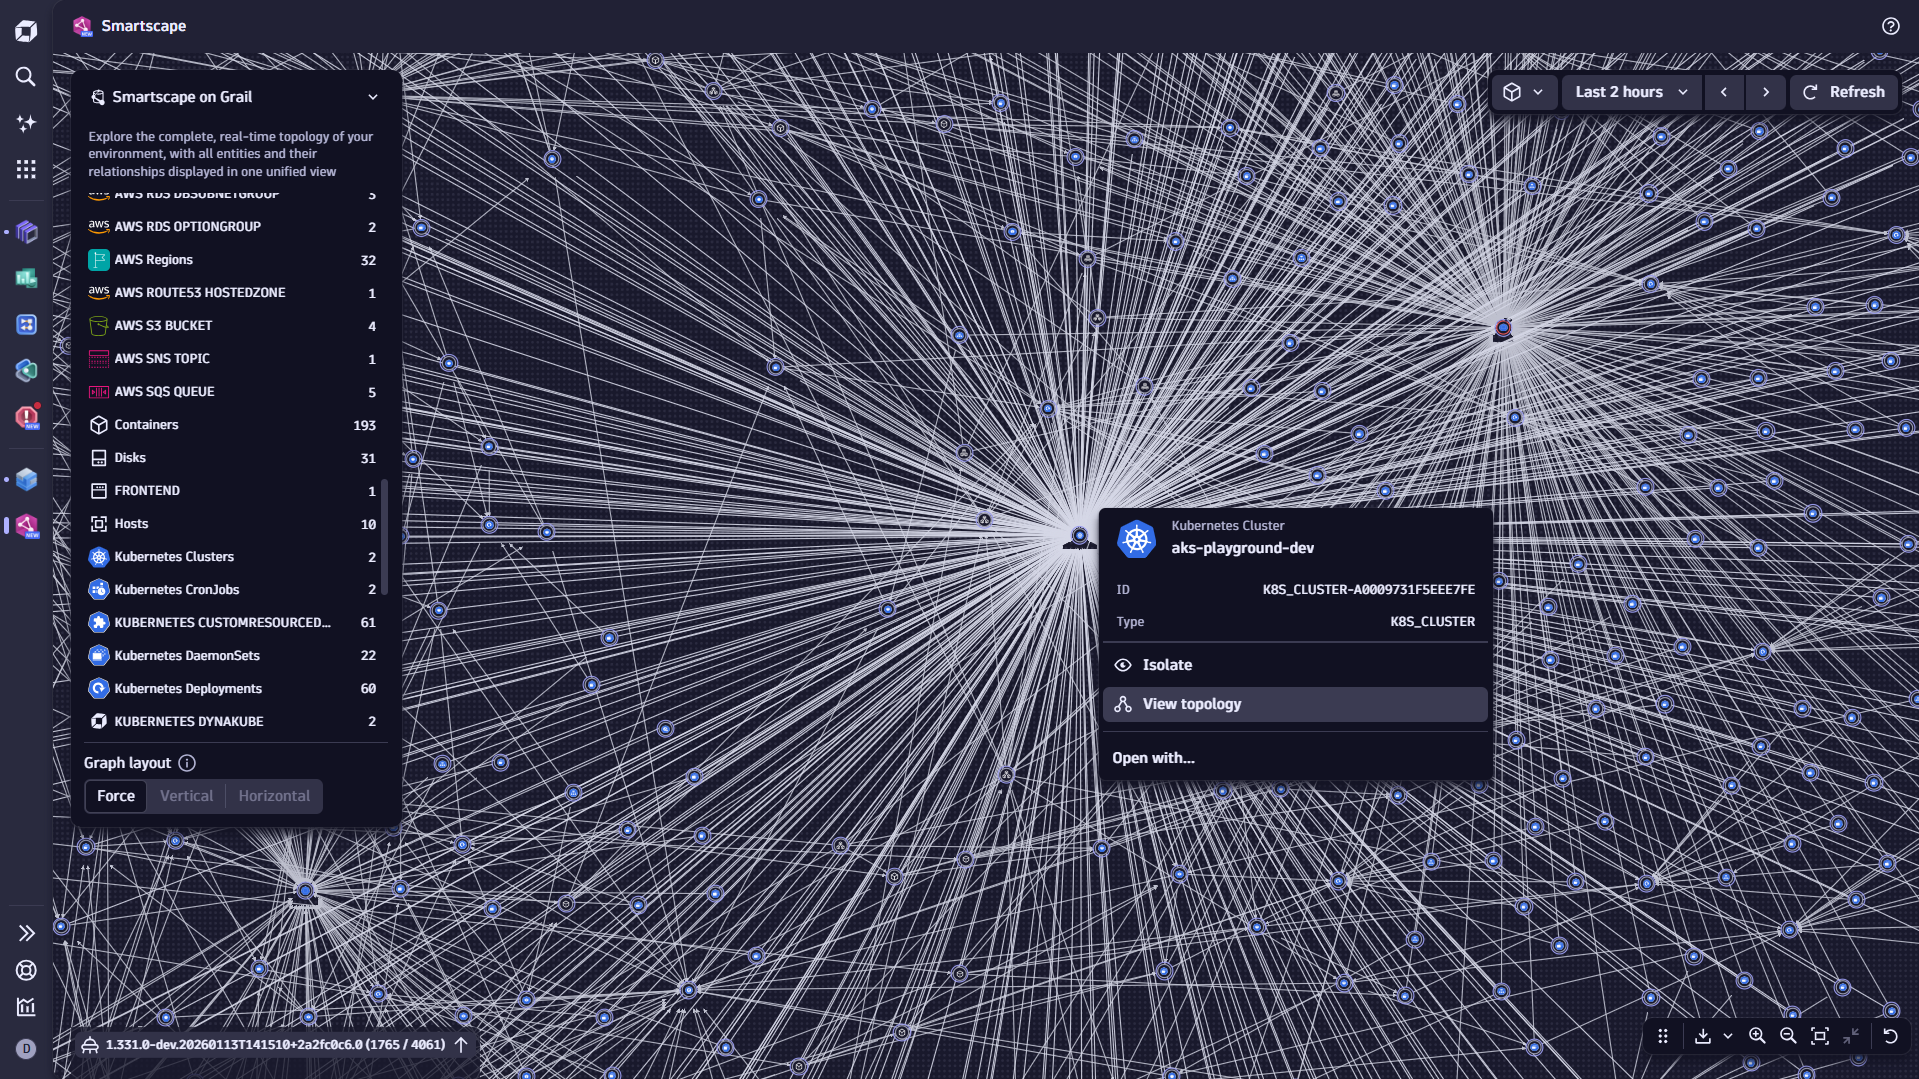
Automated end-to-end data collection
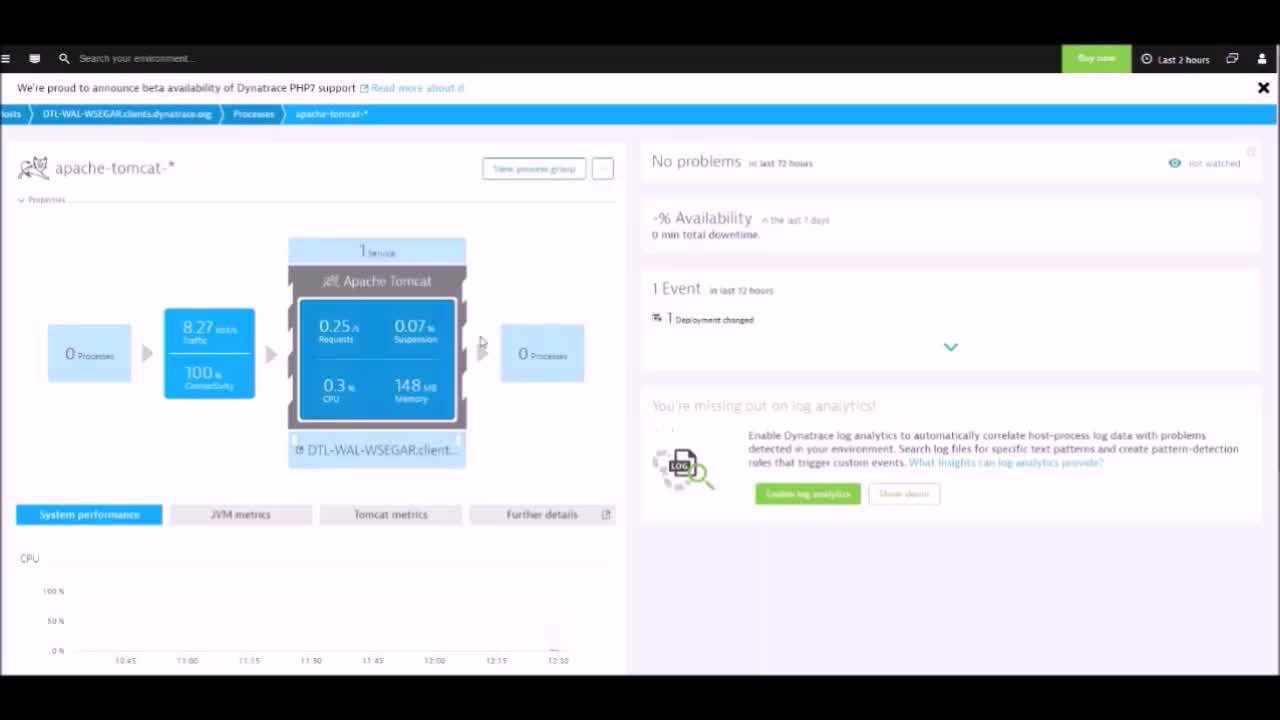
OneAgent is the only agent on the market that can go out and collect metrics throughout every tier of your application stack automatically. In under 5 minutes, you get all the (operational and business) performance metrics you need from front end to back end and everything in between—cloud instances, hosts, network health, processes, and services. If you're running it, OneAgent is capturing data about it.
- Only Dynatrace shows you process-specific network metrics.
- Other agents cannot collect information on all application levels automatically.
- Only Dynatrace captures performance metrics on applications running inside containers without needing to install an agent on every container.

Dynatrace was installed within a day and we immediately saw value with issues identified that needed to be addressed, including one in a high value channel that was impacting performance for customers.

Unified data by design
How can you tell the business impact of an infrastructure failure? Or how each service contributes to application performance? The OneAgent approach was designed to collect front-end and back-end metrics into a single unified data repository. Having a complete, directly connected set of in-context data is what enables Dynatrace to connect the dots among business metrics, real user experience, and operational performance, down to the code level.
- Other APM data collection is not unified by design, but rather a bunch of tools, configurations, and data repositories pinned together.
- Multi-agent approach of other APM results in "data silos"—forcing you to stitch together disparate sets of metrics to get the full picture.
- Unified data model ensures consistent "single source of the truth" for all stakeholders. No need to jump through hoops or calibrate anything.

Hassle-free updates, future-proof scalability
Once you install Dynatrace OneAgent, you're set for life. Migrating to the cloud? No problem. Introducing new stack technologies like microservices and containers? Got it. The approach of installing OneAgent once was designed specifically with hyper-dynamic environments in mind.
- Scale up to 100,000+ hosts distributed around the globe.
- Updating is painless. It all happens automatically—you don't have to do a thing.
- Other APM tools put you through the nightmare of manually touching hundreds of different components.


Try it free


Dynatrace named a Leader in the 2026 Gartner® Magic Quadrant™ for Observability Platforms
Read the complimentary report to see why Gartner positioned us highest for Ability to Execute in the latest Magic Quadrant.
This graphic was published by Gartner, Inc. as part of a larger research document and should be evaluated in the context of the entire document. The Gartner document is available upon request from Dynatrace. Dynatrace was recognized as Compuware from 2010-2014.

