
In December I announced my “Share Your AI-Detected Problem” and I started my series by highlighting 3 problem patterns that I had seen detected by the Dynatrace AI. At our PERFORM 2018 User Conference at the end of January, there was a lot of talk about the AI and that there is even more data it can analyze thanks to the recent announcements: Log Analytics, End User Session Replay, Extended APIs, etc…
At PERFORM we also had several breakout sessions where our users highlighted the benefit the AI brought to their teams in the last months. Among them, are users that I consider the “crème de la crème” of performance engineers. These are the people that can do magic when it comes to analyzing performance data and finding root cause. But even these “experts” say: “I wouldn’t have even thought about looking at these data points the AI looked at. Amazing what problems it finds!”
If you see Dynatrace’s AI in action in your own environment and come across moments like this don’t hesitate to drop me an email. I would love to educate our readers about the real-life impact our Dynatrace AI has on teams around the globe!
Now back to the problem patterns that want to share with you in this blog.
#1: RabbitMQ Socket Usage Issues
Would you have thought of looking at socket usage when it comes to RabbitMQ? Would you even know how to get this metric? Dynatrace OneAgent automatically monitors RabbitMQ for you – including all key metrics that we know are essential to ensure healthy RabbitMQ operations. Check out the blog post from Jakub Mierzewski on Introducing RabbitMQ monitoring with Dynatrace if you want more background on how this feature works.
Once RabbitMQ monitoring is enabled, Dynatrace automatically alerts in case key metrics such as Socket usage reaches a critical limit that potentially impacts your end users or service SLAs. Here is a screenshot showing how this looks like in real life:
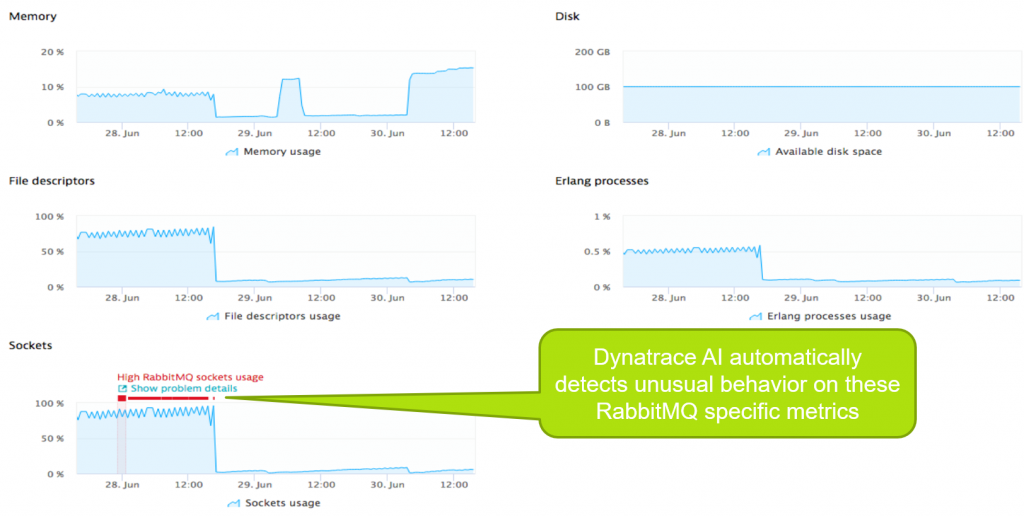
Being pro-actively alerted on shortage of resources such as available sockets is also a key ingredient for auto-remediation or auto-scaling actions. Remember my recent blog post where I talked about how to use Dynatrace AI Detected Problems to trigger Auto-Remediating Actions?
#2: Network Retransmissions impacting Cassandra
The network is the backbone for all our applications and services. If the network is unhealthy, it automatically impacts service health as well as service to service health. The following example shows how the Dynatrace OneAgent automatically monitors your network interfaces as well as all TCP/IP network connections between our services. There are several metrics Dynatrace automatically monitors. If you want to learn more check out Dirk’s blog on Detecting network errors and their impact on services.
The following example was brought up during a PERFORM 2018 breakout session. We see that a problem on a network interface caused high retransmissions – impacting the Cassandra database residing on that host:
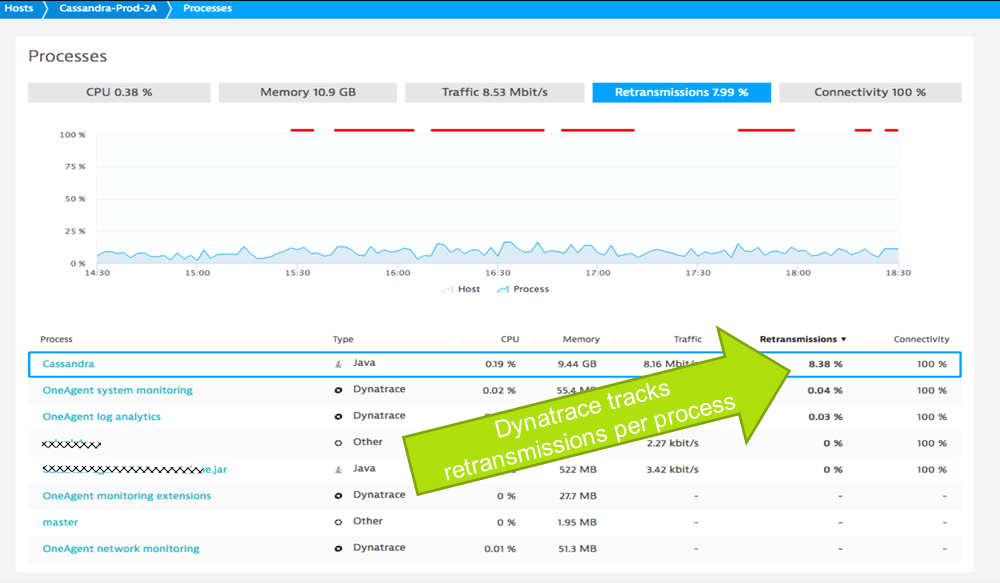
Based on Dirk’s blog, retransmissions higher than 2% will negatively impact your end user experience or SLAs. Therefore, it is important to pro-actively react on this problem before it becomes a real problem. We can use the Dynatrace AI-Detected problems and trigger a remediating action or at least inform the network team to provide more bandwidth, check routings, figure out if there might be faulty hardware causing this issue or if something else is going on drives retransmission rate up that high.
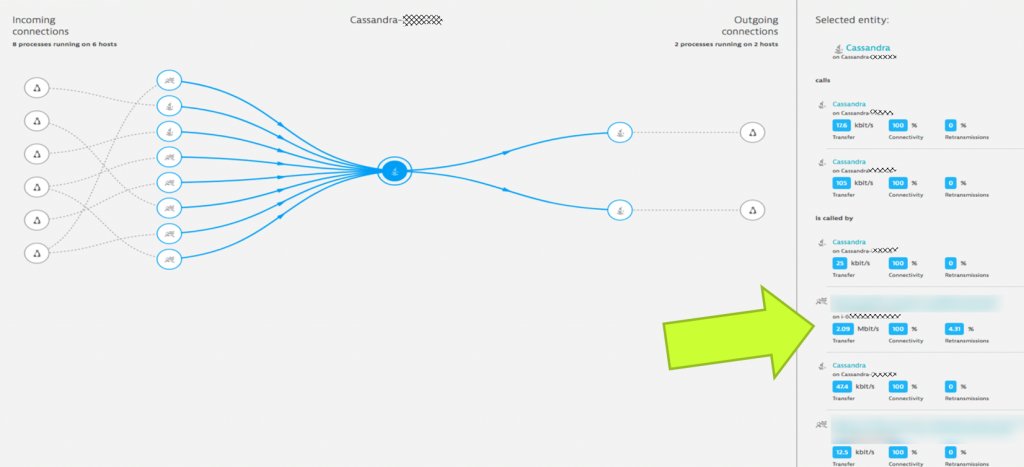
Dynatrace even provides this type of information on individual TCP/IP connections between processes. There is a view called “Process Connections” which you should check out. Here is how it looked like in this example – showing the retransmission between Cassandra and the Tomcat instance running a microservice:
#3: High GC after JVM Memory Setting Change
Years back we wrote a Java Performance Book with a full chapter dedicated to Java Memory Analysis. Mike Kopp did a great job explaining how Java Memory Management works and how you can tweak the heap sizes and Garbage Collection settings.
Dynatrace automatically monitors all your heaps and GC activity. Dynatrace OneAgent figured out which JVM you are running and based on the configuration will automatically monitor all relevant JVM metrics. On top of that Dynatrace automatically detects unusual high GC activity, high memory usage or anything related to memory that potentially impacts your SLAs or end user response time.
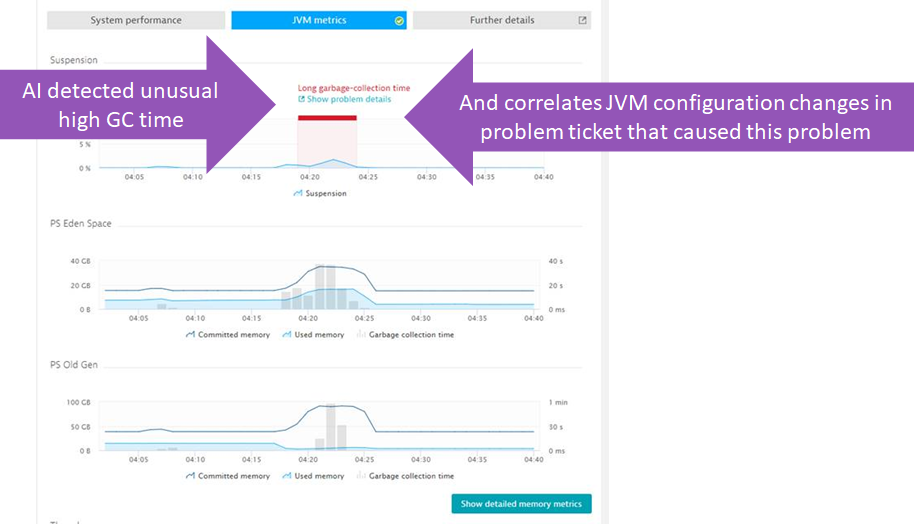
The following screenshot shows how Dynatrace detected unusual high garbage collection on one of the JVMs. This was presented at another PERFORM 2018 Breakout Session. But it doesn’t stop with alerting about a potential performance impact. Dynatrace also understands all configuration changes that happened on that JVM during that time and immediately shows these details in the Events section of the Java Process:
I have been talking with many AppServer operators & architects. Tuning memory settings is often done through experiments, e.g: let’s try this setting and see how the JVM behaves different. That approach is perfectly fine but it requires a lot of manual interaction.
With Dynatrace, we can completely automate that process. You can apply your configuration changes, such as different GC settings or heap sizes. If Dynatrace detects a negative impact based on these new settings we can trigger an auto-remediation script that reverts that setting or simply tries a new one. With this you can completely automate a sequence of experimental settings until Dynatrace tells you that you found a setting that is best for your services and end users.
If you want to learn more about this check out my blog on the Unbreakable Pipeline as well as my Self-Healing blog post.
Learn more about how the Dynatrace AI can make your life easier!
The biggest challenge I see in our industry is that we simply can’t keep up with how our environments scale. Instead of one monolith we have hundreds of services. Instead of a service we will end up having several serverless functions. Nobody can be expected to be an expert in all these technologies and stacks. Nobody can be expected to know which metrics to look at and how they correlated with each other.
We MUST EXPECT our monitoring solution to provide that expertise. And this is what we have done with our Dynatrace OneAgent and the AI that sits on top of the data. With my blogs I hope to educate and show you that behind all the magic there is a lot of expert knowledge we put into our algorithms. The good news is that these algorithms can scale – in the same way as you scale your infrastructure and platforms.
Try it yourself. Sign up for the Dynatrace SaaS Trial or let us know if you want to install it On-Premises. In both cases – send me your stories. Let’s use them to educate more people about real life problems we can address!


Looking for answers?
Start a new discussion or ask for help in our Q&A forum.
Go to forum