
Skip to technology filters Skip to main content
Dynatrace Hub

Extend the platform,
empower your team.

Popular searches:
Home hero bg
Kiro CrewKiro Crew
Kiro Crew

Kiro Crew

Triage Dynatrace problems on a Kanban board inside Kiro Crew.

Technology
Free trialDocumentation
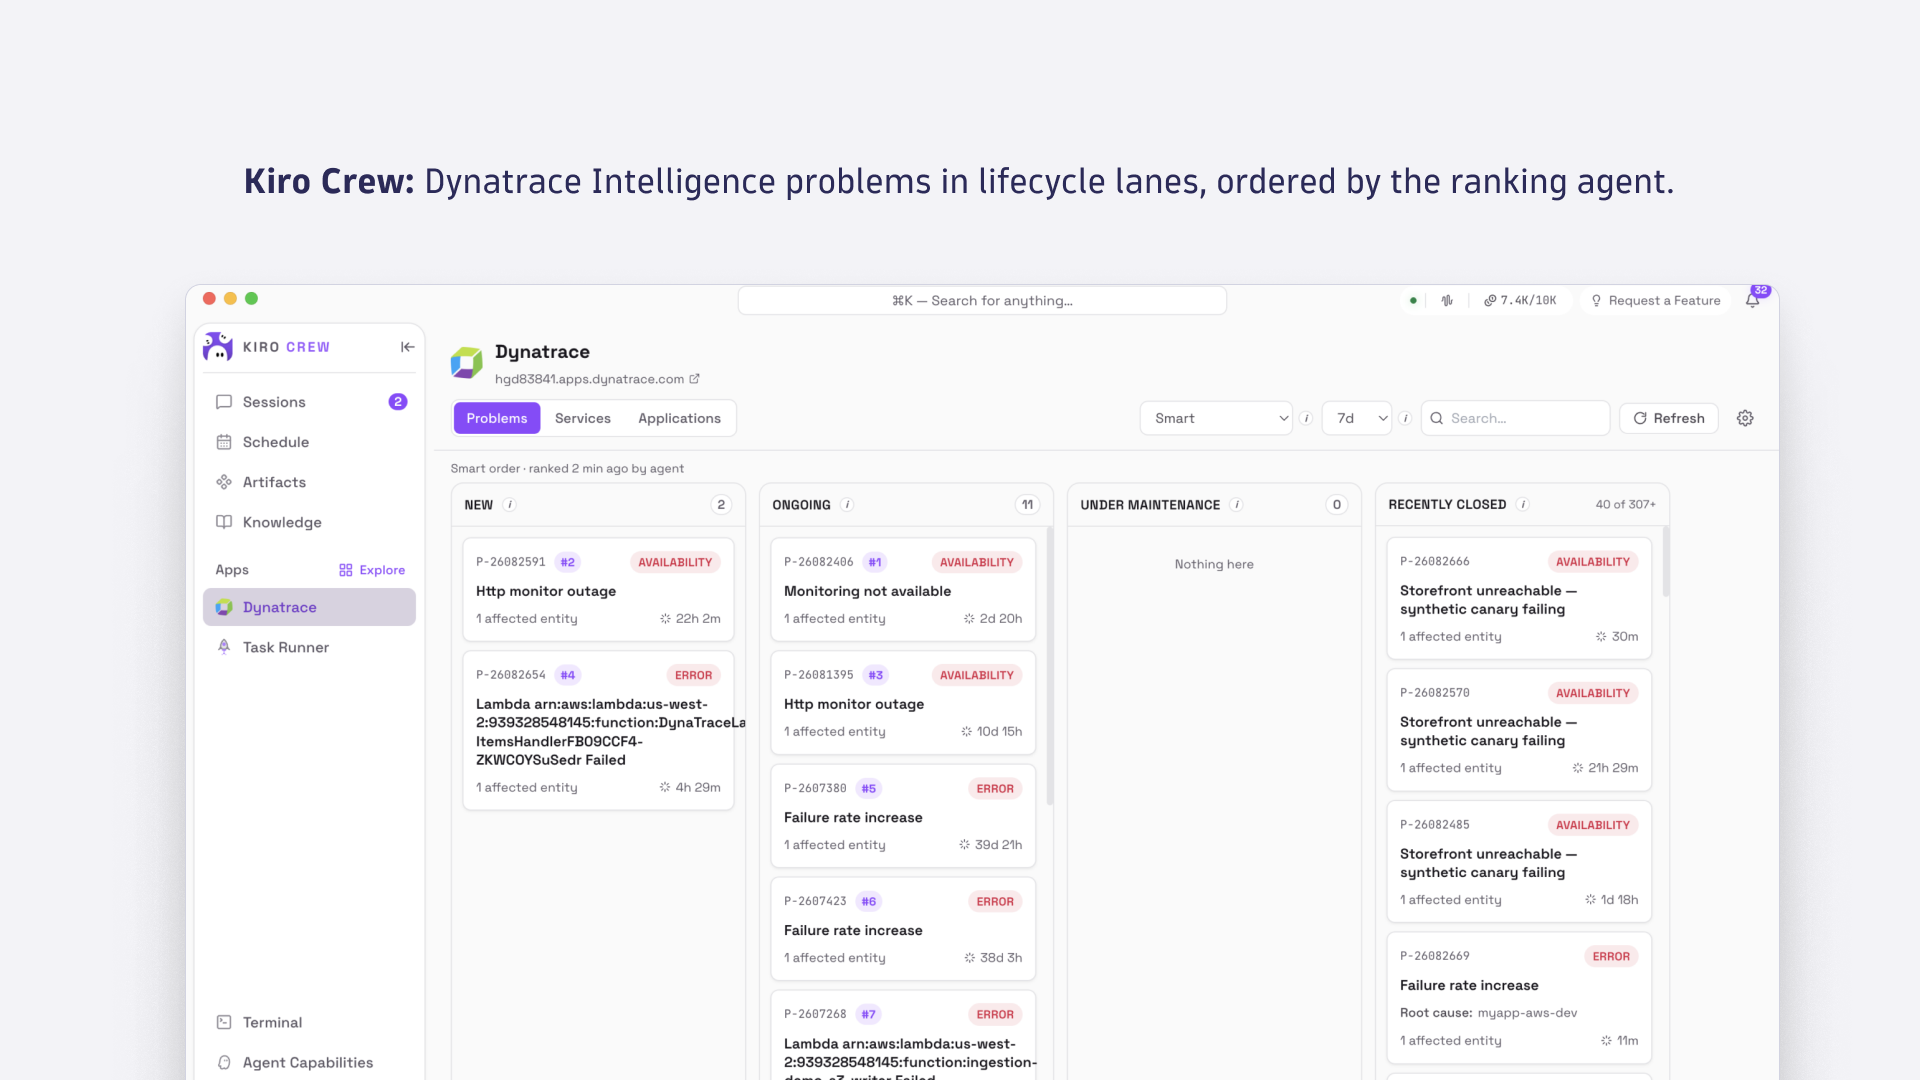
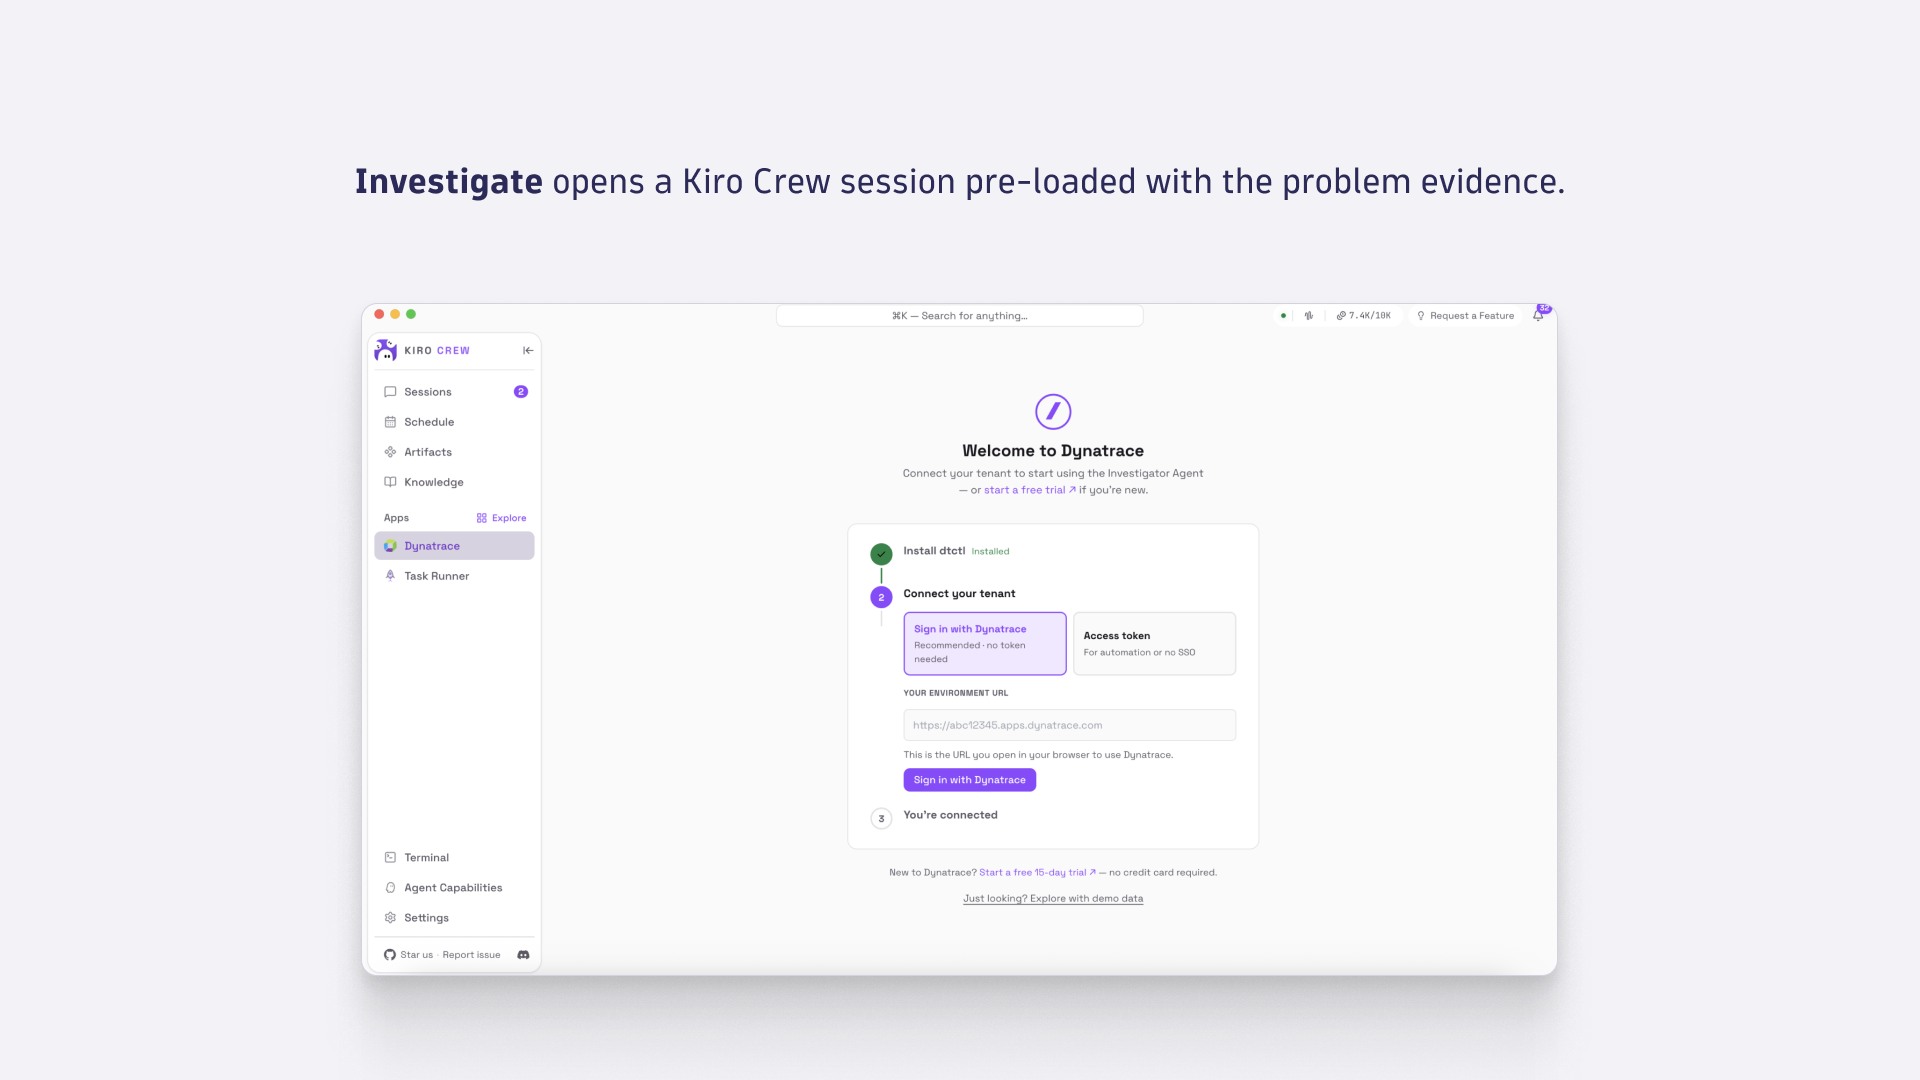
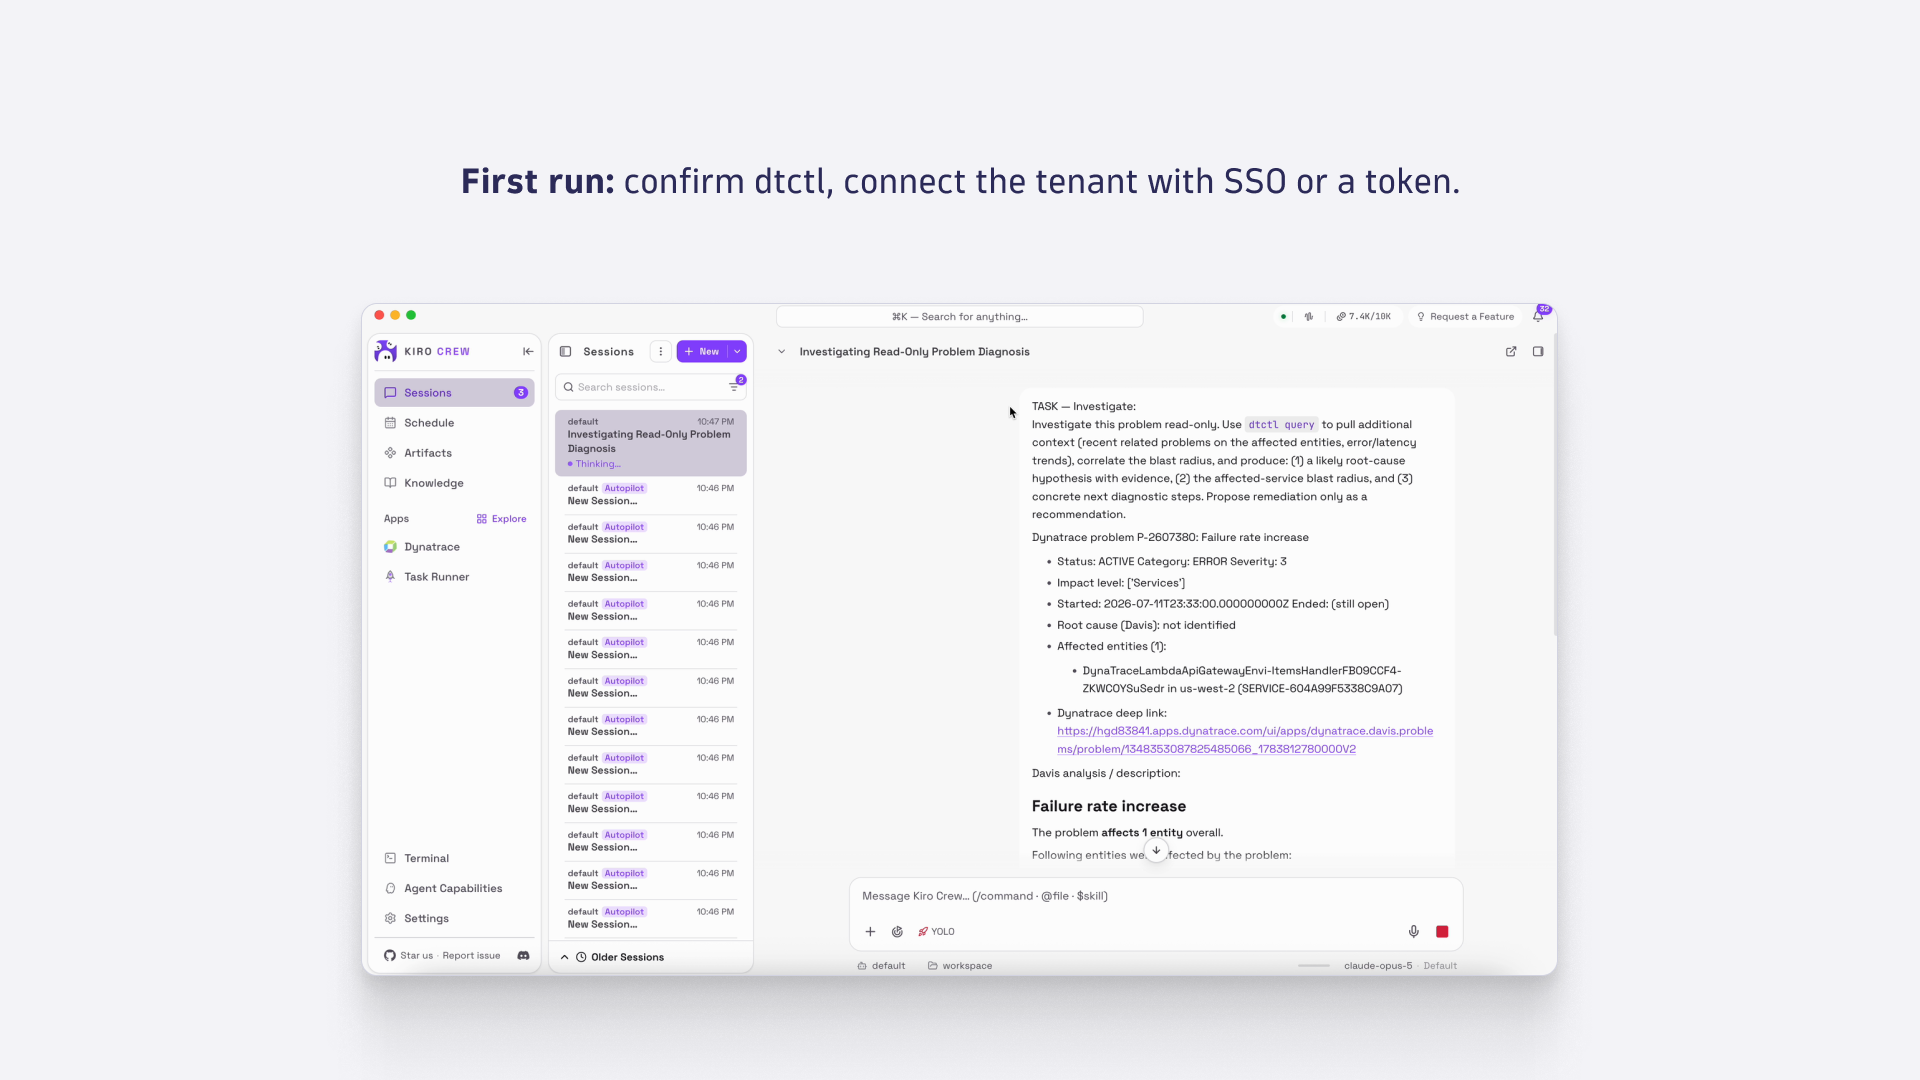
Dynatrace Intelligence problems in lifecycle lanes, ordered by the ranking agent.Investigate opens a Kiro Crew session pre-loaded with the problem evidence.First run: confirm dtctl, connect the tenant with SSO or a token.
  • Product information

Overview

The Dynatrace app for Kiro Crew, the agent workspace from AWS, turns it into a Kanban control tower for your environment, so engineers triage live Dynatrace Intelligence problems where they already direct their agents. It runs on your machine against your tenant, open source under Apache 2.0.

Main capabilities include:

  • Problems arrive on a board instead of a list, in four lifecycle lanes: New, Ongoing, Under Maintenance, and Recently Closed. Each card carries the problem ID, title, category, affected entity count, age, and any root cause Dynatrace Intelligence has found.

  • Two further views switch the board to services and applications, grouped into Unhealthy, Watch, and Healthy by correlating each entity with the problems that reference it.

  • A Kiro Crew agent ranks the active problems and gives each card a one line rationale, weighing category, blast radius, root cause presence, age, and recurrence. The ranking is a suggestion, not a mandate: deterministic sorts by severity, age, blast radius, or duration stay one click away.

  • Opening a card reveals the full record and a deep link into the Dynatrace Problems app. Investigate opens a Kiro Crew session seeded with the problem's facts and a read only instruction; Summarize composes a write up for a standup or an incident channel.

  • Everything is read through dtctl, the open source Dynatrace CLI, using DQL against Grail, so there are no new credentials to mint. The app never changes configuration and never closes a problem: anything that acts links into Dynatrace or hands the work to an agent with a human in the loop.

Use cases

  • Run the morning triage from one board: open the Problems view, let the ranking order the queue, and work top down instead of reading an alert list sorted by arrival time.

  • Hand an incident to an agent with its evidence attached: Investigate seeds the session with the problem's facts, so the agent starts from the root cause and the affected entities rather than from a pasted problem ID.

  • Brief the standup without writing it: open a problem, use Summarize, and hand the team a readable account of what is broken and what it touches.

  • Check fleet health before a release: switch to the services or applications view and see which parts of the estate are already unhealthy or on watch before you add change to them.

Get started

The app is open source at dynatrace-oss/dynatrace-kirocrew-app. Clone it, build the UI with npm install && npm run build in ui/, then install it into Kiro Crew with kirocrew app install, kirocrew app enable dynatrace and kirocrew restart. First run takes three steps:

  1. Confirm dtctl is installed.
  2. Connect your Dynatrace environment, either with browser SSO, where one button runs the OAuth flow and pins the tenant, or with a platform token and its environment URL.
  3. Open the board.

Tokens are stored owner only and never echoed back; the app reports only the source and the last four characters. With no credentials it runs on a built in demo dataset, labelled as demo in every response, so you can evaluate the whole experience before connecting anything real.

Details

An open source community project under Apache 2.0, built together by Dynatrace and AWS and maintained in the Dynatrace open source organization. It is not covered by Dynatrace product support. Report issues and contribute through the GitHub repository.

Dynatrace
DocumentationMore Information
By Dynatrace
Dynatrace support center
Copy to clipboard

Related to Kiro Crew

Claude Code CLI logo

Claude Code CLI

Investigate production issues from Claude Code with one plugin install.

Cursor (MCP) logo

Cursor (MCP)

Investigate production issues from Cursor with one plugin install.

Dynatrace MCP Server logo

Dynatrace MCP Server

Enable your AI agents with high-quality data and real-time production insights.

Kiro monitoring logo

Kiro monitoring

Visibility into Kiro credit usage, messages, and adoption across your org.

Problems logo

Problems

Detect, explain and triage problems automatically using Dynatrace Intelligence.

Root Cause Agent logo

Root Cause Agent

Automated context-aware root cause analysis across the full observability stack.

More resources

From insight to innovation: How Kiro Crew, Dynatrace, and AWS are helping teams do more

From insight to innovation: How Kiro Crew, Dynatrace, and AWS are helping teams do more

How Kiro Crew, Dynatrace, and AWS close the distance between seeing a problem and acting on it
Read more

Dynatrace Hub
Get data into DynatraceBuild your own app
Dynatrace Intelligence - Agentic Operations SystemThe Dynatrace Agentic AI ecosystem
All (934)Log Management and AnalyticsKubernetesAI and LLM ObservabilityInfrastructure ObservabilitySoftware DeliveryApplication ObservabilityApplication SecurityBusiness ObservabilityDigital Experience
Filter
Type
Built and maintained by
Partner FinderBecome a partnerDynatrace Developer

Discover recent additions to Dynatrace

Dynatrace Assist logo

Dynatrace Assist

Dynatrace Assist: Ask, analyze, and act with Dynatrace Intelligence.

Smartscape logo

Smartscape

Interactively explore and analyze topology and relationships in digital systems.

Compliance Assistant logo

Compliance Assistant

Track, manage, and automate compliance across your IT and business landscape.

Experience Vitals logo

Experience Vitals

Optimize UX with core vitals, frontend error tracking, and end-to-end visibility.

Error Inspector logo

Error Inspector

Discover, triage, and manage errors across all your frontends.

Users & Sessions logo

Users & Sessions

Replay how users experience your frontend. Analyze behavior and outcomes.

Analyze your data

Understand your data better with deep insights and clear visualizations.

Notebooks logo

Notebooks

Create powerful, data-driven documents for custom analytics and collaboration.

Dashboards logo

Dashboards

Transform complex data into clear visualizations with custom dashboards.

Investigations logo

Investigations

Fast and precise incident response on Grail data with DQL queries.

Smartscape logo

Smartscape

Interactively explore and analyze topology and relationships in digital systems.

Logs logo

Logs

Explore all your logs without writing a single query.

Problems logo

Problems

Detect, explain and triage problems automatically using Dynatrace Intelligence.

Automate your processes

Turn data and answers into actions, securely, and at scale.

Workflows logo

Workflows

Automate tasks in your IT landscape and move towards autonomous operations.

Jira logo

Jira

Open, update, and close Jira tickets automatically from Dynatrace Workflows.

Slack logo

Slack

Automate Slack messaging for security incidents, attacks, remediation, and more.

Secure your cloud application

See vulnerabilities and attacks in your environment.

Security Posture Management logo

Security Posture Management

Detect, prioritize, and remediate security and compliance findings with SPM.

Threats & Exploits logo

Threats & Exploits

Understand, triage, and investigate detection findings and alerts.

More resources

Cursor (Live-Debugger) logo

Cursor (Live-Debugger)

Get Real time Code-Level data directly to your Cursor IDE.

Documents logo

Documents

Manage Dashboards, Notebooks and other documents in your Dynatrace environment.

GitHub Copilot Coding Agent logo

GitHub Copilot Coding Agent

Automate vulnerability remediation and boost developer productivity.

GitHub Copilot Custom Agent logo

GitHub Copilot Custom Agent

Automate your development workflows with specialized agent definitions.

Dynatrace Live Debugger on JetBrains logo

Dynatrace Live Debugger on JetBrains

Get real-time code-level data directly to your Jetbrains IDE.

Metrics logo

Metrics

Browse, search, and manage all your metrics in one central catalog.

Dynatrace Live Debugger on Windsurf logo

Dynatrace Live Debugger on Windsurf

Get real-time code-level data directly to your Windsurf IDE.

Are you looking for something different?

We have hundreds of apps, extensions, and other technologies to customize your environment

Leverage our newest innovations of Dynatrace Saas

Kick-start your app creation

Kick-start your app creation

Whether you’re a beginner or a pro, Dynatrace Developer has the tools and support you need to create incredible apps with minimal effort.
Go to Dynatrace Developer
Upgrading from Dynatrace Managed to SaaS

Upgrading from Dynatrace Managed to SaaS

Drive innovation, speed, and agility in your organization by seamlessly and securely upgrading.
Learn More
Log Management and Analytics

Log Management and Analytics

Innovate faster and more efficiently with unified log management and log analytics for actionable insights and automation.
Learn more