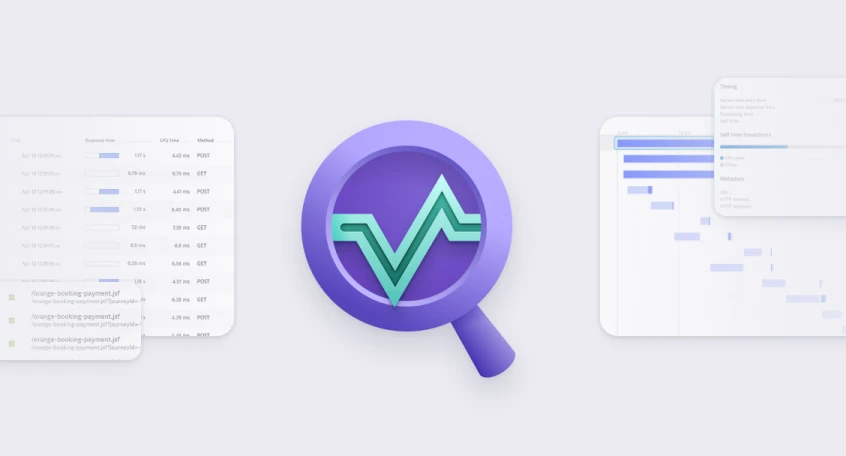
Discover distributed tracing
Observe requests across distributed systems and microservices and generate high-quality data for analysis.
Read more


Get started with these popular tools for monitoring your applications and microservices.
Harness automation and AI to simplify Kubernetes observability at scale.

Ingest and analyze OpenTelemetry traces & metrics, set alarms & view in context
Seamless integration with serverless technologies to eliminate blind spots through OOTB integrations with AWS, Azure, and Google Cloud.
All-in-one Kubernetes observability for infrastructure and apps teams
Capture distributed traces with code-level visibility, topology, and metadata.
Automatic and intelligent end-to-end observability for Java applications.
Automatic end-to-end observability for .NET applications and processes.

Automatic and intelligent end-to-end observability for Go applications.
Automatic and intelligent end-to-end observability for Node.js applications.
End-to-end observability for your Python applications.

Automatic and intelligent end-to-end observability for PHP applications.
Ingest and analyze OpenTelemetry traces & metrics, set alarms & view in context

Ingest Spring metrics and put them in context of trace, log and diagnostics data

Open-source toolkit for monitoring and alerting on infrastructure metrics.

Stream log data to Dynatrace via Fluentd for analysis.

Stream logs to Dynatrace via Fluent Bit for analysis and AI observability.

Stream log data from Logstash and analyze it in Dynatrace.

Automatic and intelligent end-to-end observability of AWS Lambda traces and logs

Observability for serverless and hybrid environments using Azure Functions.
E2E observability for serverless and hybrid environments using Google Functions.

Intelligent end-to-end observability for serverless and hybrid environments using Azure App Services.
Deploy and manage serverless containers on the Microsoft Azure cloud, without having to manage any underlying infrastructure.

Dynatrace provides AI-powered observability into serverless containerized apps running on Google Cloud Run.
Automatically and intelligently observe, analyze & optimize your Redis server.
Automatically and intelligently observe, analyze and optimize how your the usage, health and performance of your database.

Improve Apache Cassandra observability

Couchbase Capella (SaaS) database monitoring

Automatic and intelligent observability with trace and metric insights.

Automatic end-to-end traces of producers and consumers for RabbitMQ

Automatic and intelligent observability for ActiveMQ with trace and metric insights.

ActiveMQ Artemis observability with end-to-end producers and consumers tracers.

Automatic and intelligent observability for MSMQ with end-to-end traces of connected producers and consumers.

End-to-end trace your applications when the Reactor Core publishers Mono and Flux are used.

Automatic and intelligent end-to-end observability for your Java Spring applications.

End-to-end observability for your Netty web framework with code-level insight.

Automatically and intelligently monitor, analyze, and optimize your application server and all applications deployed anywhere in your stack.
JavaScript application framework for building interactive cross platform web applications.

Extend observability by seamlessly integrating OpenTracing data emitted by the Vert.x web framework into PurePath® distributed traces.

Provides proven, enterprise-class security, reliability, and performance for SPARC and x86 systems.

Open-source lightweight OS based on the Linux, providing infrastructure to clustered deployments.

Markup language used for structuring and presenting content on the web.

Set of cloud computing services for business offered by the information technology company IBM.

This extension allows more detailed visibility on Linux hosts' local datastores where OneAgent is installed.
Allows business information to flow between applications across multiple platforms.

Get deep insights into your self-managed OpenShift control plane using etcd metrics exposed on your cluster.

Application server method of pooling and sharing connections to a database.

The openSUSE project is a community program sponsored by SUSE Linux and other companies.

Ingest and chart OpenTracing data, set alerts, and analyze everything in the context of traces, metrics, logs, and diagnostics data.

Automatically and intelligently monitor, analyze, and optimize your applications developed with Symfony.

Automatically and intelligently monitor, analyze, and optimize the performance of your virtual machine.

Set of tools that allows web developers to create and maintain JavaScript front-end applications.

Java message-oriented middleware API for sending messages between two or more clients.

Monitor hybrid mobile apps built with Adobe PhoneGap running on iOS or Android.
Monitor health and performance of VMware ESXi virtual machines from the system’s perspective.
Application method of pooling and sharing multiple connections to a database.

OpenMetrics is a universal, scalable metric standard.

Automated monitoring of platform processes running in BOSH bpm containers.
Monitor the PHP-FPM status of your applications with this extension.
Monitor health and performance of KVM virtual machines from the system’s perspective.

Association of individuals who have made common cause to create a free operating system.

Manage compliance with automated checks and incident handling out-of-the-box.
coming soon
Monitor health and performance of VMware vCenter Server virtual machines from the system’s perspective.

Modernize to hybrid cloud infrastructure with end-to-end observability from the mainframe to the cloud, and everything in between.

Dynatrace PurePath® technology seamlessly integrates OpenTracing data for Java emitted by the Hazelcast in-memory computing platform.

Harness automation and AI to simplify Kubernetes observability at scale.
Automatically and intelligently monitor, analyze, and optimize the performance of your virtual machine.
Automatically and intelligently monitor, analyze, and optimize the performance of your virtual machine.
Automatically and intelligently monitor, analyze, and optimize the performance of your virtual machine.

Web server component for Oracle Fusion Middleware.

Open-source, free Linux distribution based on Debian.

Application server method of pooling and sharing connections to a database.

Data management products, including database servers, developed by IBM.

Automatically and intelligently monitor, analyze, and optimize your application server and all applications deployed on it.

Accelerates application delivery, improves security, facilitates availability & scalability.

Intelligently monitor the performance and availability of your LPARs and regions.

Automatically and intelligently monitor, analyze, and optimize your applications developed with IBM HTTP Server.
Automatically and intelligently monitor, analyze, and optimize your application server and all applications deployed anywhere in your stack.

Monitor and analyze your Apache Zookeeper with this JMX-based extension

Automated distributed tracing and metrics for microservices running in garden runc containers in Cloud Foundry.
Automatically and intelligently monitor, analyze, and optimize your application server and all applications deployed anywhere in your stack.

Intelligently monitor your transactions end-to-end and analyze the performance of your CICS Transaction Gateway on z/OS.

Automatically and intelligently monitor, analyze, and optimize your applications developed with Play Framework.

Open-source JavaScript web framework, based on the Model–view–viewmodel pattern.

Automatically and intelligently monitor, analyze, and optimize your application server and all applications deployed anywhere in your stack.

JavaScript library based on the Model–view–presenter application design paradigm.

Framework for building semantically correct RESTful web services ready for use at scale.
Are you looking for something different?
We have hundreds of apps, extensions, and other technologies to customize your environment