


















Skip to technology filters Skip to main content
Dynatrace Hub

Extend the platform,
empower your team.

Popular searches:
Home hero bg
Cursor (MCP)Cursor (MCP)
Cursor (MCP)

Cursor (MCP)

Investigate production issues from Cursor with one plugin install.

Technology
Free trialDocumentation
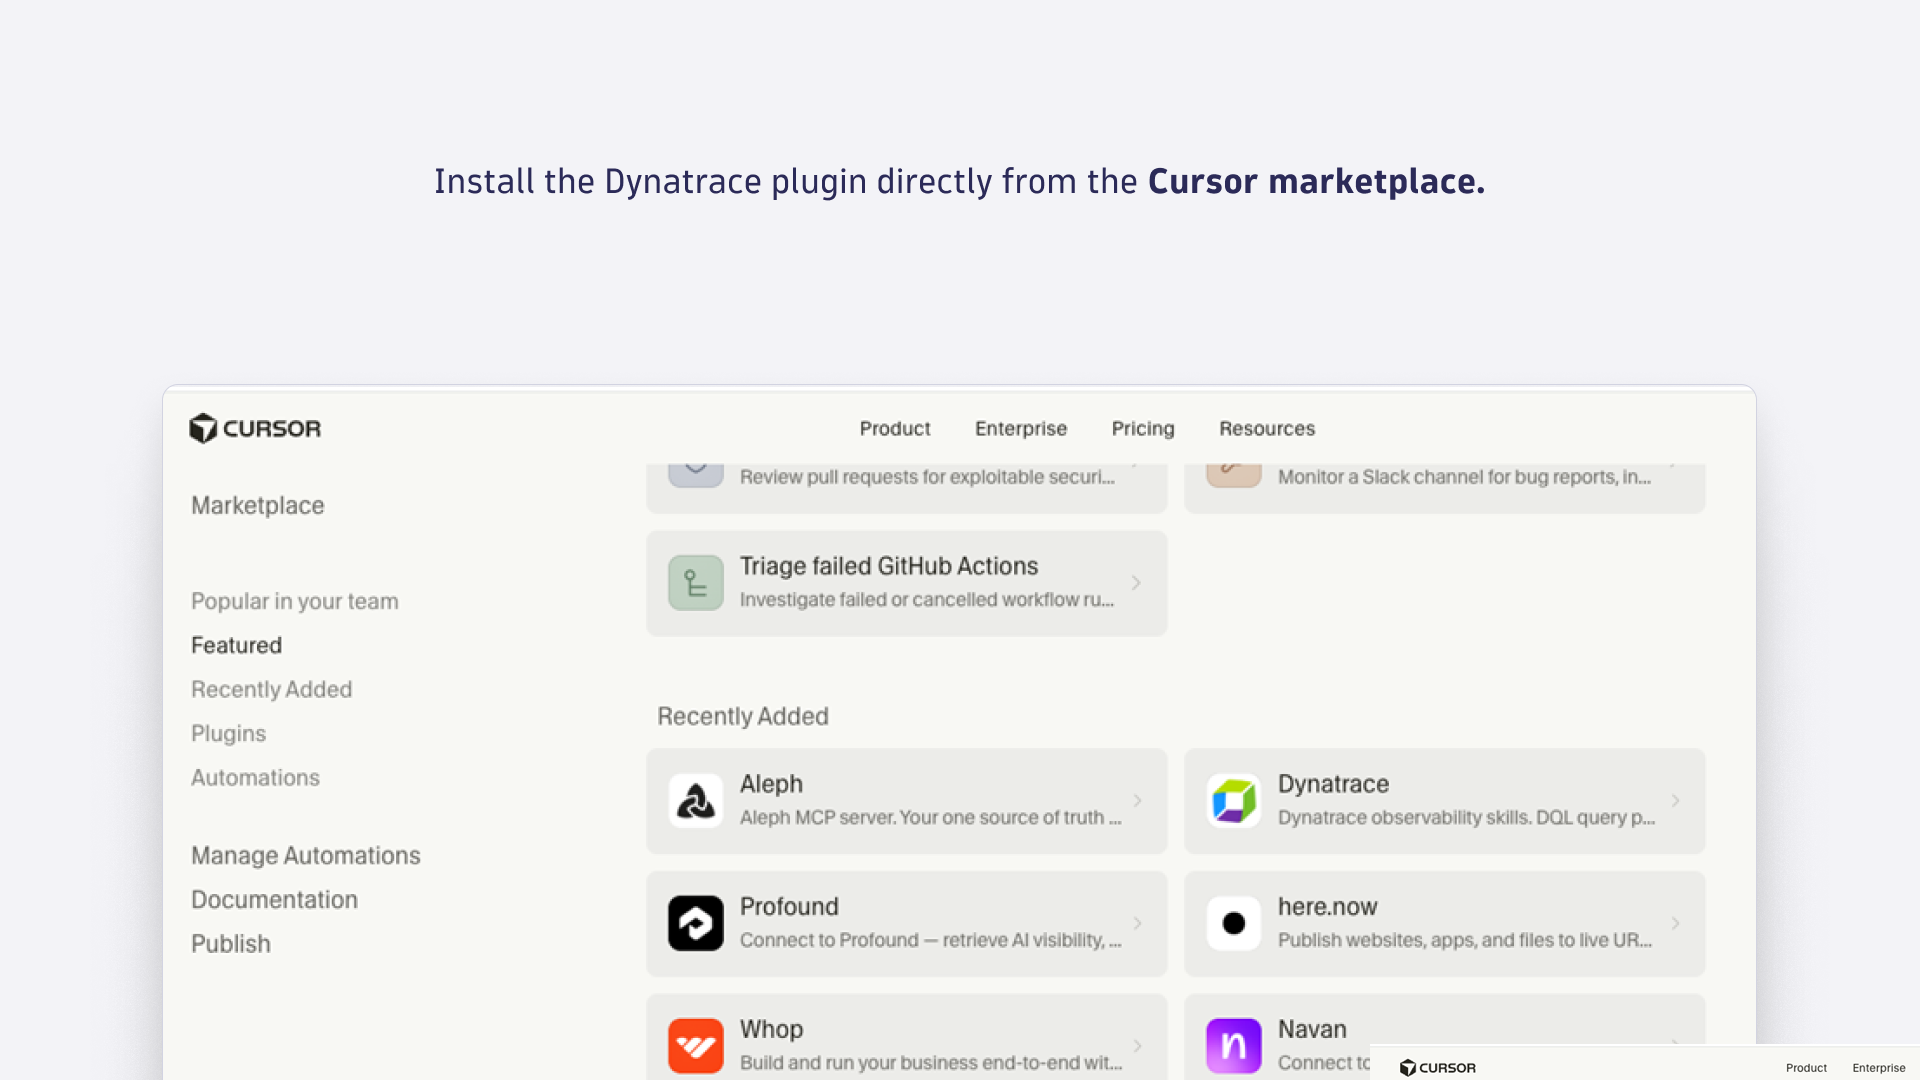
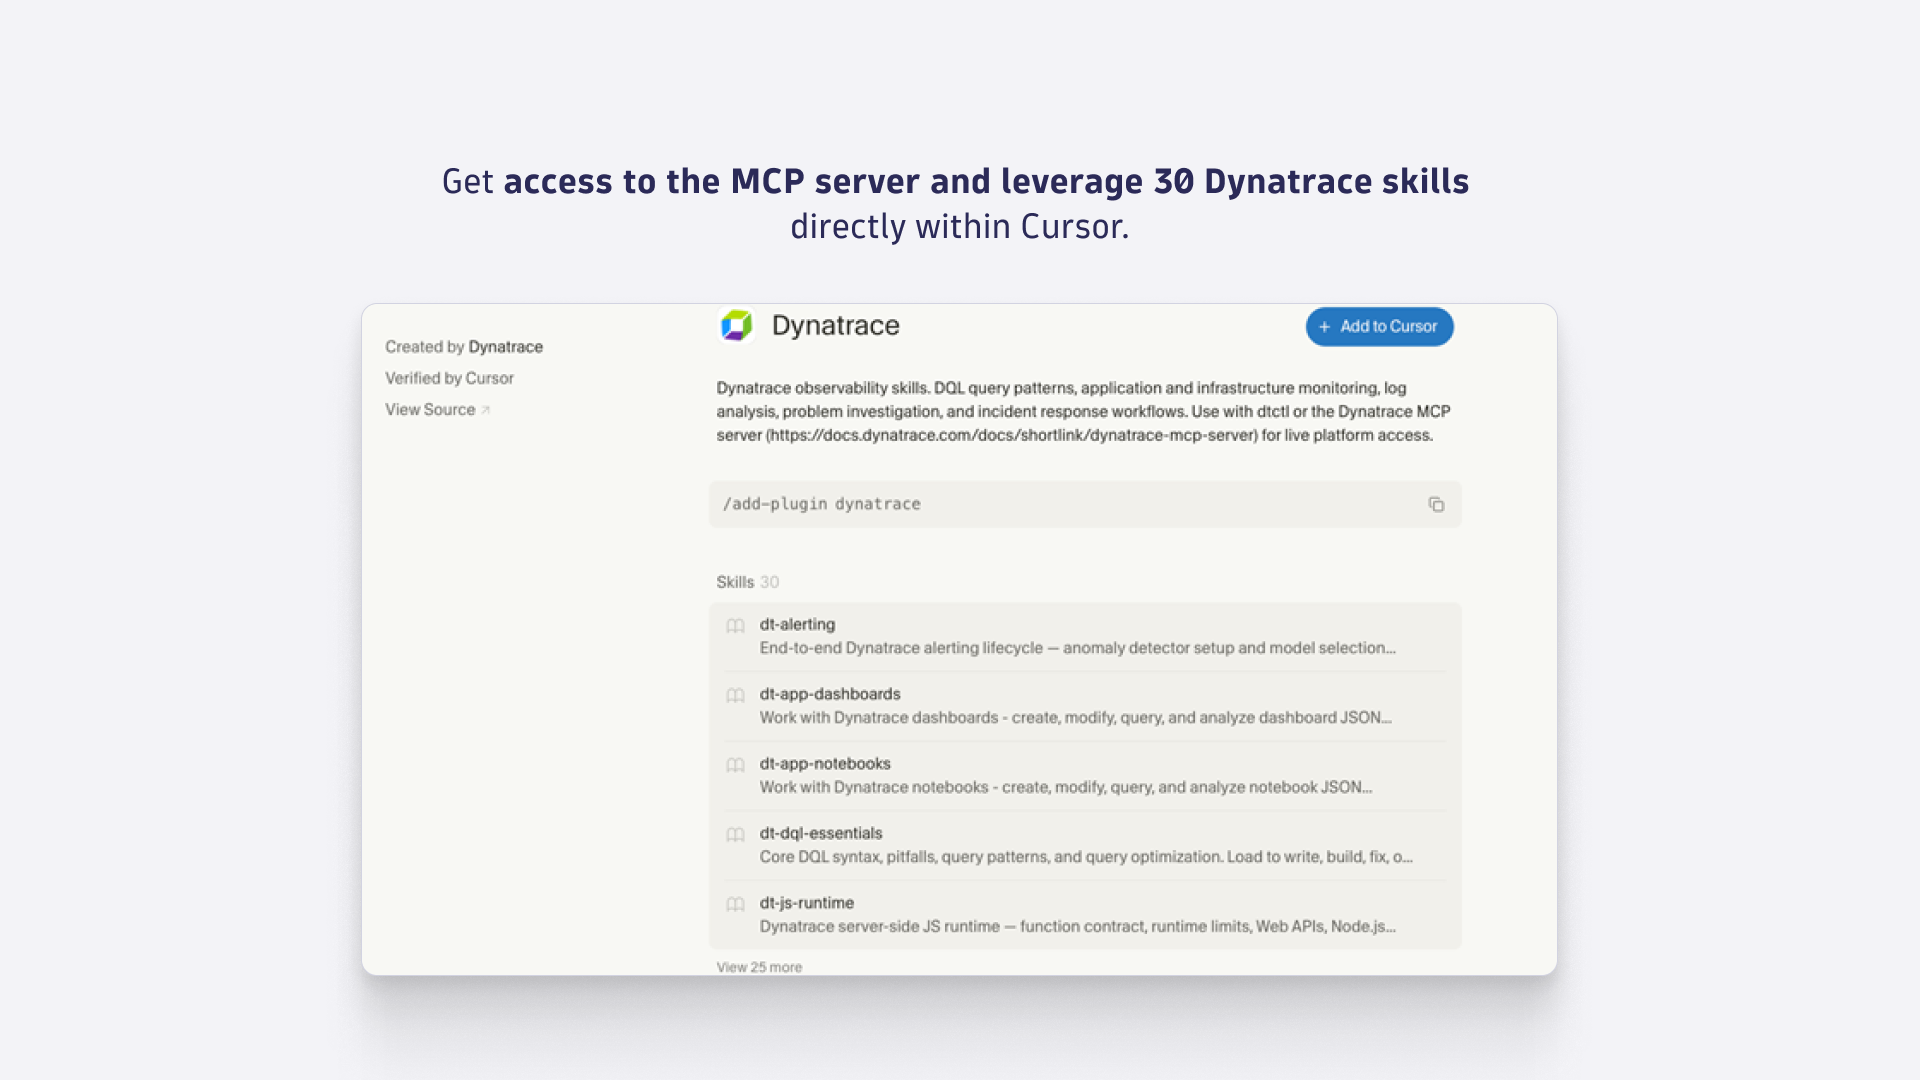
Install the Dynatrace plugin directly from the Cursor Marketplace.Get access to the MCP server and 30 Dynatrace skills directly within Cursor.
  • Product information

Overview

Dynatrace is listed in the Cursor Marketplace as a verified plugin, and a single install connects the Cursor agent to your Dynatrace environment through the Model Context Protocol server while loading 30 Dynatrace skills alongside it, so the agent gets live access to your production data together with the expertise to query it correctly.

Main capabilities include:

  • One install covers both halves of the problem: the MCP server gives the agent access to your live environment, while the 30 bundled skills carry the knowledge of how Dynatrace is organized so that queries land on fields that actually exist. Skills load only when a task calls for them, so installing all 30 does not crowd the context window.

  • The bundled skills include dt-dql-essentials for DQL syntax and query patterns, dt-app-dashboards and dt-app-notebooks for building platform assets, and dt-alerting for anomaly detector setup. These are the same skills released as Dynatrace for AI, now packaged for a one-click install.

  • Cursor becomes another surface for the conversational analysis you already run in Dynatrace Assist, so a question asked in the editor reaches the same data through the same MCP server.

  • Root cause comes from deterministic causal analysis over your Smartscape topology, so the agent explains a cause instead of reporting a correlation, and it pulls the related logs, metrics, traces, and CPU and memory profiling data into the session alongside it.

  • dtctl, the open source CLI for the Dynatrace platform, runs next to the MCP server, so you can manage dashboards, trigger workflows, and execute DQL from the integrated terminal.

Use cases

  • Debug a failing service without leaving the editor: ask in plain language why a service started returning 5xx errors after your last deploy, narrow by impact, filter to the service, and ask for remediation suggestions, all without writing a line of DQL.

  • Answer exposure questions against production: ask whether you are vulnerable to a specific CVE and get the answer measured against the workloads actually running in your environment rather than against a dependency manifest.

  • Investigate incidents in context: root cause for a problem ID, log patterns on a Kubernetes workload, service-to-service dependencies, and the real user impact of a regression you shipped.

  • Optimize and tune with evidence: find oversized hosts, surface database calls that are slow at p99, and check forecast headroom before you scale.

Get started

Install the plugin from the Cursor Marketplace

Open Cursor Desktop, go to Customize in the sidebar, search the Marketplace for Dynatrace, and click Install / Add to Cursor. Choose the desired scope if prompted, then complete the MCP/auth setup prompts, as described in the Dynatrace MCP server documentation. If you prefer the command palette, /add-plugin dynatrace does the same thing.

Note: some skills (those that perform write operations such as managing dashboards, triggering workflows, or executing DQL) require dtctl to be installed alongside the plugin.

Try it on a failing service

  • Ask why the service is failing, in plain language, with the code already open.

  • The agent pulls the root cause into the session along with the related logs, metrics, traces, and CPU and memory profiling data from your live environment.

  • Narrow by impact, filter to the service, and ask for remediation suggestions.

  • Fix the code without leaving the editor.

Details

Cursor reviews third-party plugins before they appear in the marketplace, and the Dynatrace plugin is listed as verified. A single Cursor plugin can ship MCP servers, agent skills, rules, hooks, and commands together, and the Dynatrace plugin carries one MCP server and 30 skills.

Consumption is priced on data rather than per user, so onboarding a second or a fiftieth developer into this workflow does not change what you are billed.

Dynatrace
Documentation
By Dynatrace
Dynatrace support center
Copy to clipboard

Related to Cursor (MCP)

Cursor (Live-Debugger) logo

Cursor (Live-Debugger)

Get Real time Code-Level data directly to your Cursor IDE.

Dynatrace Assist logo

Dynatrace Assist

Dynatrace Assist: Ask, analyze, and act with Dynatrace Intelligence.

Dynatrace MCP Server logo

Dynatrace MCP Server

Enable your AI agents with high-quality data and real-time production insights.

GitHub Copilot logo

GitHub Copilot

Accelerate code-level error-resolution with real-time production insights.

Local MCP Server logo

Local MCP Server

[DEPRECATED] Run an MCP Server locally as a playground or to customize modules.

MCP Server Tools logo

MCP Server Tools

Enable your agents with reliable insights, with our toolkit accessible via MCP.

Dynatrace Hub
Get data into DynatraceBuild your own app
Dynatrace Intelligence - Agentic Operations SystemThe Dynatrace Agentic AI ecosystem
All (922)Log Management and AnalyticsKubernetesAI and LLM ObservabilityInfrastructure ObservabilitySoftware DeliveryApplication ObservabilityApplication SecurityBusiness ObservabilityDigital Experience
Filter
Type
Built and maintained by
Partner FinderBecome a partnerDynatrace Developer

Discover recent additions to Dynatrace

Dynatrace Assist logo

Dynatrace Assist

Dynatrace Assist: Ask, analyze, and act with Dynatrace Intelligence.

Smartscape logo

Smartscape

Interactively explore and analyze topology and relationships in digital systems.

Compliance Assistant logo

Compliance Assistant

Track, manage, and automate compliance across your IT and business landscape.

Experience Vitals logo

Experience Vitals

Optimize UX with core vitals, frontend error tracking, and end-to-end visibility.

Error Inspector logo

Error Inspector

Discover, triage, and manage errors across all your frontends.

Users & Sessions logo

Users & Sessions

Discover how users and cohorts with common characteristics experience your app.

Analyze your data

Understand your data better with deep insights and clear visualizations.

Notebooks logo

Notebooks

Create powerful, data-driven documents for custom analytics and collaboration.

Dashboards logo

Dashboards

Transform complex data into clear visualizations with custom dashboards.

Investigations logo

Investigations

Fast and precise incident response on Grail data with DQL queries.

Smartscape logo

Smartscape

Interactively explore and analyze topology and relationships in digital systems.

Logs logo

Logs

Explore all your logs without writing a single query.

Problems logo

Problems

Detect, explain and triage problems automatically using Dynatrace Intelligence.

Automate your processes

Turn data and answers into actions, securely, and at scale.

Workflows logo

Workflows

Automate tasks in your IT landscape and move towards autonomous operations.

Jira logo

Jira

Open, update, and close Jira tickets automatically from Dynatrace Workflows.

Slack logo

Slack

Automate Slack messaging for security incidents, attacks, remediation, and more.

Secure your cloud application

See vulnerabilities and attacks in your environment.

Security Posture Management logo

Security Posture Management

Detect, prioritize, and remediate security and compliance findings with SPM.

Threats & Exploits logo

Threats & Exploits

Understand, triage, and investigate detection findings and alerts.

More resources

Cursor (Live-Debugger) logo

Cursor (Live-Debugger)

Get Real time Code-Level data directly to your Cursor IDE.

Documents logo

Documents

Manage Dashboards, Notebooks and other documents in your Dynatrace environment.

GitHub Copilot Coding Agent logo

GitHub Copilot Coding Agent

Automate vulnerability remediation and boost developer productivity.

GitHub Copilot Custom Agent logo

GitHub Copilot Custom Agent

Automate your development workflows with specialized agent definitions.

Dynatrace Live Debugger on JetBrains logo

Dynatrace Live Debugger on JetBrains

Get real-time code-level data directly to your Jetbrains IDE.

Metrics logo

Metrics

Browse, search, and manage all your metrics in one central catalog.

Pagerduty for Dynatrace Workflows logo

Pagerduty for Dynatrace Workflows

Streamline incident management with automated Pageruty workflows.

Dynatrace Live Debugger on Windsurf logo

Dynatrace Live Debugger on Windsurf

Get real-time code-level data directly to your Windsurf IDE.

Are you looking for something different?

We have hundreds of apps, extensions, and other technologies to customize your environment

Leverage our newest innovations of Dynatrace Saas

Kick-start your app creation

Kick-start your app creation

Whether you’re a beginner or a pro, Dynatrace Developer has the tools and support you need to create incredible apps with minimal effort.
Go to Dynatrace Developer

Upgrading from Dynatrace Managed to SaaS

Upgrading from Dynatrace Managed to SaaS

Drive innovation, speed, and agility in your organization by seamlessly and securely upgrading.
Learn More
Log Management and Analytics

Log Management and Analytics

Innovate faster and more efficiently with unified log management and log analytics for actionable insights and automation.
Learn more