






















Skip to technology filters Skip to main content
Dynatrace Hub

Extend the platform,
empower your team.

Popular searches:
Home hero bg
Agentic Incident AnalysisAgentic Incident Analysis
Agentic Incident Analysis

Agentic Incident Analysis

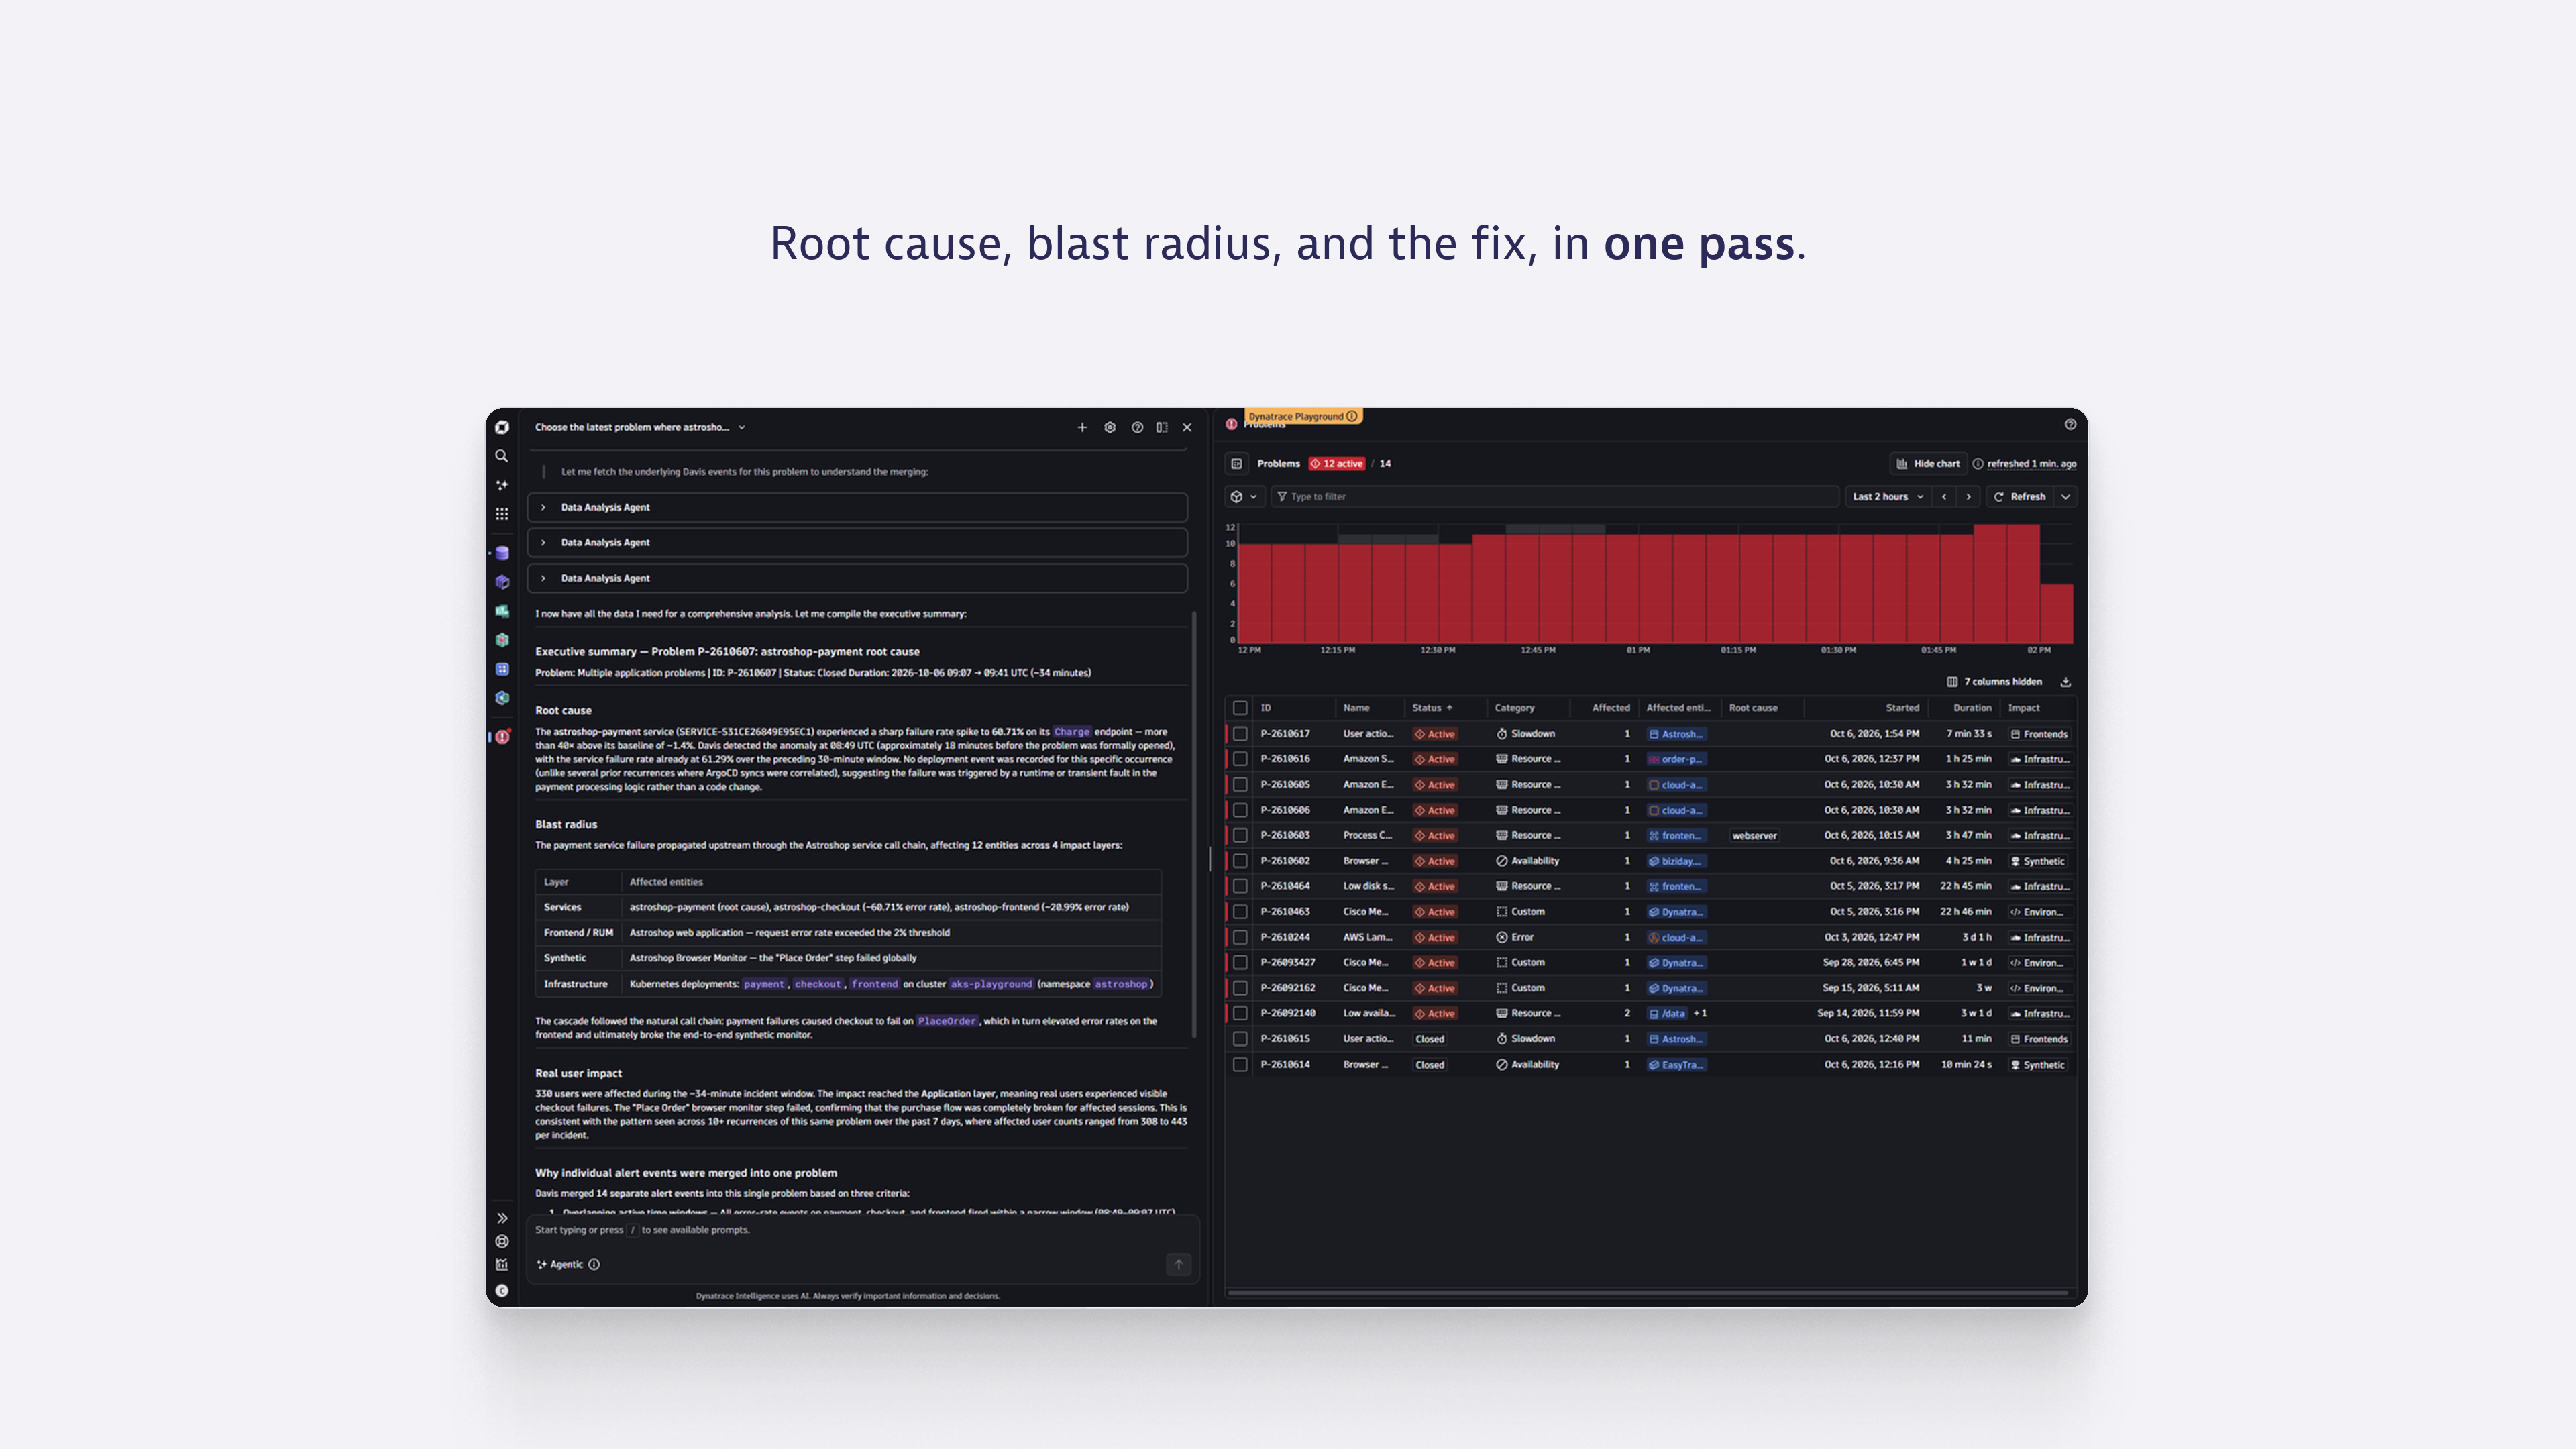
Root cause, blast radius, and the fix, in one pass.

Technology
Free trialDocumentation
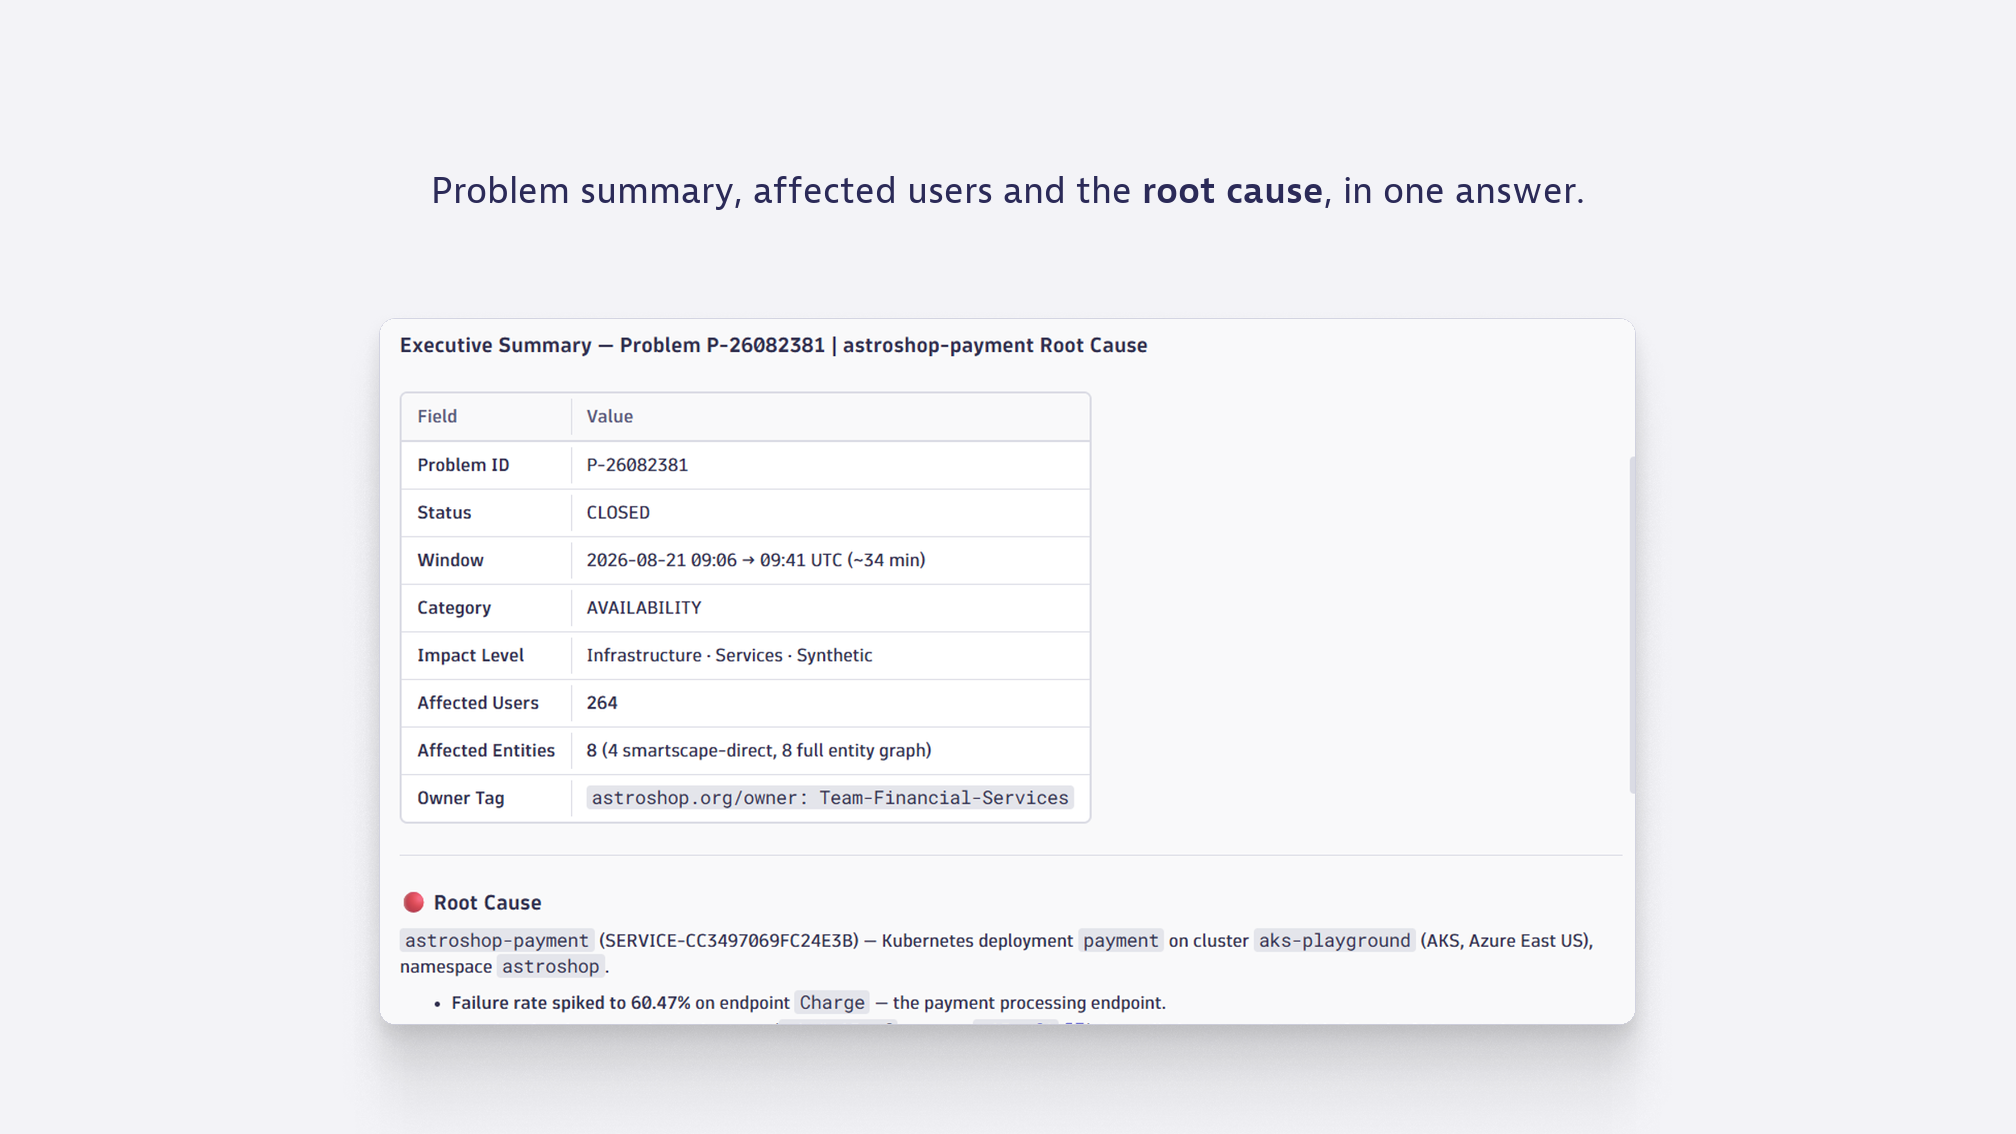
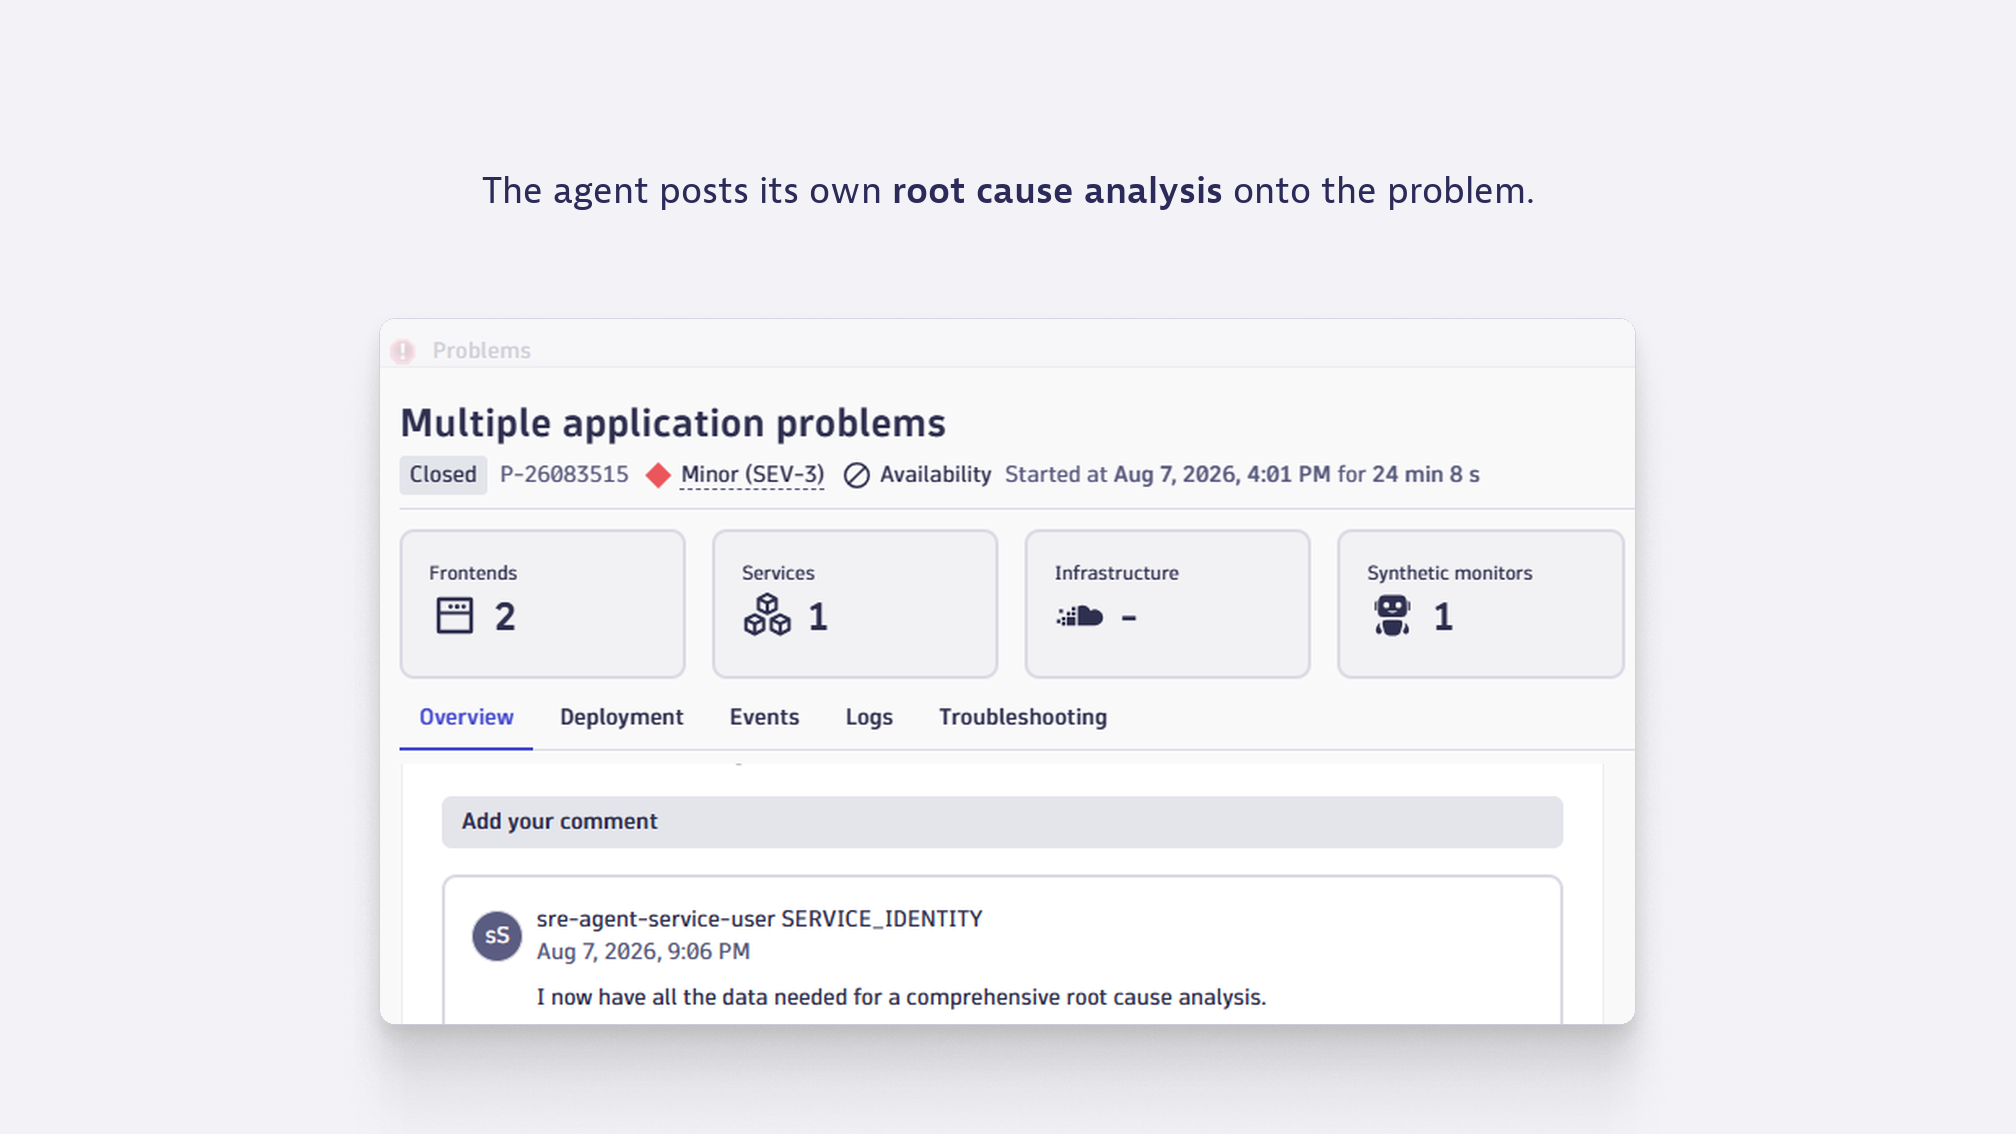
Root cause, blast radius, and the fix, in one pass.Ask once and get the problem summary with the root cause named.The agent investigates on its own and writes the analysis onto the problem.
  • Product information

Overview

Why did it break, and how to fix it? Root cause, blast radius, and the fix, in one pass.

Start from a conversation and the agent becomes your expert assistant, in Dynatrace Assist or through the Dynatrace MCP server, wherever you work. Or let it run autonomously: when a problem is automatically detected, the work that used to fill your first hour is finished before you even open the problem, and you get a named cause and a suggested remediation.

A ticket already arrives investigated. Root cause and a proposed fix are there before you open it, and recurring ones can be remediated with no person in the loop.

  • Understand what is happening. Surface the health picture and the patterns worth attention.
  • Identify the root cause. A named root cause with the supporting evidence, grounded in causal analysis and the Smartscape dependency graph.
  • Assess the impact. See the blast radius, whether it's isolated or hits the business, and what depends on it.
  • All the context you need. Logs, events, topology, spec changes, metrics in context.
  • Know what to do. Get the remediation steps, or a ticket, a pull request or a code fix, waiting on your approval.

Use cases

  • Deep root cause and impact analysis: investigate the root cause with blast radius, the real user impact, and why the alerts were merged into one problem.
  • Log pattern analysis: scan the log patterns on a workload and rank them by frequency and severity.
  • Root cause on demand: get the causing entity and the exact change behind it.
  • Release regression analysis: compare a problem's start time against the deployment history and name the exact commit that introduced it.
  • Hidden dependency discovery: find every app and endpoint calling a service.
  • Investigate from your IDE (MCP): ask Dynatrace from your IDE, through the Dynatrace MCP server, and get the production answer next to your code.
  • Route it to the service desk: the incident arrives in ServiceNow, Jira or Jira Service Management with the cause already named.

Get started

Ask interactively

  1. Enable generative AI and agentic AI for your environment and assign the permissions through a policy. See the getting started documentation.
  2. Open Dynatrace Assist and ask about a problem you own. To ask from your IDE or terminal, install the Dynatrace MCP server.

Run it autonomously

  1. Enable Dynatrace Intelligence for Workflows and build an agentic workflow triggered on problem events, starting from the ready-made agents.
  2. The agent investigates, and the workflow adds the trigger, the approval and the routing. Every agent runs as its own scoped service identity with allow-listed tools and approval gates. Route the result to the Problem, email, Slack, a ticket, or a Git repository.

Dynatrace
DocumentationMore Information
By Dynatrace
Dynatrace support center
Copy to clipboard

Related to Agentic Incident Analysis

Dynatrace Assist logo

Dynatrace Assist

Dynatrace Assist: Ask, analyze, and act with Dynatrace Intelligence.

Dynatrace MCP Server logo

Dynatrace MCP Server

Enable your AI agents with high-quality data and real-time production insights.

Kubernetes Troubleshooting Agent logo

Kubernetes Troubleshooting Agent

Automated troubleshooting and root cause analysis of Kubernetes resources.

SRE Agent logo

SRE Agent

Analyze and triage incidents.

Dynatrace Hub
Get data into DynatraceBuild your own app
Dynatrace Intelligence - The Agentic PlatformThe Dynatrace Agentic AI ecosystem
All (948)Log Management and AnalyticsKubernetesAI and LLM ObservabilityInfrastructure ObservabilitySoftware DeliveryApplication ObservabilityApplication SecurityBusiness ObservabilityDigital Experience
Filter
Type
Built and maintained by
Partner FinderBecome a partnerDynatrace Developer

Discover recent additions to Dynatrace

Arize AX logo

Arize AX

Analyze traces, latency, and evals of LLM apps through Arize OpenInference data.

AI Observability logo

AI Observability

End-to-end observability for your Agentic AI and LLM workloads.

Dynatrace Assist logo

Dynatrace Assist

Dynatrace Assist: Ask, analyze, and act with Dynatrace Intelligence.

SRE Agent logo

SRE Agent

Analyze and triage incidents.

Smartscape logo

Smartscape

Interactively explore and analyze topology and relationships in digital systems.

Clouds logo

Clouds

Gain full visibility and proactive monitoring across your cloud infrastructure.

Analyze your data

Understand your data better with deep insights and clear visualizations.

Notebooks logo

Notebooks

Create powerful, data-driven documents for custom analytics and collaboration.

Dashboards logo

Dashboards

Transform complex data into clear visualizations with custom dashboards.

Investigations logo

Investigations

Fast and precise incident response on Grail data with DQL queries.

Smartscape logo

Smartscape

Interactively explore and analyze topology and relationships in digital systems.

Logs logo

Logs

Explore all your logs without writing a single query.

Problems logo

Problems

Detect, explain and triage problems automatically using Dynatrace Intelligence.

Automate your processes

Turn data and answers into actions, securely, and at scale.

Workflows logo

Workflows

Automate tasks in your IT landscape and move towards autonomous operations.

Jira logo

Jira

Open, update, and close Jira tickets automatically from Dynatrace Workflows.

Slack logo

Slack

Automate Slack messaging for security incidents, attacks, remediation, and more.

Secure your cloud application

See vulnerabilities and attacks in your environment.

Security Posture Management logo

Security Posture Management

Detect, prioritize, and remediate security and compliance findings with SPM.

Threats & Exploits logo

Threats & Exploits

Understand, triage, and investigate detection findings and alerts.

More resources

Cursor (Live-Debugger) logo

Cursor (Live-Debugger)

Get Real time Code-Level data directly to your Cursor IDE.

Documents logo

Documents

Manage Dashboards, Notebooks and other documents in your Dynatrace environment.

GitHub Copilot Coding Agent logo

GitHub Copilot Coding Agent

Automate vulnerability remediation and boost developer productivity.

GitHub Copilot Custom Agent logo

GitHub Copilot Custom Agent

Automate your development workflows with specialized agent definitions.

Dynatrace Live Debugger on JetBrains logo

Dynatrace Live Debugger on JetBrains

Get real-time code-level data directly to your Jetbrains IDE.

Metrics logo

Metrics

Browse, search, and manage all your metrics in one central catalog.

Dynatrace Live Debugger on Windsurf logo

Dynatrace Live Debugger on Windsurf

Get real-time code-level data directly to your Windsurf IDE.

Are you looking for something different?

We have hundreds of apps, extensions, and other technologies to customize your environment

Leverage our newest innovations of Dynatrace Saas

Kick-start your app creation

Kick-start your app creation

Whether you’re a beginner or a pro, Dynatrace Developer has the tools and support you need to create incredible apps with minimal effort.
Go to Dynatrace Developer

Upgrading from Dynatrace Managed to SaaS

Upgrading from Dynatrace Managed to SaaS

Drive innovation, speed, and agility in your organization by seamlessly and securely upgrading.
Learn More
Log Management and Analytics

Log Management and Analytics

Innovate faster and more efficiently with unified log management and log analytics for actionable insights and automation.
Learn more