
I don’t think there is a correct or one-size-fits-all definition of Shift-Left, neither is there one for DevOps, Cloud-Native or any of these other heavily used terms. What I do know is that there are experts in our industry trying to make it easier for engineers to get faster self-service quality, performance and scalability feedback about their proposed code changes.
In a recent chat with one of our customers who works in the in the financial sector, I was told about how they transformed their core financial services leveraging a modern cloud native architecture running on AWS. That transformation also included a shift of their development practices, their delivery pipeline and how to provide feedback to engineering and business earlier in the development cycle!
To give you one example: Instead of executing performance tests at the end of the Kanban time-box or at the end of the release cycle, performance tests are run for every build deployment and daily scheduled runs for latest code changes of each microservice. This gives both the infrastructure and development teams more and faster feedback about the impact of code or configuration changes on performance, scalability and resource consumption.
In a remote desktop session, their performance engineering team lead showed me their Dynatrace environment. I took a couple of screenshots and notes and hope that this will inspire others to redefine performance engineering with the power of the cloud, containers and Dynatrace AI. As I am respecting their request of anonymity, I have blurred out sensitive information in the screenshots!
#1: Eight Feature Based Environments powered by Terraform, EC2, Mesos, Docker & OneAgent
Let’s start with explaining what type of environment the performance engineering team is providing to the engineering teams to get faster performance feedback. They run a Dynatrace Managed installation in their AWS VPC, running 10 different Dynatrace Tenants to separate the different pre-production environments they are monitoring (Feature1, Feature2. Feature n, Performance, etc). If you want a Dynatrace Managed instead of a SaaS instance on AWS check out the recently announced Dynatrace Managed Cluster on AWS Quick Start.
On the infrastructure side their environments leverage Terraform and Ansible to deploy EC2 instances on which they run Mesos orchestration to host their Spring Boot Java services in Docker containers!
Here are some of the benefits they get out of Dynatrace, Cloud & Container Monitoring capabilities:
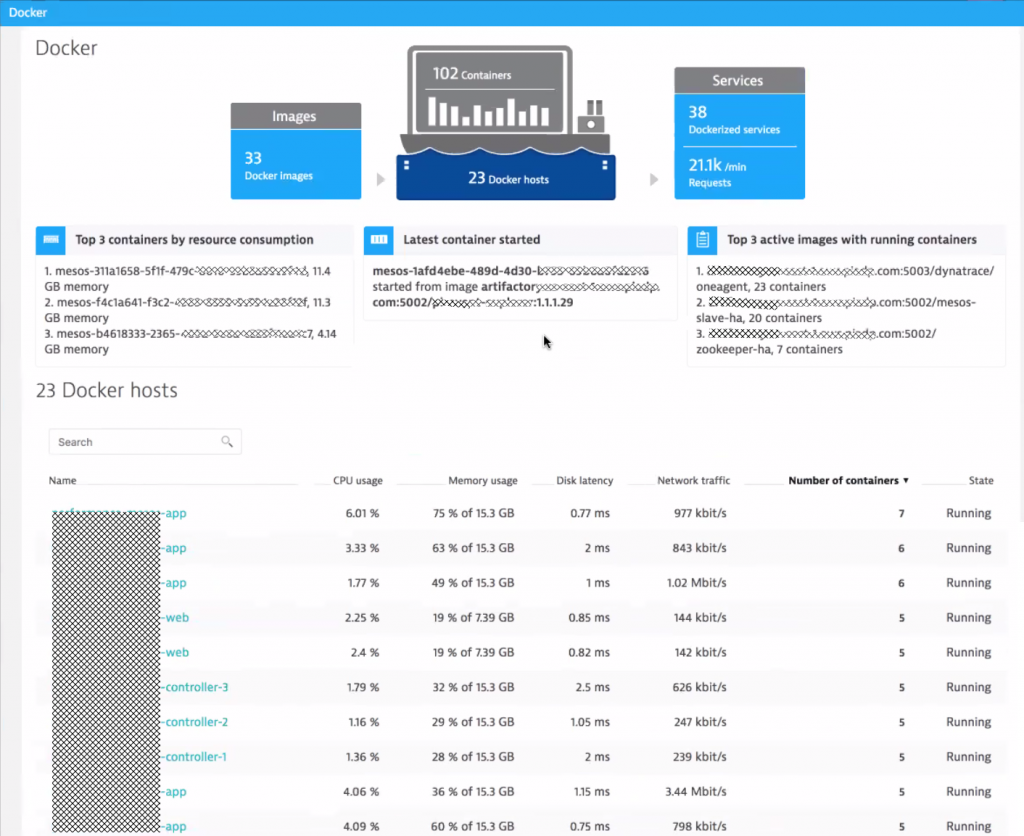
Benefit #1: Dynatrace allows easy management of containers and images!
One challenge in very dynamic containers environments, is to keep track of all the currently deployed containers, where they run and how many resources they consume. Making sure that those containers that should be running have enough resources and can reach all the other depending services is another challenge in highly dynamic environments. Dynatrace provides that type of visibility out-of-the-box! We call this “No-Touch Container Monitoring” as you don’t have to change anything in your container to get this visibility. This works for Docker, ECS, Fargate or any other Container flavor:
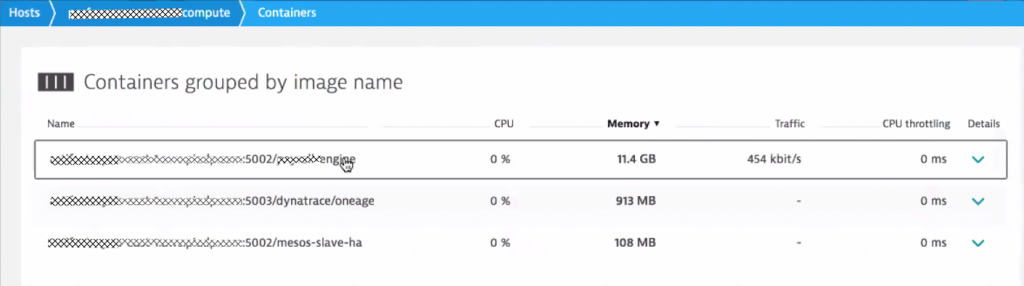
Benefit #2: Dynatrace provides automatic monitoring of container resource consumption
For a Docker host, Dynatrace provides visibility into the actual containers deployed on that host and shows how many resources these containers consume right now and over time:
Benefit #3: Dynatrace leverages CloudWatch for Metrics and for Tags
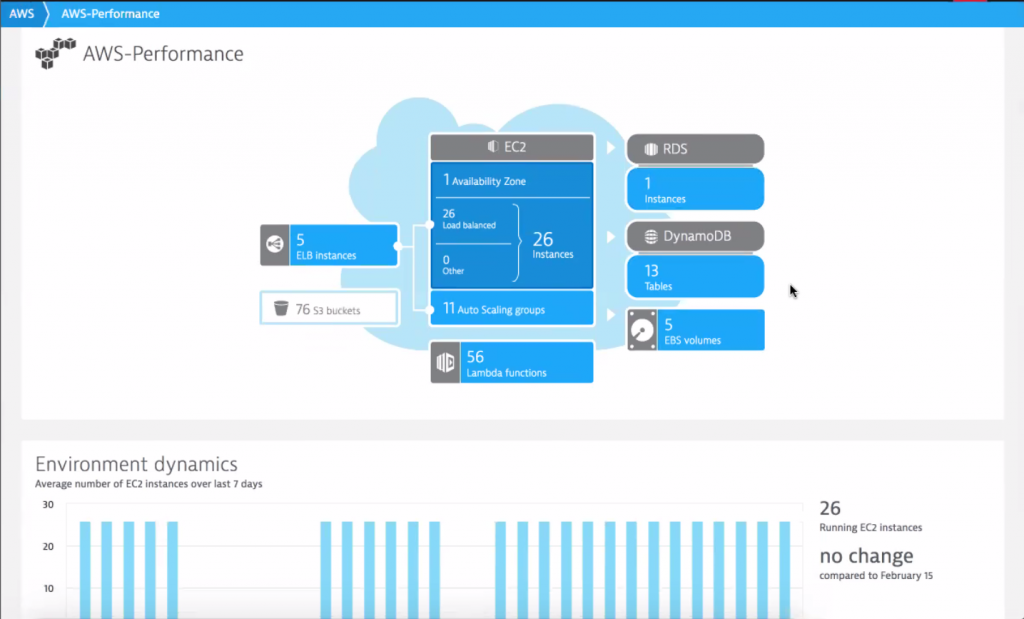
Our customer has also setup the Dynatrace AWS CloudWatch integration which not only automatically pulls in key CloudWatch metrics of AWS Services such as S3, EBS, RDS, DynamoDB, Lambda, ELB … but also pulls in Tags from EC2 instances, which get automatically applied to the monitored hosts where a Dynatrace OneAgent is installed. This makes managing all performance data much easier because dashboards, filters and notifications can be setup using the same tags as already defined on AWS.
And here is the Dynatrace AWS Overview showing how many AWS services and resources the teams are using in their Performance-Dev Environment:
TIP: If you want to learn more about basic AWS monitoring, I suggest you walk through my 101 AWS Monitoring GitHub Tutorial or watch my 101 AWS Monitoring Performance Clinic on YouTube. There I explain the integration with CloudWatch, how to deploy OneAgents on EC2 and how to monitor applications deployed on Beanstalk, ECS or Lambda!
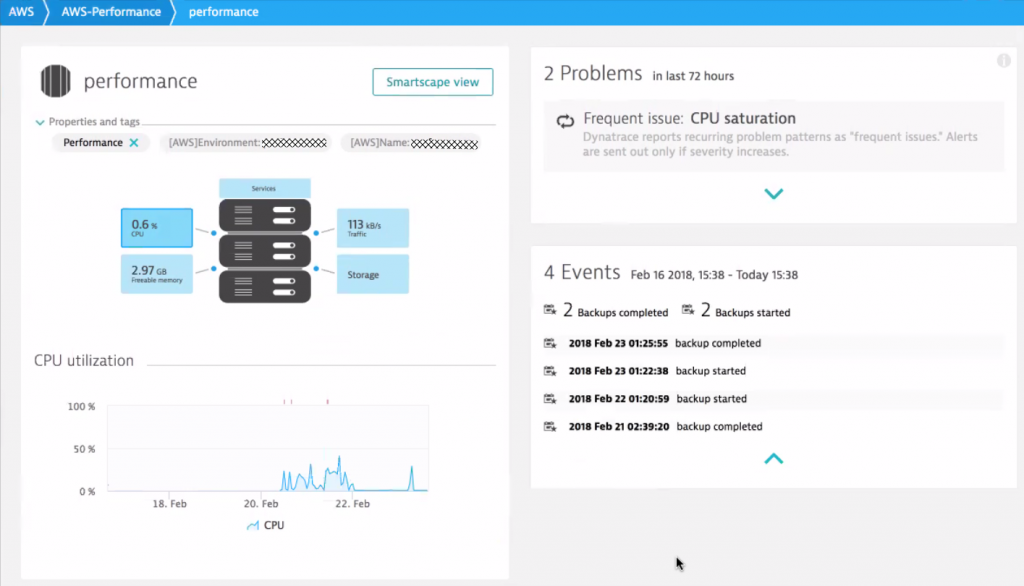
#2: Ensuring Healthy Cloud Infrastructure with help of Dynatrace AI
While having more monitoring data available is great, thanks to the Dynatrace OneAgent and the AWS CloudWatch integration, it doesn’t mean that the team can spend more time analyzing more data points. This is where the Dynatrace automatic baselining, anomaly and root cause detection helps.
I asked them if they have an example of how the Dynatrace AI helps their infrastructure team to help a stable and healthy environment for the services that the development teams run on top.
They opened the Dynatrace Problem View, clicked on the Infrastructure filter and then walked me through the following screenshots. They showed me how Dynatrace detected a network connectivity issue of several haproxy instances running in Docker containers orchestrated by Mesos across several EC2 instances.
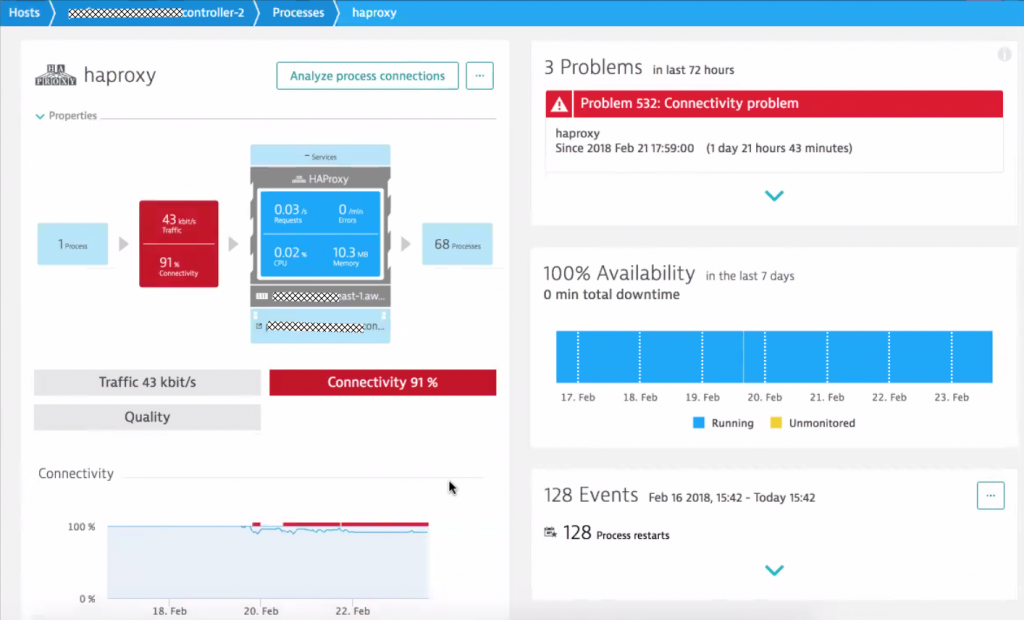
Benefit #1: Dynatrace’s automatic anomaly detection across all monitored entities and metrics
The Dynatrace OneAgent monitors every single container and all processes running in these containers. OneAgent automatically detects technologies and services such as haproxy, message queues, web- or application servers, databases, …
The Dynatrace anomaly detection understands which metrics are important for each type of service and reports an anomaly if a metric shows problematic or unusual behavior. Thanks to this auto-detection capability DevOps team can react much quicker to infrastructure related problems before they start impacting the services that run on them:
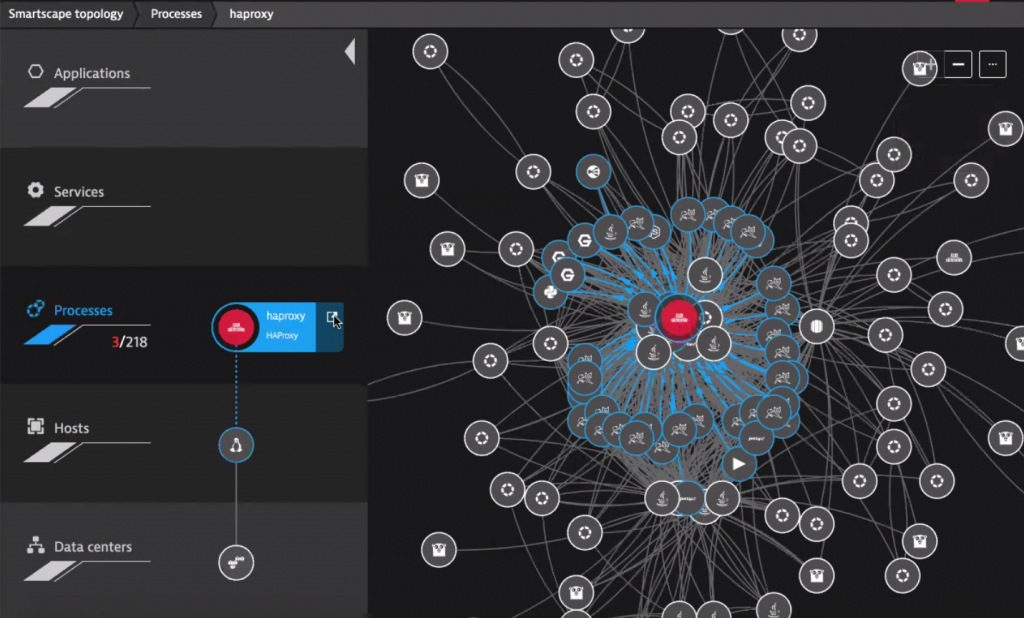
Benefit #2: Dynatrace Automatic Dependency and Impact Detection
Thanks to Smartscape, the infrastructure team not only knows which infrastructure components or critical services are currently in an unhealthy state. Smartscape also shows all the depending services that haproxy is connecting. Based on that information, it is easier to understand the potential impact to higher-level services, applications or even end users. This also helps to prioritize remediation actions – whether executed manually or automated.
TIP: If you want to learn more about how Dynatrace helps your IT Service and Operations (ITSM) check out the information around our ServiceNow Integration or how you can integrate Dynatrace with any CMDB YouTube Tutorial. If you want to see other examples of detected infrastructure problems check out my recent blog on AI In Action: RabbitMQ, Cassandra and JVM Memory.
#3: Shift-Left Performance Feedback with the help of Dynatrace AI
What runs on top of this dynamic cloud & container infrastructure? I am sure you guessed the answer: Services that their development teams are trying to get performance feedback on. The primary type of services they implement using Spring Boot expose REST APIs for their B2B offerings. Some of these APIs have well defined SLAs, which is why their team decided to define several custom thresholds for the different REST endpoints.
When developers make code changes, those get automatically deployed with the next scheduled build and get automatically tested. LoadRunner and JMeter are used to generate the load against their various REST APIs. These tests typically run for little over one hour after which developers pro-actively reach out to the Dynatrace dashboards to analyze how their code was performing, where the hotspots are and where there might have scalability issues.
Benefit #1: Dynatrace AI reduces time for analyzing performance test results
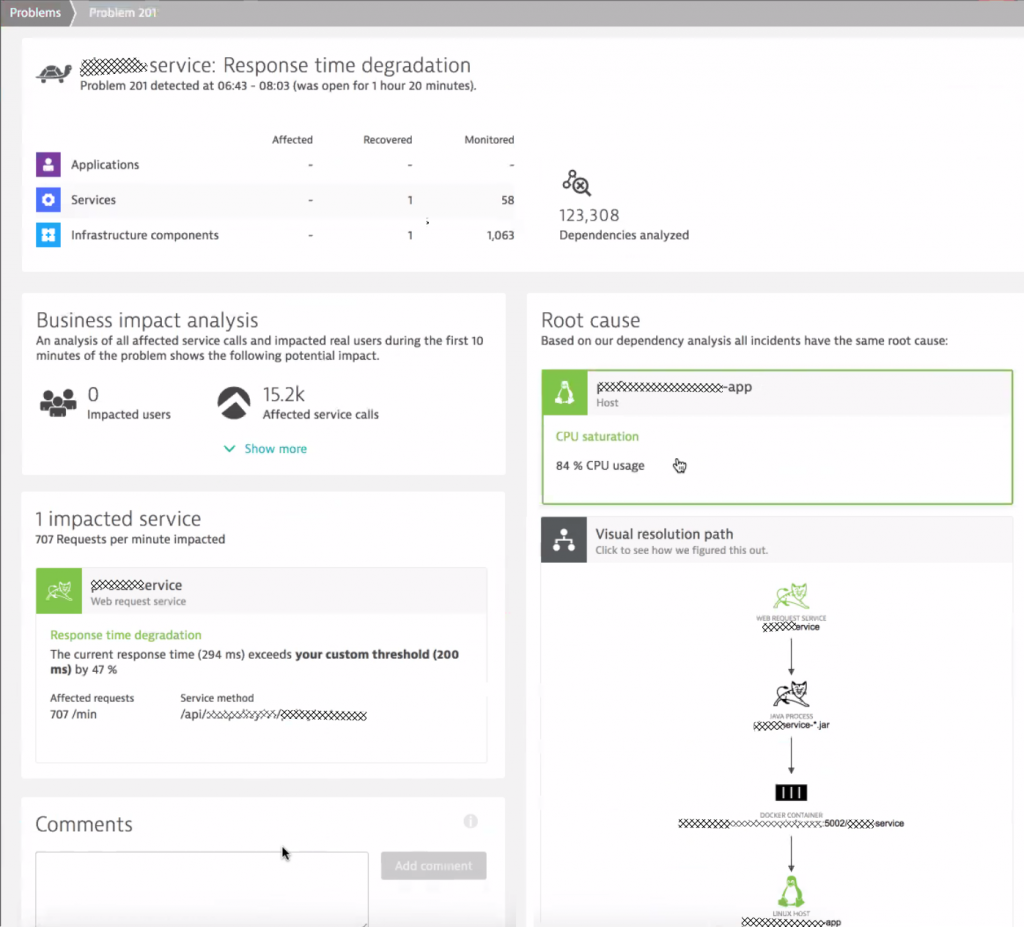
While Dynatrace gives them access to all data through the dashboards, the team started to see the benefit in time savings when using the Dynatrace AI automatic detected problems and root causes. The time saved can be better spent on building new features instead of manually analyzing the same metrics, log files, stack traces or CPU samples every time a test executes.
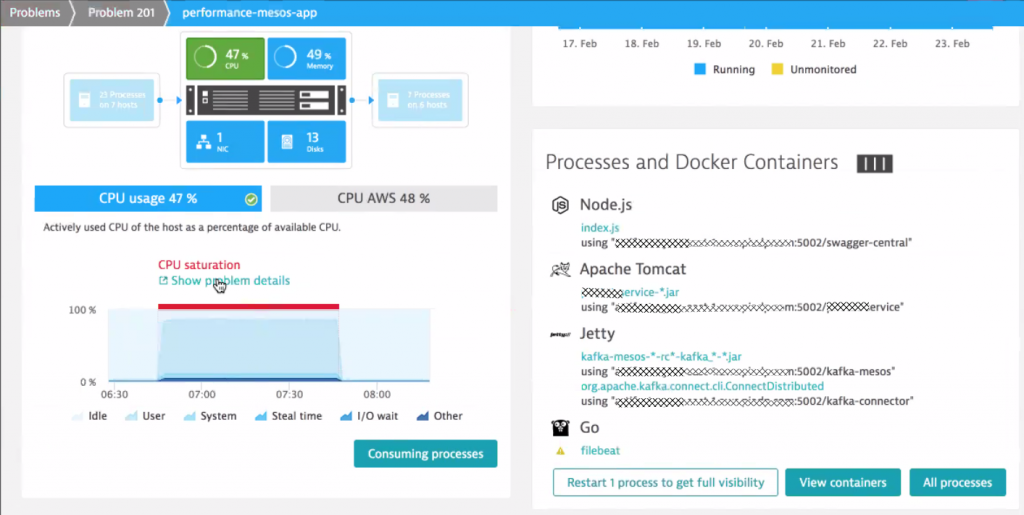
The following screenshot shows an automatically detected problem that happened during one of the automated load test runs. There was a 47% slowdown of a specific REST API endpoint caused by a CPU spike on that EC2 Linux machine, where Mesos hosts the Tomcat process in a container:
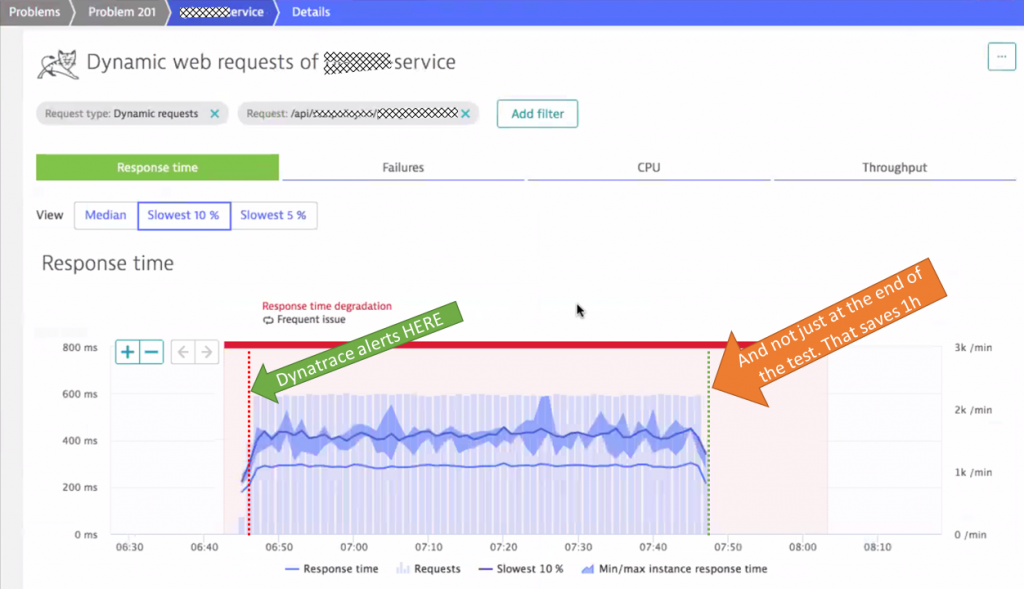
Benefit #2: Dynatrace Pro-Active Alerting of Dev Teams
Thanks to the host, process and service tagging capabilities of Dynatrace, each service is tagged with the name of the team responsible. In case Dynatrace detects a problem the team automatically gets notified thanks to the Alerting Profile feature in Dynatrace. Alerting Profiles allow sending problem notifications ONLY to those teams of services where a problem was detected. The notification (email, JIRA, Slack, Mattermost, Flowdock) also gets sent out immediately when the problem is detected and not only at the end of the test. This also speeds up the feedback loop cycle time in case a code change has an obvious issue which can be detected by Dynatrace within minutes.
Benefit #3: Dynatrace speeds up fault domain isolation between Infrastructure and Application
The CPU spike on that host makes you probably wonder: is it a problem with the infrastructure, the container or the actual app. When clicking into that root cause box in the problem ticket we end up seeing all the captured data from that EC2 Linux machine. We clearly see that there are a lot of other processes and containers running on that same box – all competing for CPU, memory, disk and the network. Very interesting to learn that the same box also runs Swagger (on Node.js), Kafka (two Jetty’s) and Filebeat (Go) besides our Tomcat that hosts the service under test:
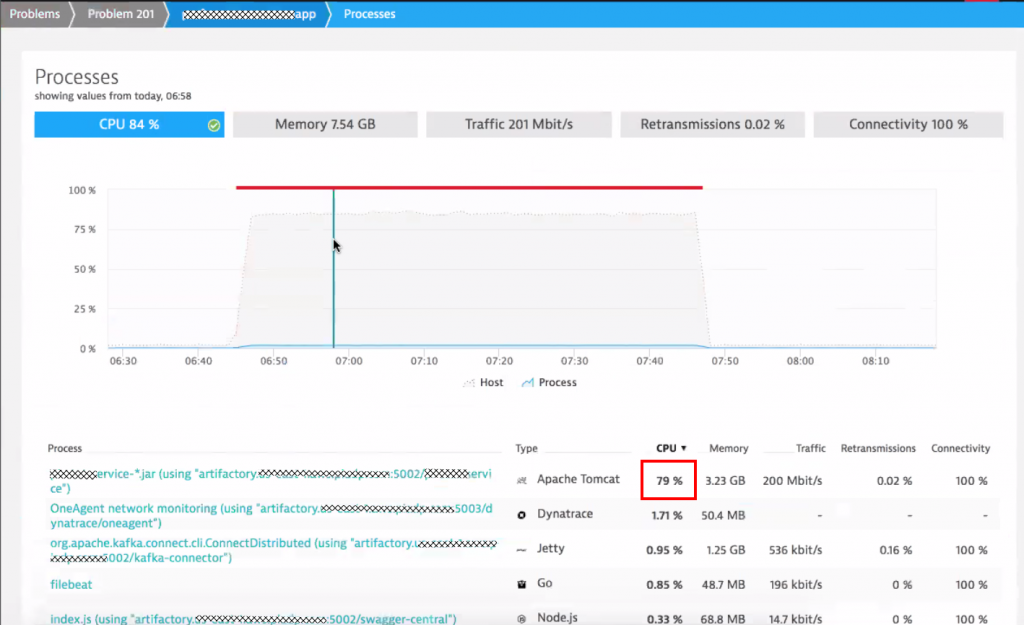
A click on “Consuming processes” gives us a detailed CPU breakdown of all processes & containers on that machine – clearly highlighting that the cause is our Apache Tomcat process:
Benefit #4: Dynatrace detects code level problems. In custom and 3rd party code
Now that we know the problem lies within Tomcat it is easy to find out what caused it. Dynatrace provides several hotspot detection options such as the response time analysis. Code execution is the clear “winner” in this case followed by two SQL statements:
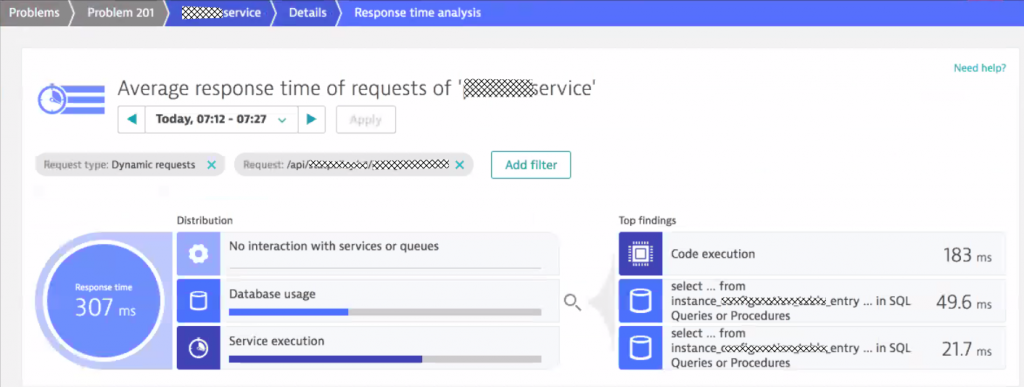
As the SLA for their REST API endpoints is 200ms it is interesting to learn why most of this time is consumed in code execution. More interesting is WHERE in the code the time is spent. Clicking on “Code execution” in the response time analysis infographic, brings up the method hotspots view with a detailed breakdown. We got a winner: Hibernate!
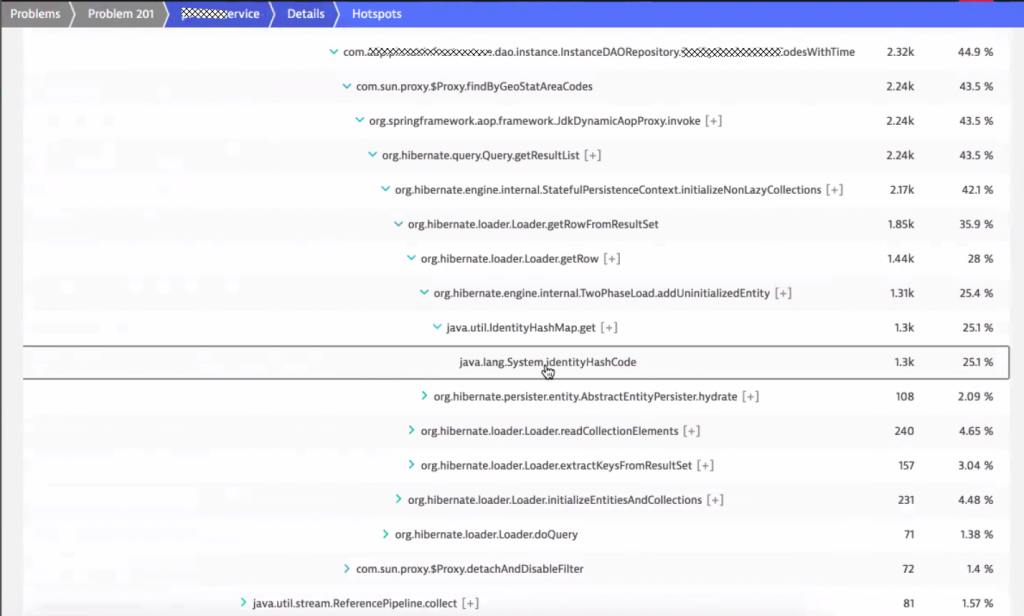
The above screenshot shows the hotspot across all the request that exceeded the 200ms SLA. This is very useful and makes it easier to analyze and fix hotspots that are impacting many transactions and not just individual requests.
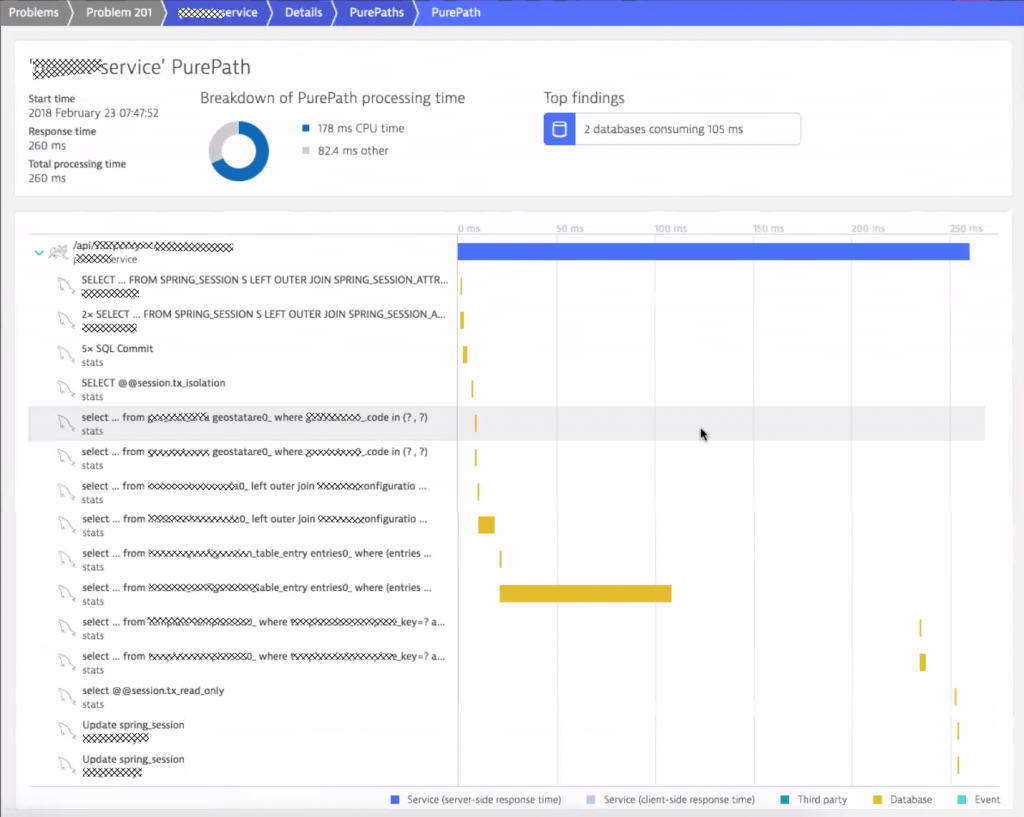
Thanks to the Dynatrace PurePath technology every single transaction is also available for inspection. Seeing the PurePath allows engineers to better understand the sequence of code execution which is very useful in distributed or asynchronous transactions.
Tip: I get a lot of questions from users that integrate Dynatrace with their load testing tools. Make sure to check out my blog on Load Testing Redefined or watch my Load Testing YouTube tutorial. If you want to learn more about diagnostics option with Dynatrace then check out Basic Diagnostics or Advanced Diagnostics with Dynatrace.
What else can be done with Dynatrace?
While the performance engineering team at our customer already leverages Dynatrace to speed up continuous feedback cycles to engineering as well as the infrastructure team there is more that can be done. Here are some additional ideas:
#1: Use the Dynatrace REST API to automate “sanity checks”:
- How many containers are running vs. how many should run?
- Do we run too many containers on a single host?
#2: Use the Dynatrace REST API to automate “deployment optimizations”:
- Re-distribute top resource consuming containers to avoid resource constraints
- Co-locate containers that are “tightly coupled”. This prevents network contention issues
#3: Use the Dynatrace REST API to automate “remediation actions”:
- Check out the auto-remediation blogs on Ansible Tower and StackStorm
- Check out my thoughts on Self-Healing use cases with Dynatrace
#4: Integrate Dynatrace tighter into your CI/CD Pipeline
- Read up on my thoughts about Building the Unbreakable Delivery Pipeline
- Learn how Dynatrace can be integrated into Atlassian DevOps Tools
If you have any further questions let me know. Happy to give you more insights into how Shift-Left can be done with Dynatrace and happy to share your own implementation. Just let me know!

Looking for answers?
Start a new discussion or ask for help in our Q&A forum.
Go to forum