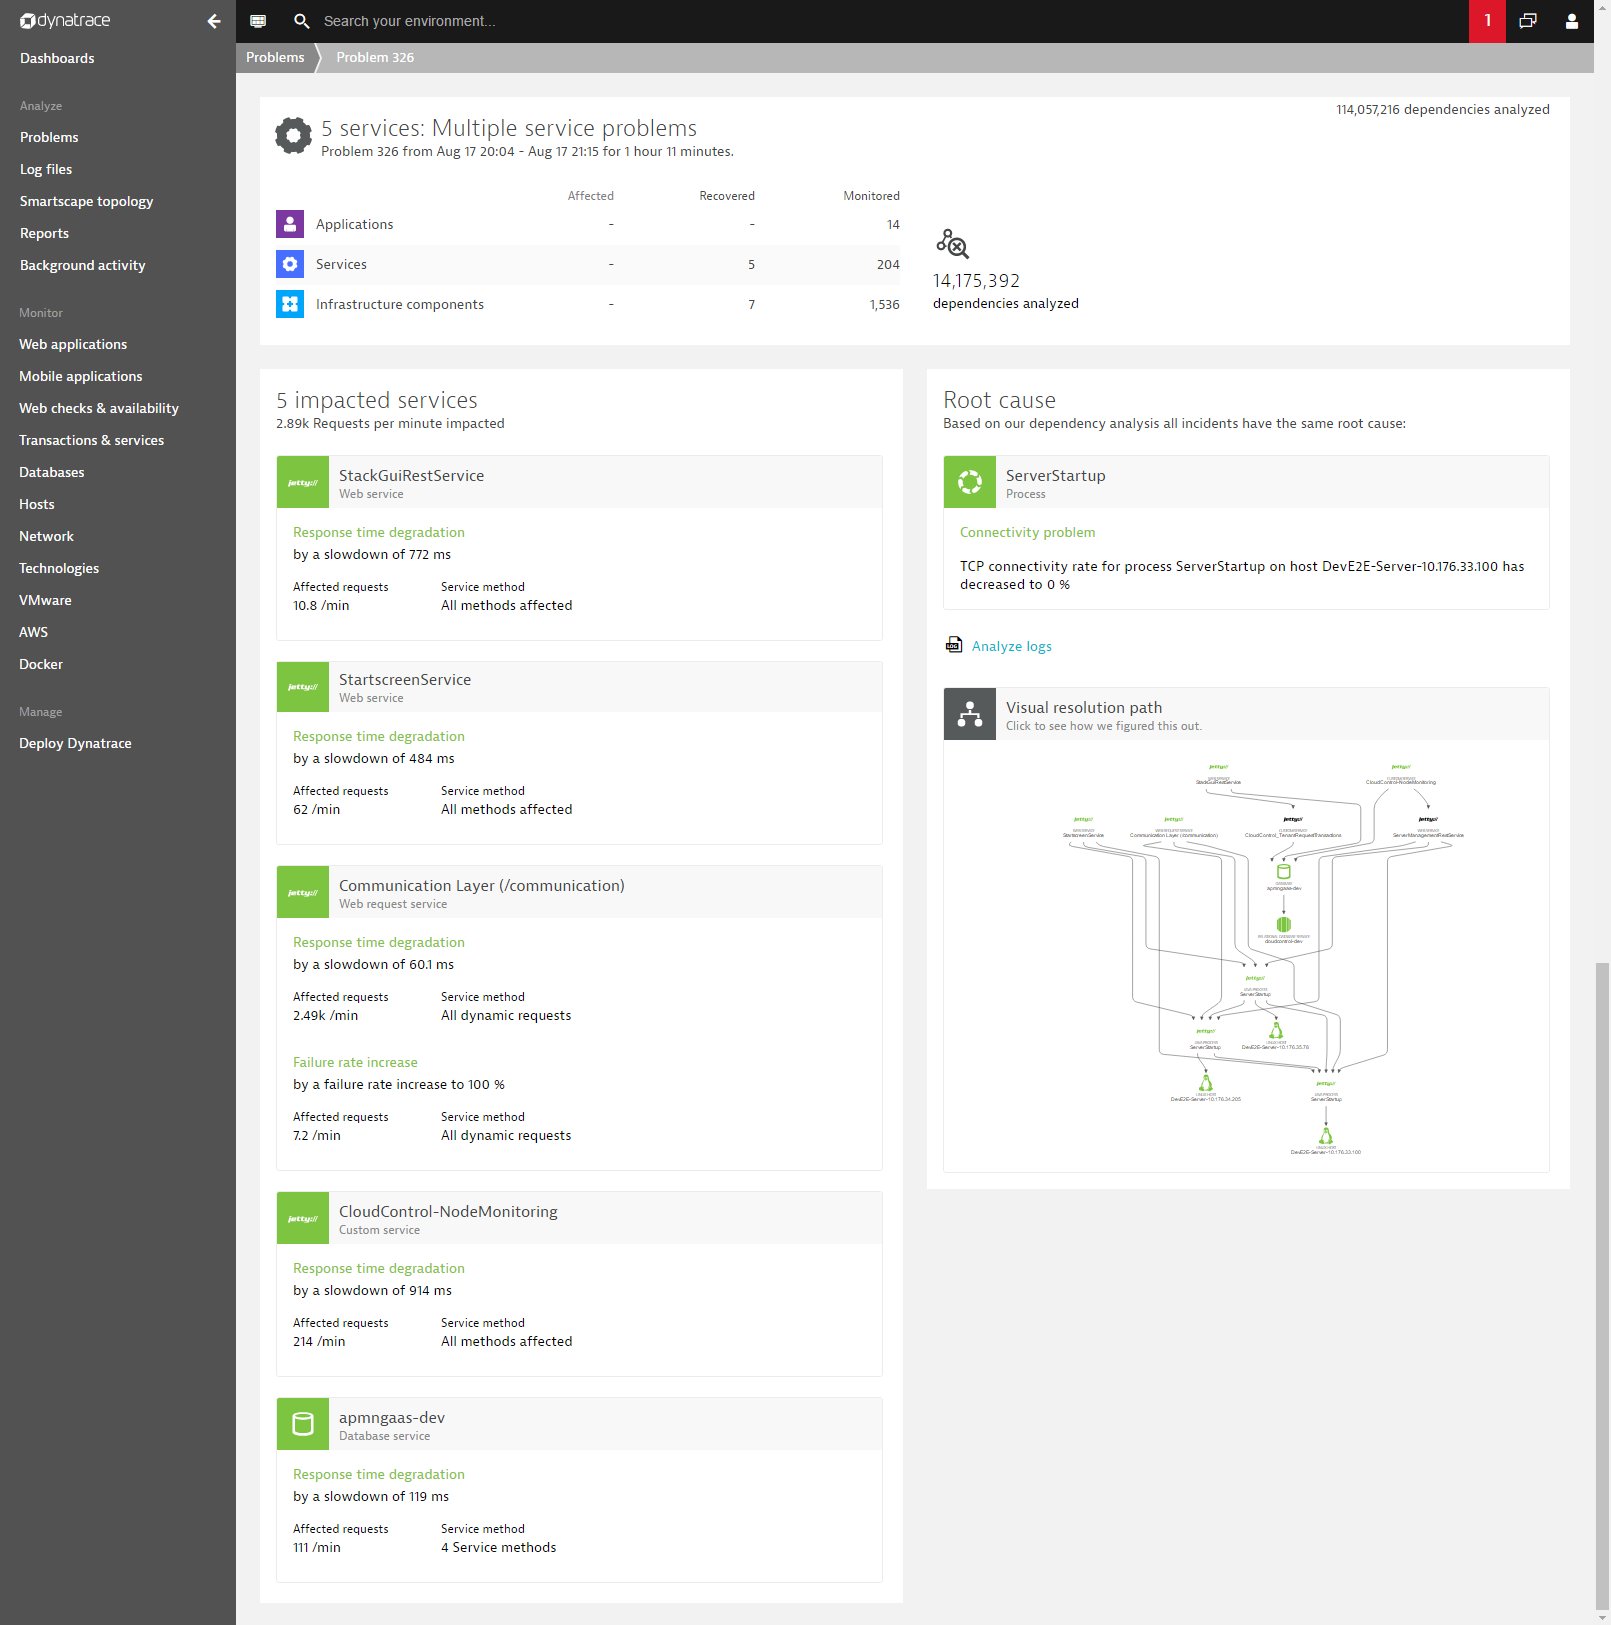
We’ve redesigned our Problem details page to make it even easier to see root-cause analysis insights and the impact of problems on individual components, at a glance.
While the type of information included on each Problem page hasn’t changed, we’ve improved the design of the page to more clearly show all impacted services and components on the left-hand side and all root-cause analysis detail on the right-hand side. We’ve also introduced consistent iconography across the page for all impacted services and components, making it easy to track specific entities within the Visual resolution path.
While reduced in size, the top section of the page still includes overview statistics that show how the selected problem affects your environment components, as shown below.
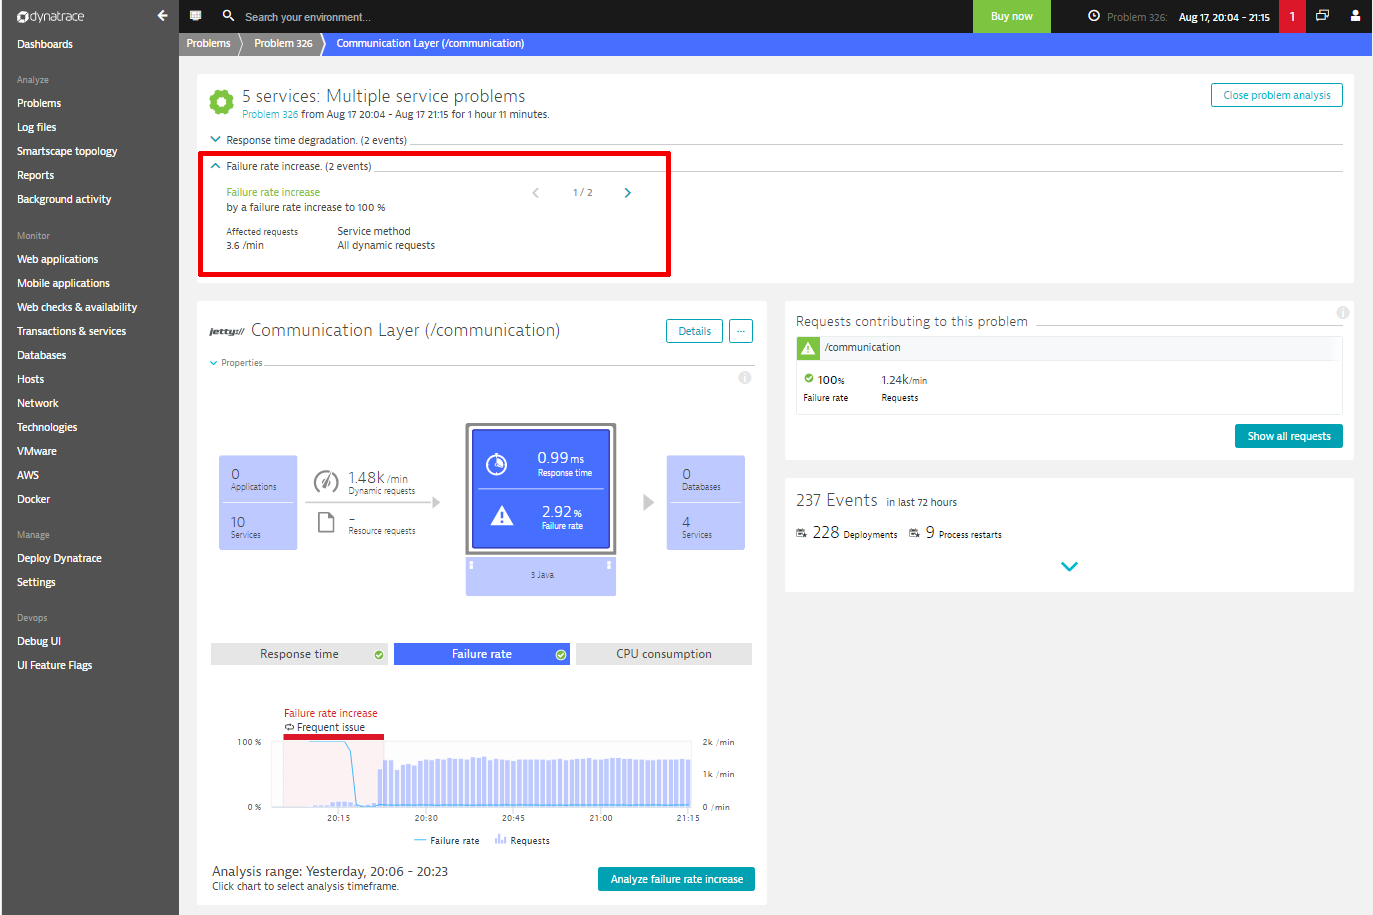
Click any of the affected components listed on the left-hand side to view details about the problem in the context of the affected component, as shown below. The global Time frame selector automatically adjusts the analysis time frame to that of the problem you’re analyzing. To quit problem analysis and return to the previously-selected analysis time frame, open the Time frame selector and click Close problem analysis. You can return to the time frame of the selected problem anytime by selecting it from the Recently user time frames list.
Each affected component page includes a new problem-context header that summarizes the problem details as related to the affected component (see example below). Event types are grouped into drop lists. Expand the droplists to view the details of individual events.
Visit our dedicated webpage about Automatic root-cause analysis to learn more about how Dynatrace shows you the root-cause of performance problems.


Looking for answers?
Start a new discussion or ask for help in our Q&A forum.
Go to forum