Share Your PurePath was my personal program to help Dynatrace AppMon users make sense of their captured application performance data. I analyzed their exported PurePaths and sent my findings back in a PowerPoint. Thanks to several hundred users that sent me PurePaths in the last years, I’ve written numerous blogs based on the problems we discovered. Many of the detected patterns made it into an out-of-the-box feature in AppMon.
In our new Dynatrace world, most of this Analysis Magic happens automatically, behind the scenes and on a much larger data set, on a new scale. We invested in OneAgent (better quality full stack data), Anomaly Detection (multi-dimensional baselining) and the Dynatrace Artificial Intelligence. If you want to read how the AI works, check out my blog on Dynatrace AI Demystified.
But does it work outside of your demo environments?
Many of our AppMon users, folks that use competitive products and have seen a Dynatrace demo, often wonder: “Looks great in the demo! BUT – what type of problems does Dynatrace detect in non-demo environments? How will it make my life as a Cloud Operator, SRE, DevOps Engineer or Performance Architect easier?”
Educate through Share your AI-Detected Problem!
To help shine a light on automatic problem detection in Dynatrace, I thought to start a new program that I call: “Share your AI-Detected Problem”
Any Dynatrace user (paying or trial) can send me a link or screenshots to their Dynatrace AI-detected Problem(s). The purpose of this is not so much about diagnosing the captured data and finding root cause (that step has been automated), it is more about educating the larger digital performance community on what type of problems our AI detects and explains how to access the root cause data for faster problem resolution. I also share my thoughts building self-healing, auto-remediation scripts for these scenarios. I strongly believe that this is going to be our next major task in our self-driven IT industry!
Now, for this blog I picked three simple scenarios:
- 3rd party Gemfire Service Outage resulting in high end user service failure rate
- Broken links (HTTP 404) on new rolled out features on Dynatrace Partner Portal
- Slow disk on EC2 causing Nginx errors and impacting dynatrace.com slowdown!
Problem Ticket #1: Gemfire Service Outage
This problem was detected during a recent Dynatrace Proof of Concept. Special thanks to my colleagues Lauren, Jeff, Matt and Andrew for sharing this story. They forwarded me email exchanges with the prospect – highlighting the detected impact and the actual root cause. For data privacy reasons, the screenshots have been blurred but I think you can see how helpful the AI was in this particular case:
Step #1: Everything Starts with a Problem Ticket
Every time Dynatrace detects a problem, it opens a problem ticket which stays open until the problem impact was resolved. Dynatrace captures all relevant events while the problem is impacting your end users and SLAs. In demos, we most often show the problem details and each automatically correlated event (log messages, infrastructure problems, configuration changes, response time hotspots …) in the Dynatrace UI. In production environments or during Proof of Concepts, our users typically trigger notifications via the Dynatrace Incident Notification Integration. (e.g. send the details to ServiceNow, PagerDuty, VictorOps, OpsGenie, a Lambda Function, our mobile app…)
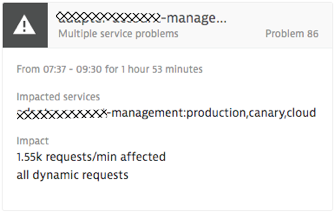
Now, let’s get to the first shared problem. The following screenshot is what Dynatrace shows in the problem overview screen for each detected problem. Dynatrace automatically detected that multiple services were impacted over a period of 1h 53mins. It lists all impacted services by name and gives us information about how many service requests were actually impacted.
Step #2: Exploring Problem Details
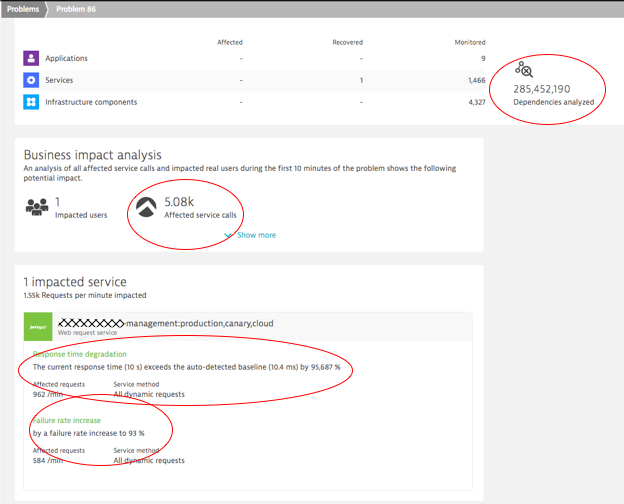
Full Problem Details –also accessible via the Problem REST API – shows us just how much data and dependencies Dynatrace analyzed for us, the actual problem, the impact and the root cause:
Step #3: Clicking on the Impacted Service to Find Root Cause
On the problem ticket, we can either click into the Impacted Service or into the detected Root Cause section. In our case, the next click is on the Impacted Service – Failure Rate, which has increased to 93%. This brings us to the automated baseline graph, showing how Dynatrace detected this anomaly. All of this happened fully automated, without having to configure any thresholds, or without having to tell Dynatrace which services and endpoints the service offers. Just install the OneAgent on your hosts. The rest is auto-detected. That’s true zero-configuration monitoring.
In the baseline graph, which is available for all service endpoints across multiple dimensions, the problematic time range gets automatically marked by Dynatrace due to its abnormal behavior:
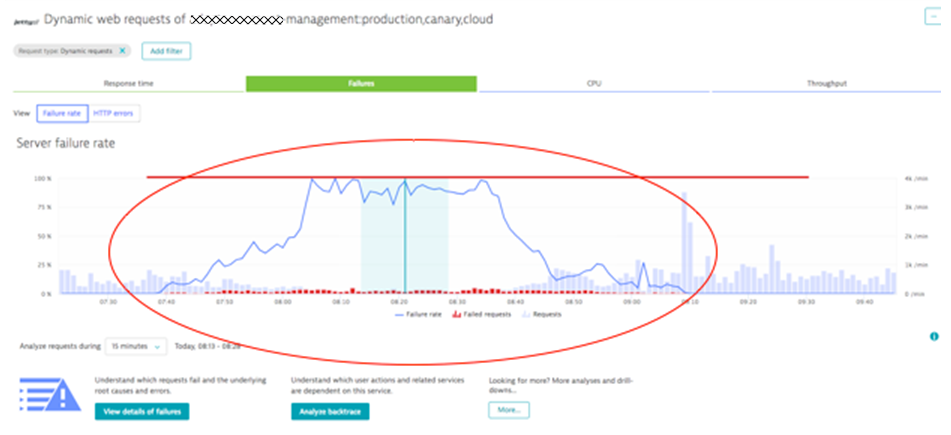
Tip: Notice the different diagnostics options in the screen above, such as switching between Failure rate and HTTP errors, analyzing Response Time, CPU or Throughput issues (the top tabs) or clicking on the next diagnostics options such as View details of failures or Analyze backtraces. If you want to learn more about these diagnostics options, I suggest you watch my recent Performance Clinic on Basic Diagnostics with Dynatrace.
In our case, we want to see the actual root cause of the increased failure rate. Clicking on View details of failures brings us to that answer:
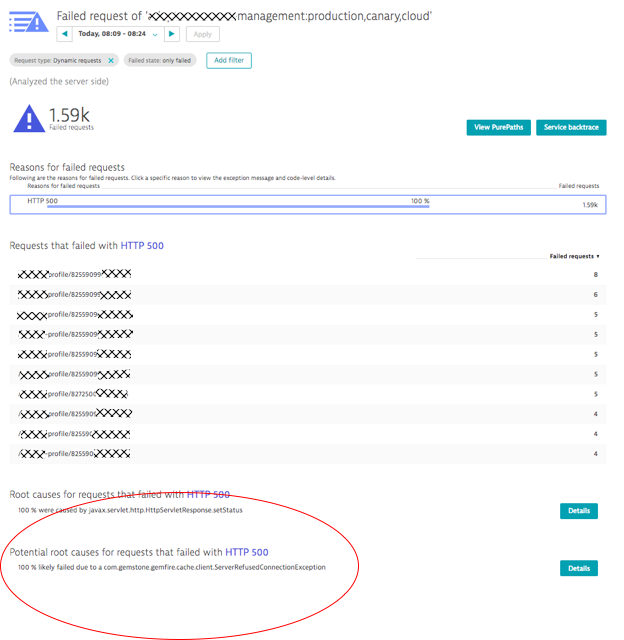
Clicking on the Details button in the bottom left even reveals the actual code that tries to call Gemfire but fails with the ServerRefusedConnectionException.
Summary: The external cache service Gemfire became unavailable. This caused requests on our monitored service to receive HTTP 500s from Gemfire, which ultimately led to higher failure rate back to the end user. If the host running Gemfire would have been instrumented with a OneAgent as well, the AI would have automatically pointed us to the crash of that process which ultimately turned out to be the issue.
Self-Healing thoughts: In a recent blog, I started to write about Self-Healing and started to list a couple of auto-remediating examples. In this scenario, we could write self-healing scripts that validate why Gemfire is refusing network connections. It could be a crashed service, a network issue or a configuration issue on the connection pools on both ends (caller and callee). Using the Dynatrace REST API allows us to write better mitigation actions, because all this root cause data is exposed in the context of the actual end user impacting problem.
Problem Ticket #2: Functional Issues on new Feature Rollout
The next problem ticket is from our own Dynatrace production environment we use to monitor our key web properties such as our website, blog, community, support portal … – let’s take-a-peek!
Step #1: Problem Ticket Details
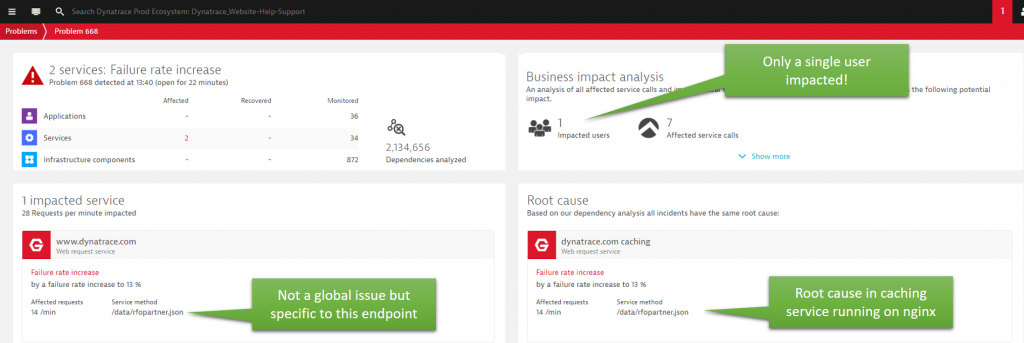
Problem 668 was a problem I looked at while it was still ongoing – hence the color of the problem still being red. This is indicating that the problem has been open for the last 22 minutes. This problem shows us that Dynatrace not only detects anomalies for the whole service, but also on individual service or REST endpoints as well (that’s the automated multi-dimensional baselining capability). In case of Problem 668, Dynatrace detected a Failure Rate increase to 13% on a special endpoint we expose on www.dynatrace.com:
Step #2: Root Cause Analysis
At first, it almost seems odd that Dynatrace alerts just because one user is having an issue. But once we dig deeper, we understand why!
Clicking on the Impacted Service details brings us to the Failure Rate graph for www.dynatrace.com. The view gets automatically filtered to the problematic endpoint which is /data/rfopartner.json. The sudden jump in failure rate triggered the creation of an anomaly event which then resulted into creating that problem ticket:
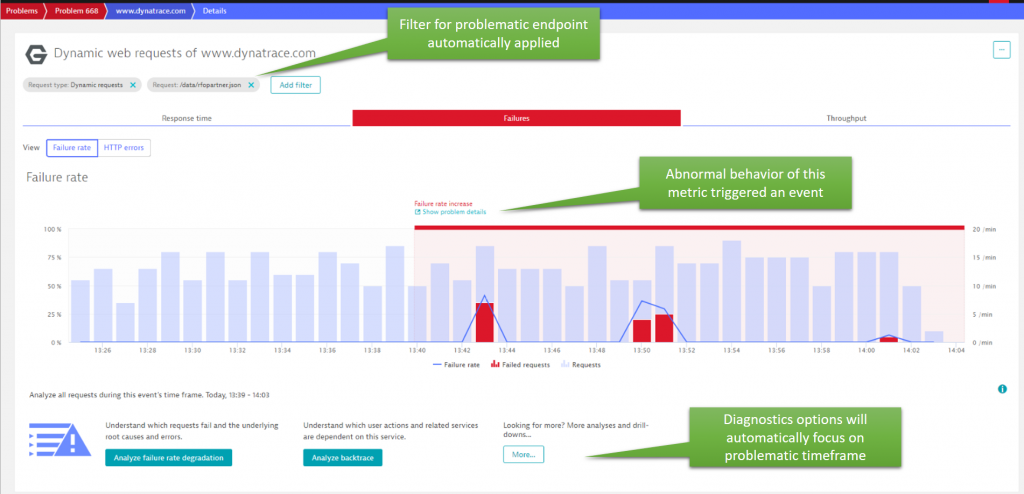
Root cause details for that failure rate spike are just one click away: Analyze failure rate degradation!
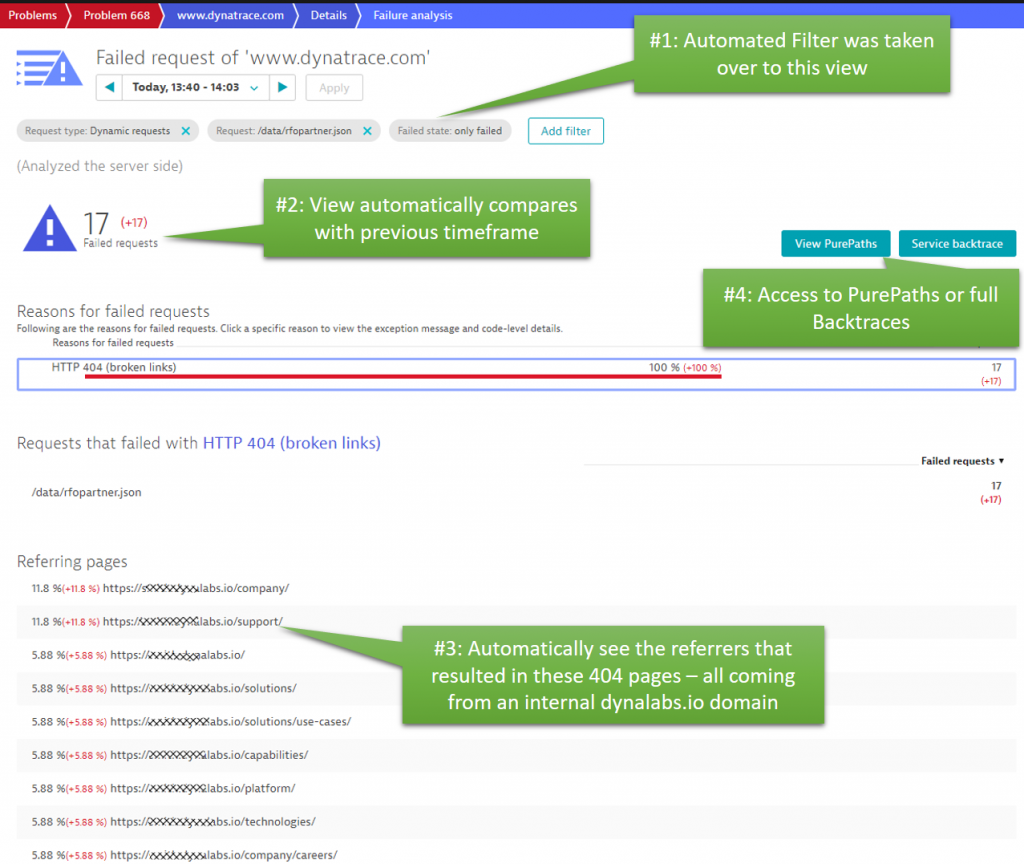
Knowing that these 404s are “only” coming from an internal site is good news, as no real end user has yet seen that problem. But why is that? Turns out that this internal domain was a test site that is used to validate a new feature on our partner portal, that was soon to be released. Automatically detecting this behavior allows our partner portal website team to fix this problem of incorrect links, before deploying this version to the live system. You should check out a YouTube video I did with Stefan Gusenbauer, who showed us how we use Dynatrace internally in combination with automated functional regression tests. Instead of just relying on the functional test results, we can combine the functional test results with the data Dynatrace captured.
Back to this problem ticket: The actual root cause of the 404 was in a service hosted on nginx that connects some of the new capabilities of the partner portal with some legacy data. The PurePaths captured for these errors show exactly that the 404s originate in the legacy connector service and how these 404s propagate back to the www.dynatrace.com.
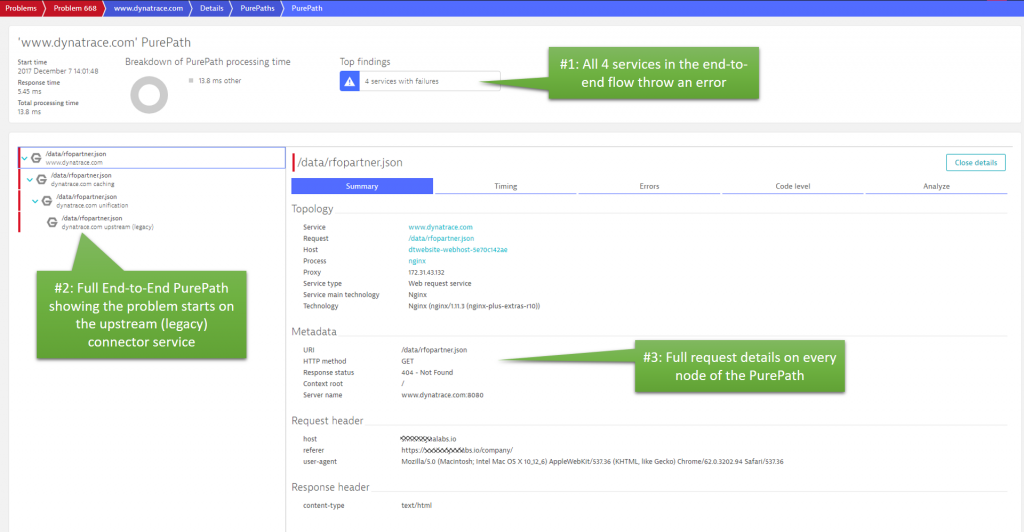
Summary: For certain types of applications, it may not make sense to alert on 404s or even other type of errors. In this scenario, the out-of-the-box behavior has proven to be very useful. If you want to change the way Dynatrace detects failures, check out the latest blog post from Michael Kopp on custom failure detection rules. It can be customized to your application, services and business needs.
This problem ticket also showed us that the AI also works well in low traffic environments. As long as there is something abnormal, it will be detected!
Self-Healing thoughts: 404s can have a variety of reasons. It could be an outdated cached version of your website that is still referencing old resources that you have moved. It could be a marketing campaign that accidentally sent out incorrect URLs (has happened to me ☹). It can be JavaScript coding problem creating incorrect dynamic URLs or it can be a deployment mistake on your server-side such as not deploying the right files or not setting the correct file permissions.
I am sure there are more use cases than these. For each use case, there are different actions to take – or let’s say – different people to notify. In case of 404s, a smart “self-healing” or “smart alerting” problem response would be to analyze where these 404s come from – whether there is an active marketing campaign going on or whether a recent deployment happened that should have deployed these files. Depending on the actual observed 404s and business and domain knowledge you have about your system, you can notify the right teams. Otherwise these 404s just end up in some operator’s overfull alert spam inbox – and nobody wants that! 😊
Problem Ticket #3: Cascading effect of a slow EC2 disk
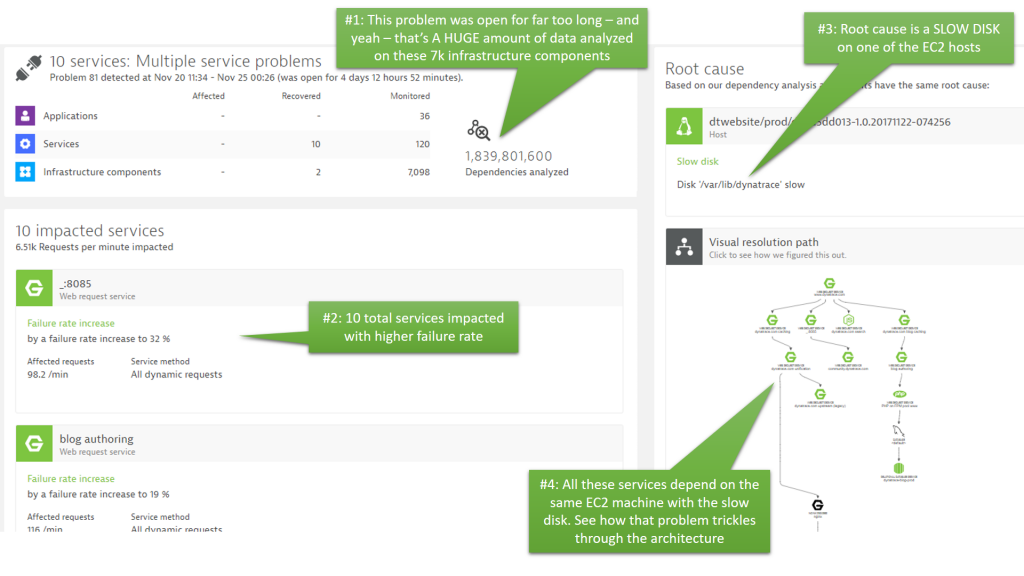
The last problem ticket for this blog is another one I saw in our own production environment. Sad to say that this problem was open for more than 4 days while it impacted up to 10 of our web services (blog, website, community, …).
We run most of our infrastructure in the public cloud. If you have listened to some of our recent podcasts, e.g. Infrastructure as Code with Markus Heimbach – you will learn that we constantly create and destroy certain resources (EC2 instances, containers, for example) when deploying parts of our website. Disk volumes, however, stay up as they contain the current website content, log files, … and just get updates during a deployment. In this problem ticket, it seems we had an EC2 disk mounted to several of our coming and going EC2 instances. The disk has been having latency issues and impacting each EC2 instance that was mounting to it. Let’s walk through our workflow again:
Step #1: One Slow Disk and almost 2 Billion Dependencies
The following screenshot and the callouts speak for themselves. It should be clear what the data tells us. Dynatrace analyzed almost 2 billion dependencies over the course of this problem which was open for more than 4 days. In that period, our infrastructure has seen many EC2 instances coming and going thanks to our continuous delivery process. The root cause – a slow disk – remained throughout that time and impacted up to 10 services that relied on that disk:
Step #2: Problem Evolution – Understanding your dynamic architecture!
Instead of going straight to the slow disk, which has been identified as the root cause, I want to draw your attention to the “Visual Resolution Path”. This view gives you a time-lapse view of all the events Dynatrace observed in all the components (static or dynamic) that contributed to the service failures. The following is an animated gif that shows how Dynatrace replays these events for you in the Problem Evolution UI:
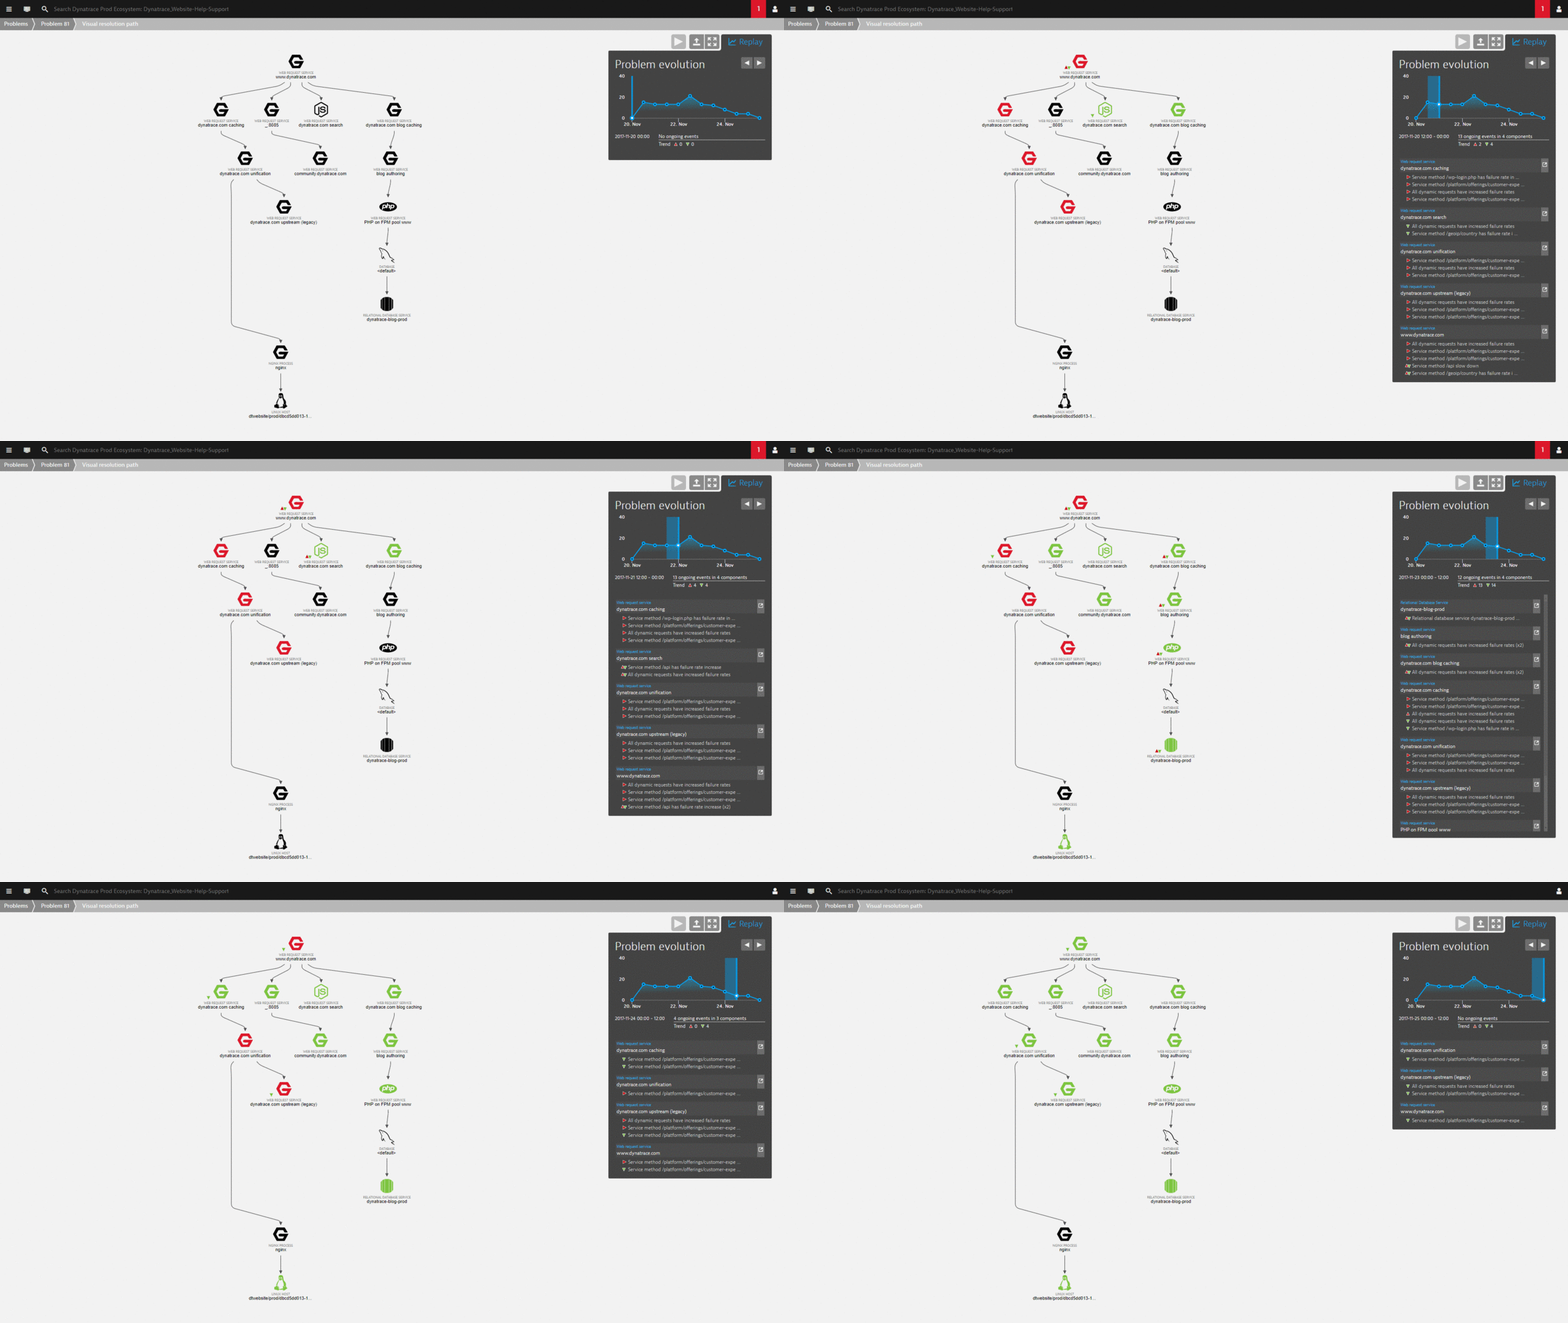
The magic with this view is that it automatically correlates all important events that happened on all these impacted and depending components. There is no need to log in to remote servers to access log files or look at different monitoring tools to capture infrastructure, process or service metrics. It’s all consolidated into this view. And best of all – all this data is also accessible via the REST API which allows us to build even better self-healing actions 😊
Step #3: More Root Cause Details
From either the Problem Details view or from the Problem Evolution view we can drill to the EC2 instances that were mounted to that slow disk. When clicking on the Root Cause link, we get to zoom in on the EC2 instance that was alive when the problem was first detected. We can see the spikes in disk read/write latency very clearly:
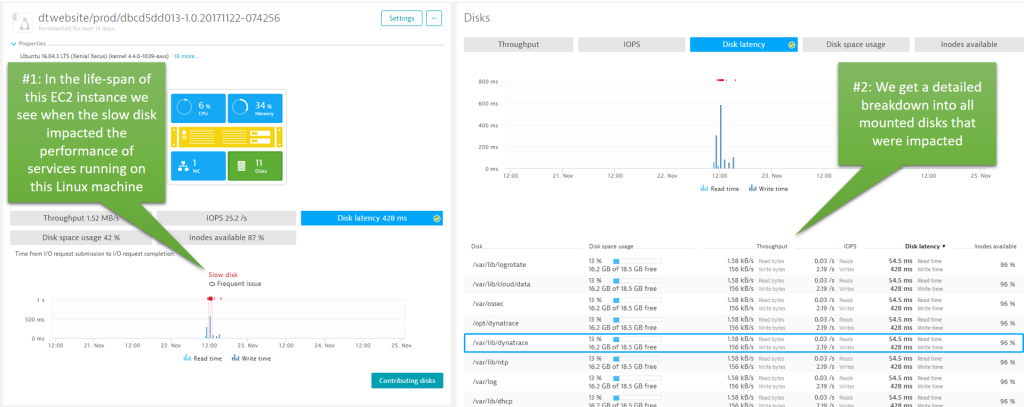
Summary: Turned out we had a combination of undersized EC2 volumes, EC2 configuration changes and different disk access patterns of some of our services. The combination of these caused a perfect storm, resulting in high latency.
Self-Healing: When it comes to infrastructure issues like these, we could use the Dynatrace Root Cause data and execute specific remediating actions against the underlying EC2 environment. We could trigger a Lambda function that makes calls to the AWS REST API to fix configuration problems or simply add more disk capacity on the fly. These actions will be specific to your architecture and resource configuration but I believe we can automate many of the “common remediation actions” in a much smarter way by having this detailed root cause and impact analysis data.
Help me educate and innovate on AI & Self-Healing
Let me re-iterate my offer of “Share your Problem Pattern”. I am more than happy to start educating our community on common problem patterns we see. Collectively, we can discuss what self-healing actions to execute and how to automate them in different environments and using different technologies and frameworks. We will do it “one problem pattern at a time!” 😊


Looking for answers?
Start a new discussion or ask for help in our Q&A forum.
Go to forum