We’re happy to announce that Dynatrace has extended automatic and intelligent observability for serverless workloads.
With our enhanced AWS Lambda extension, we bring the power of Dynatrace PurePath 4 automatic tracing technology to serverless function observability. This gives you seamless end-to-end distributed tracing for AWS Lambda functions without touching any code through auto-instrumentation, thereby helping you to better understand potential issues that may impact your end users’ experience.
The unique capabilities of the enhanced AWS Lambda extension include:
- An end-to-end distributed tracing view with full visibility across hybrid and multi-cloud environments
- Mobile and browser experience directly traced into connected backends, including AWS Lambda (see also Dynatrace RUM and Session Replay)
- Precise AI-powered answers, provided by Dynatrace Davis AI
- Actionable analytics across the entire stack, including:
Serverless can accelerate innovation (and introduce blind spots)
Gartner predicts that, by 2025, 50% of all global enterprises will have deployed serverless function platforms as a service (fPaaS), up from only 20% today.
Serverless architectures help developers innovate more efficiently and effectively by removing the burden of managing underlying infrastructure. They’re typically used to bind services together and to shield them from one another. For example, Amazon Alexa extensions are implemented as AWS Lambda functions.
However, while they provide significant benefits, serverless functions also pose several challenges. For example, they’re highly dynamic and often short-lived, which makes it difficult to identify issues and find their root causes before they impact business revenue or customer experience. Serverless functions don’t exist in a vacuum, so it’s critical to understand how they impact customer-facing web applications, mobile apps, or APIs and how they interact with other functions, services, and classic technology stacks.
Due to the complexity of these environments, developers and DevOps teams are increasingly spending more time instrumenting serverless apps and services, which limits their ability to focus on building and shipping new services.
See your AWS serverless workloads in full context with customer experience and business outcome metrics
Dynatrace is happy to announce its enhanced AWS Lambda extension, expanding its support for Amazon Web Services (AWS) Lambda and serverless architectures. With automatic instrumentation and with no code changes, the enhanced Dynatrace AWS Lambda extension provides organizations with:
- Automatic and intelligent observability across their application environments, offering precise insights into how Functions as a Service (FaaS) impact user experience and business outcomes
The Dynatrace AI engine, Davis®, automatically and continuously detects anomalies with root-cause precision wherever they occur, enabling teams to proactively optimize user experience. While adjusting to dynamic cloud-native environments, teams can determine the impact of serverless functions and applications on customer experience and business outcomes, thereby improving collaboration between developer and business teams.
- Real end-to-end visibility from the end-user perspective across the entire application environment
Teams can now easily understand the impact of serverless functions on customer-facing web apps, mobile apps, and APIs, and how serverless functions interact with other functions, services, or classic technology stacks, which may run in on-premises datacenters or even on mainframe.
- An easy way for DevOps teams to optimize serverless applications, enabling them to innovate faster with greater confidence and less risk
The new Dynatrace AWS Lambda extension further improves enterprise-grade scalability with low memory overhead, effortless manageability, continuous automation, and granular access-permission controls that support the structures of cloud-native applications teams within large organizations.
In working closely with our customers, we’ve learned that serverless functions are typically used in highly dynamic and complex service landscapes. Without the integration of Dynatrace, potential gaps and blind spots make it difficult to identify issues and find their root causes before they impact the business or customer experience.
Other tools in the market for monitoring AWS Lambda traces can’t deliver real end-to-end visibility from the end-user perspective across all moving parts; they also require heavy manual configuration.
Dynatrace, on the other hand, brings developer visibility to a holistic multi-cloud approach that enables true cross-departmental CloudOps, DevOps, and holistic visibility. Dynatrace not only automates instrumentation efforts, but also automates the analysis of distributed traces in a complete observability context, including related metrics and logs.
Dynatrace provides automatic and intelligent end-to-end observability of AWS Lambda functions
Dynatrace’s enhanced support for AWS Lambda enables us to be sure at all times that our AWS Lambda functions interact flawlessly with each other and the other services in our quickly evolving and expanding AWS environment.
– Robert Trueman, Head of Software Engineering at CDL
The new AWS Lambda extension provides insights into traces and metrics from each monitored Lambda function. This information also enables Davis, the Dynatrace AI causation engine, to place monitored Lambda functions in context with the other services that depend on them to provide out-of-the-box anomaly detection and root cause analysis.
End-to-end distributed tracing with full visibility, across hybrid environments
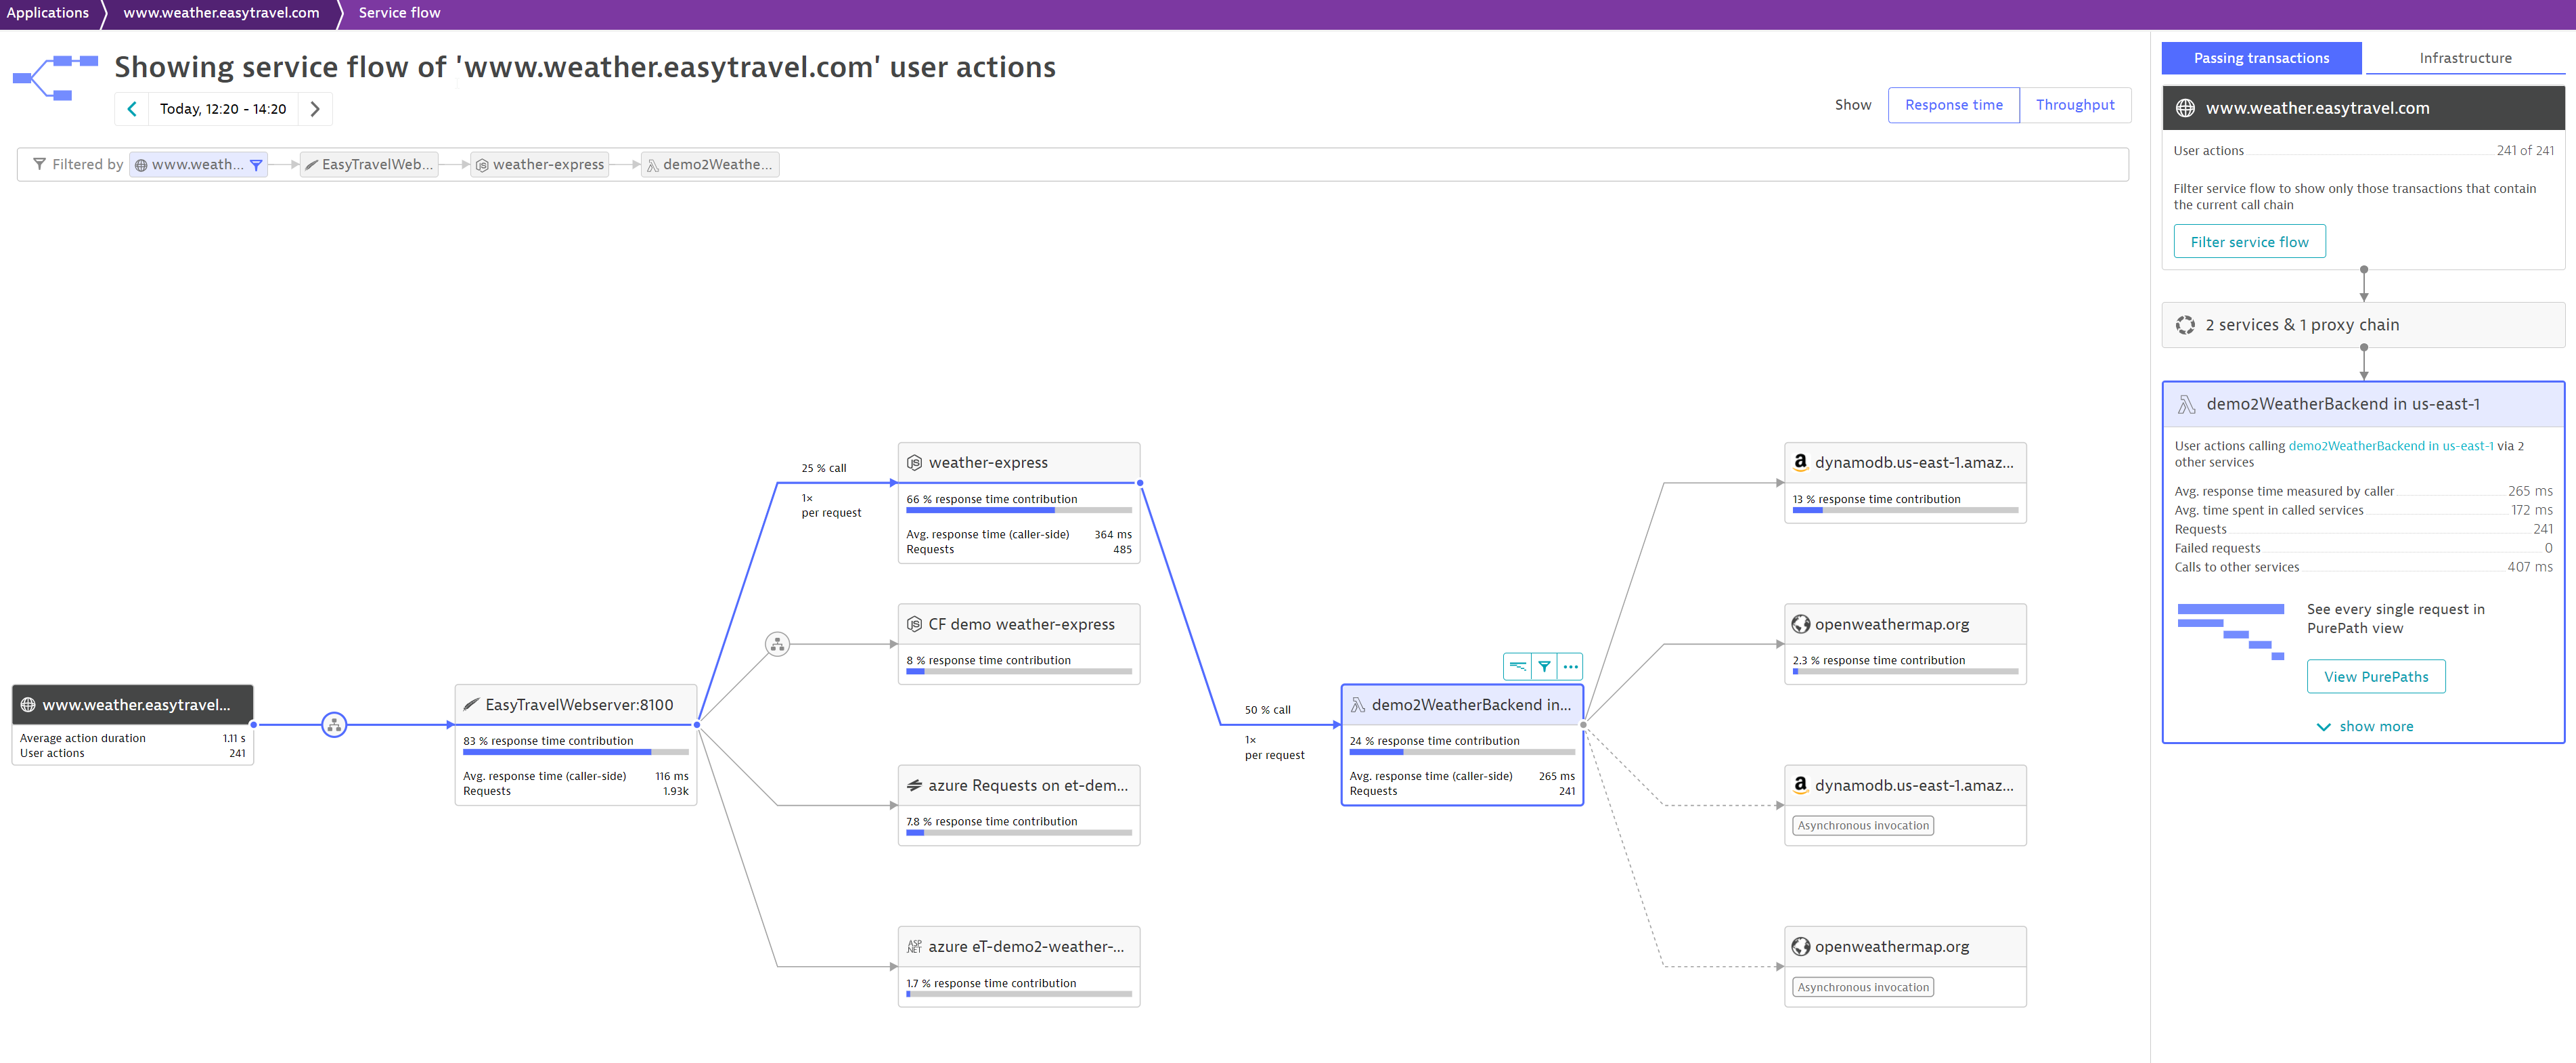
Each monitored AWS Lambda function shows up in Service flow view as a dedicated service, so that you can easily understand its dependencies to other services.
Dynatrace Service flow, powered by PurePath, illustrates the sequence of service calls that are triggered by each service request in your environment across all technologies, including AWS Lambda. This enables you to slice and dice monitoring data based on various attributes so that you can isolate certain flows down to individual requests for even further analysis.
Mobile and browser experience directly traced into connected backends, including AWS Lambda
Dynatrace not only provides visibility into end-to-end distributed traces that span heterogeneous environments out of the box, it also fully integrates with Dynatrace Real User Monitoring.
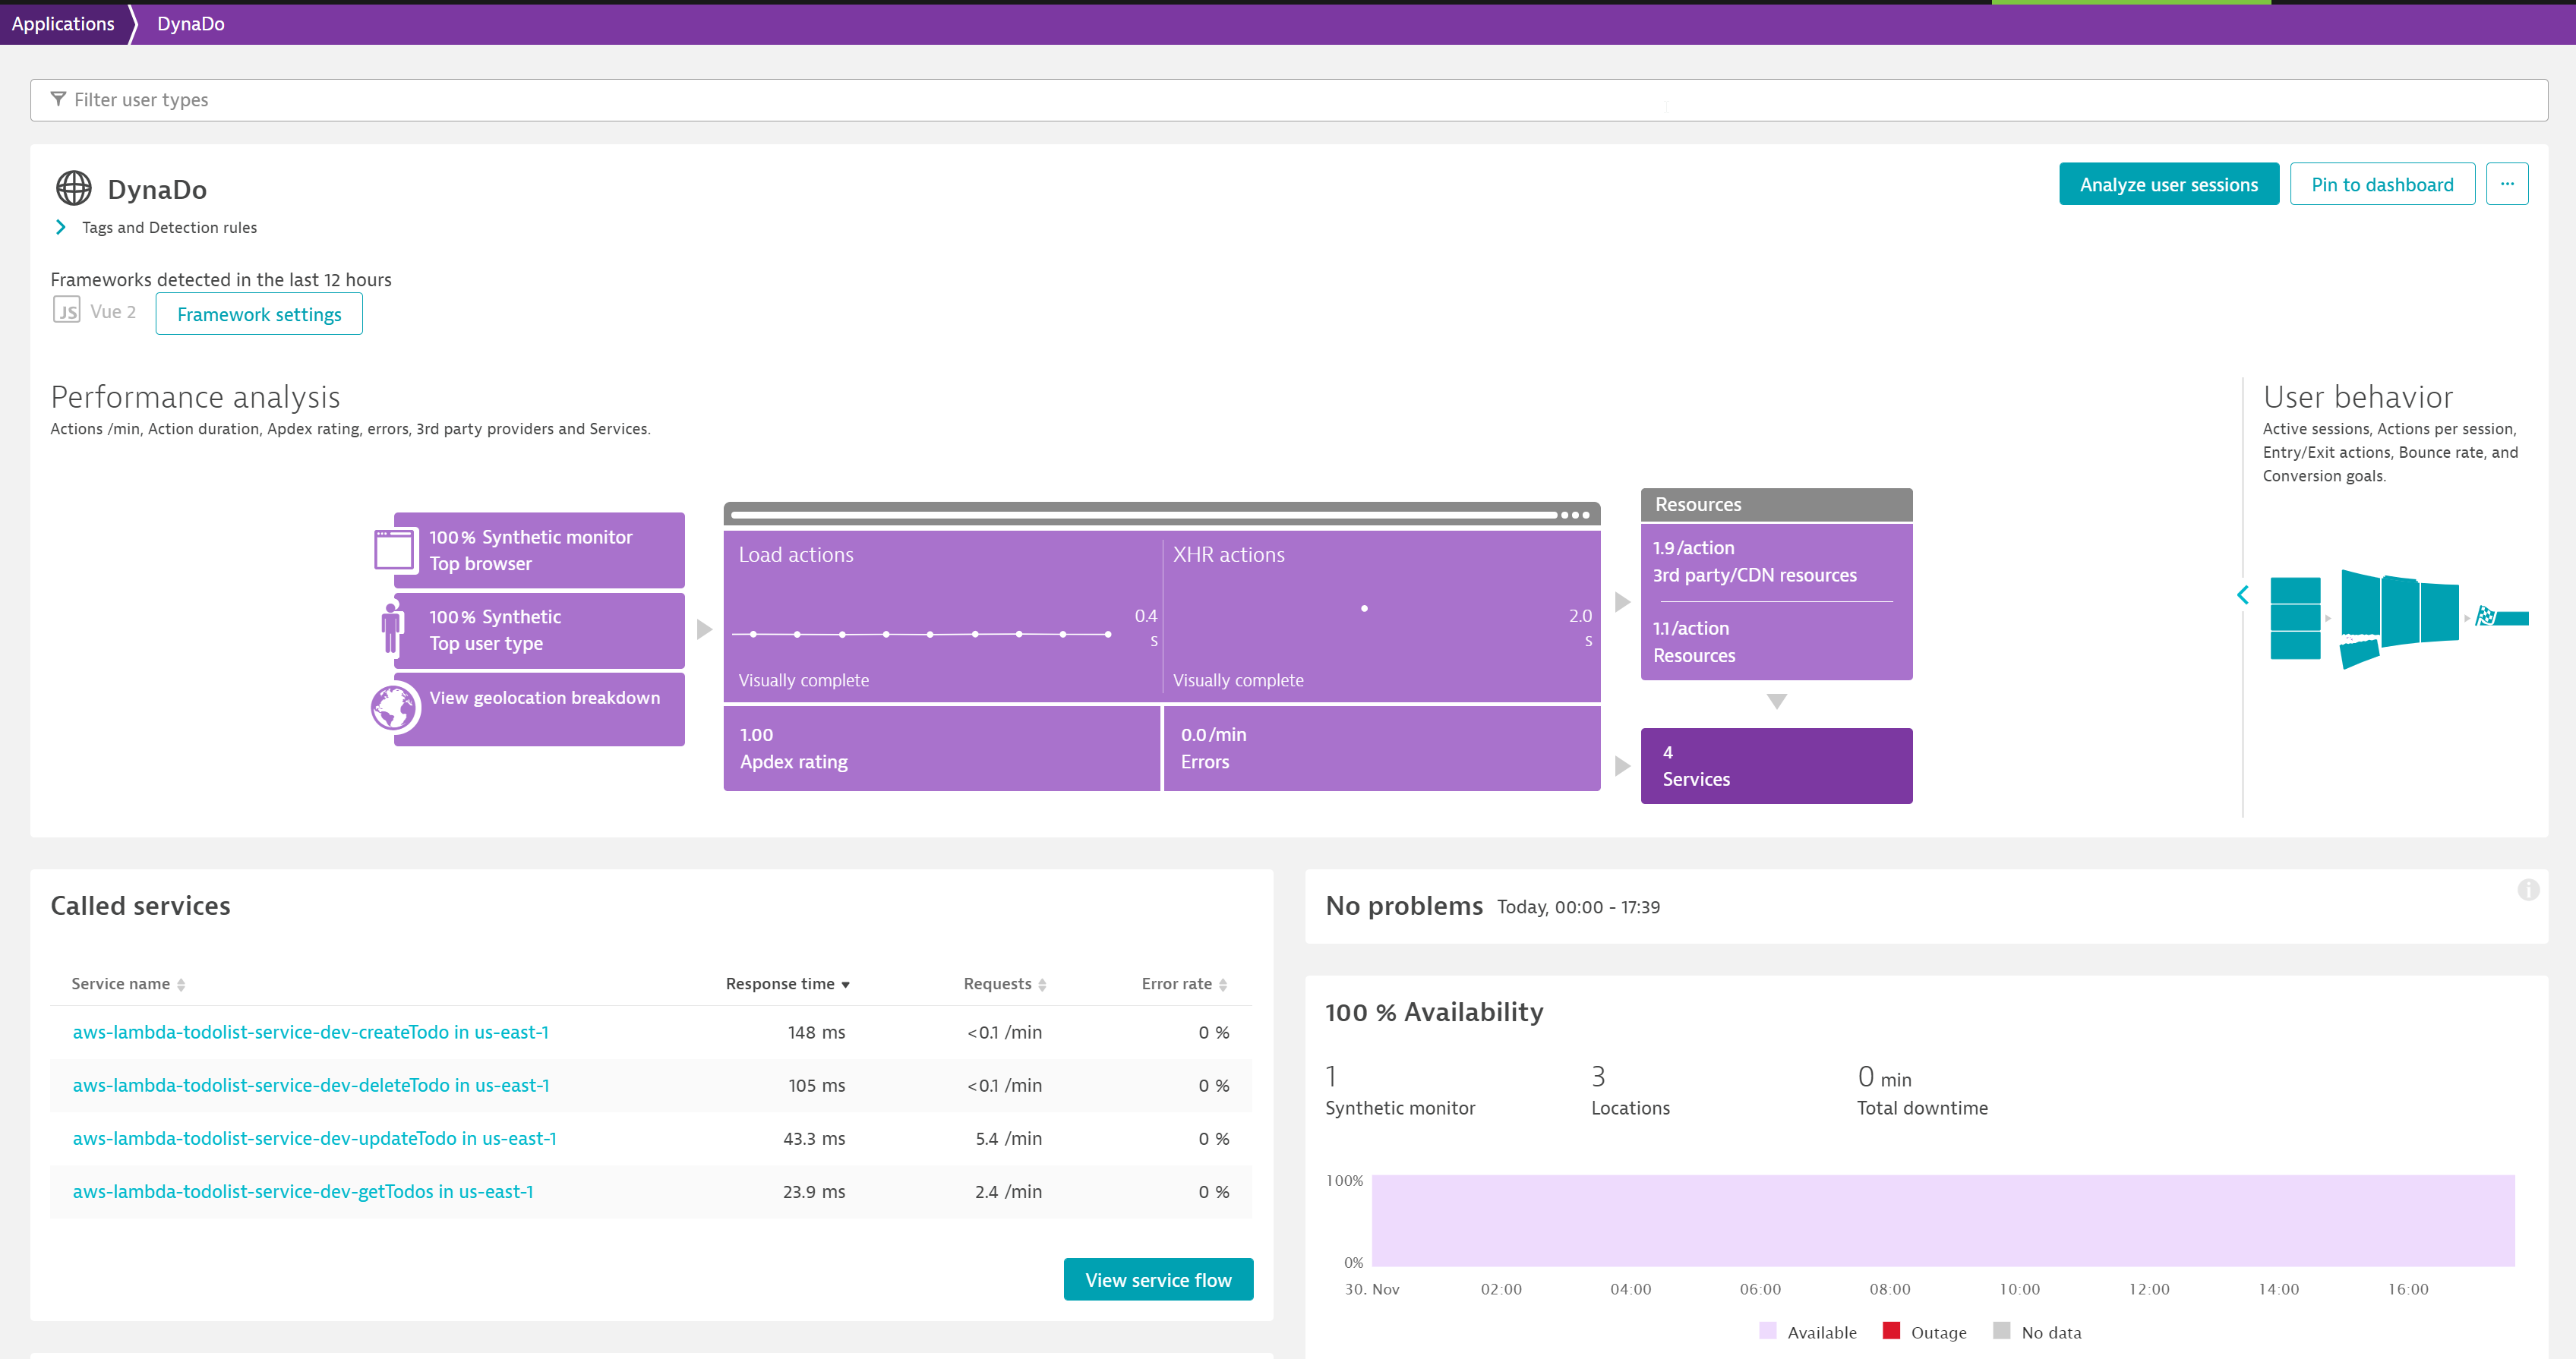
Each of your Lambda functions can be traced end-to-end, starting with the web or mobile application that is monitored with Dynatrace and following the HTTP requests to the Lambda backend. You can find more information about how to set this up in our documentation.
This provides insights into how serverless functions impact your applications, the experience of your users (for example, how long it takes before the visible portion of a webpage renders), and business outcomes (for example, if a call to an external payment provider worked as expected).
Precise AI-powered answers, provided by Dynatrace Davis
Distributed tracing across serverless functions fuels the deterministic AI engine, Davis, to automatically identify root causes for issues before customers encounter them.
As soon as a Lambda function is monitored via the Dynatrace AWS Lambda integration, Dynatrace detects it as a dedicated service and Davis automatically learns its behavior, just as it does for all other services that are monitored Dynatrace.
Each invocation of a Lambda function is automatically put into context with other services, regardless if the Lambda function is called via HTTPS or the AWS SDK.
Actionable analytics across the entire stack
Dynatrace is known for its high-fidelity data, which is collected via PurePath and other data sources to feed our out-of-the-box entity model and the Davis AI. Nevertheless, we also allow you to access this data and to use it in more explorative ways to get insights into the “unknown unknowns” in your environment.
For AWS Lambda we added OOTB cold-start detection as a critical attribute. All collected data is analyzed in context with ingested CloudWatch data, which has been available for quite some time already.
Automatic, cold-start detection for every Lambda invocation
Now you can easily understand how cold starts affect your end users. Functions that have been idle require a “cold” start time before they execute. Combining multiple functions with cold starts can result in significant lag and poor customer experience.
As invocations that lead to the cold start of a Lambda function usually have a significantly higher response time, it’s critical that you know how often cold starts occur, and which individual invocations are affected by them.
For each individual invocation, the Dynatrace Lambda extension automatically detects when a function is cold started. This is critical to understanding how individual cold starts affect your end users and your upstream services. This additional insight enables you to design strategies for handling the effects of cold starts, like warming up your functions or configuring provisioned concurrency for your functions.
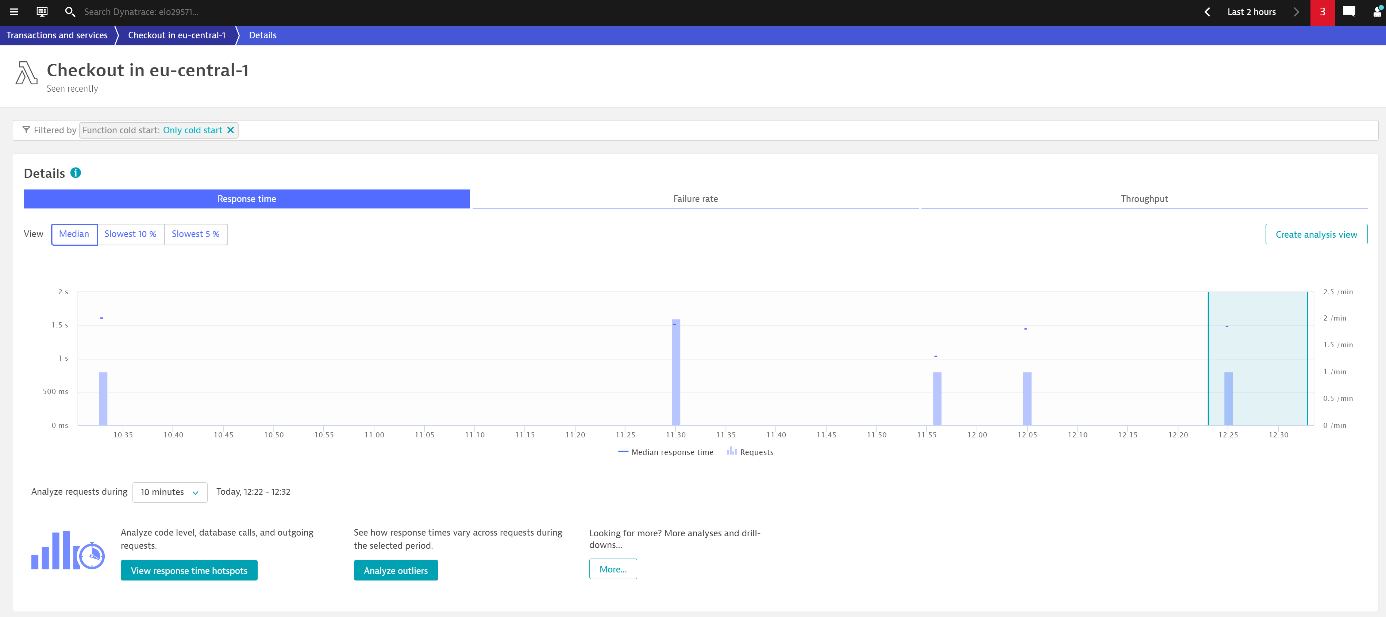
From here you can use Dynatrace analytics capabilities to understand the response time and any failures. Or you can jump to individual PurePaths for further analysis.
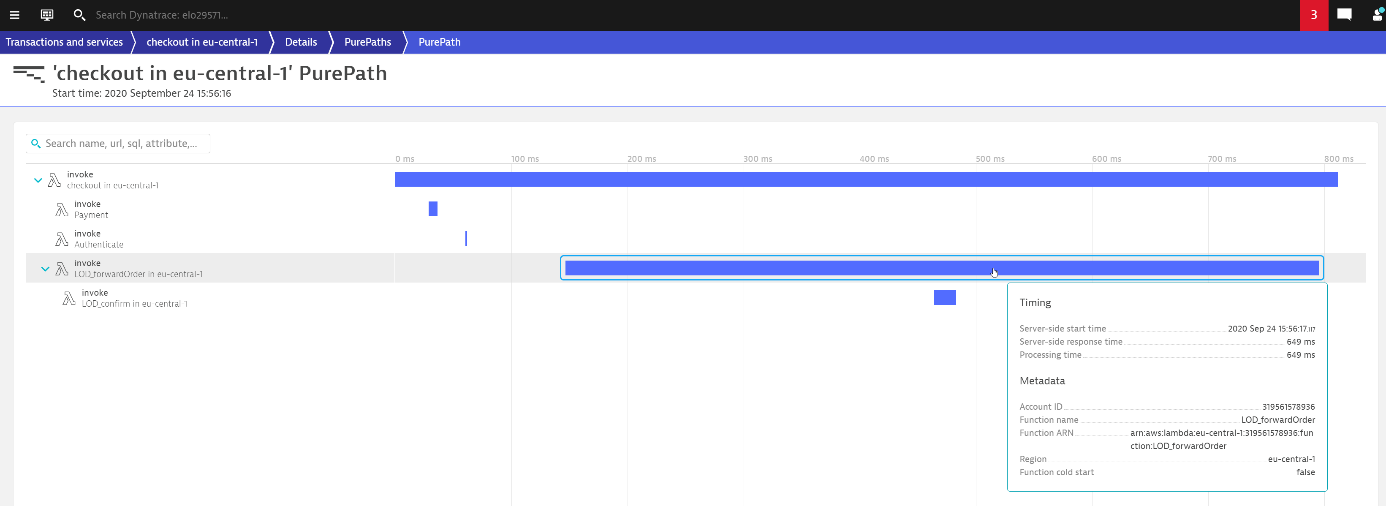
Dynatrace automatically follows the invocations of your AWS Lambda functions, whether they’re invoked via an API Gateway or the AWS Lambda SDK, and puts them into context with a distributed trace, which is represented using patented Dynatrace PurePath distributed tracing technology. This means that you can easily see how your AWS Lambda functions are integrated into your overall service landscape.
A single pane of glass for viewing trace information along with AWS CloudWatch metrics
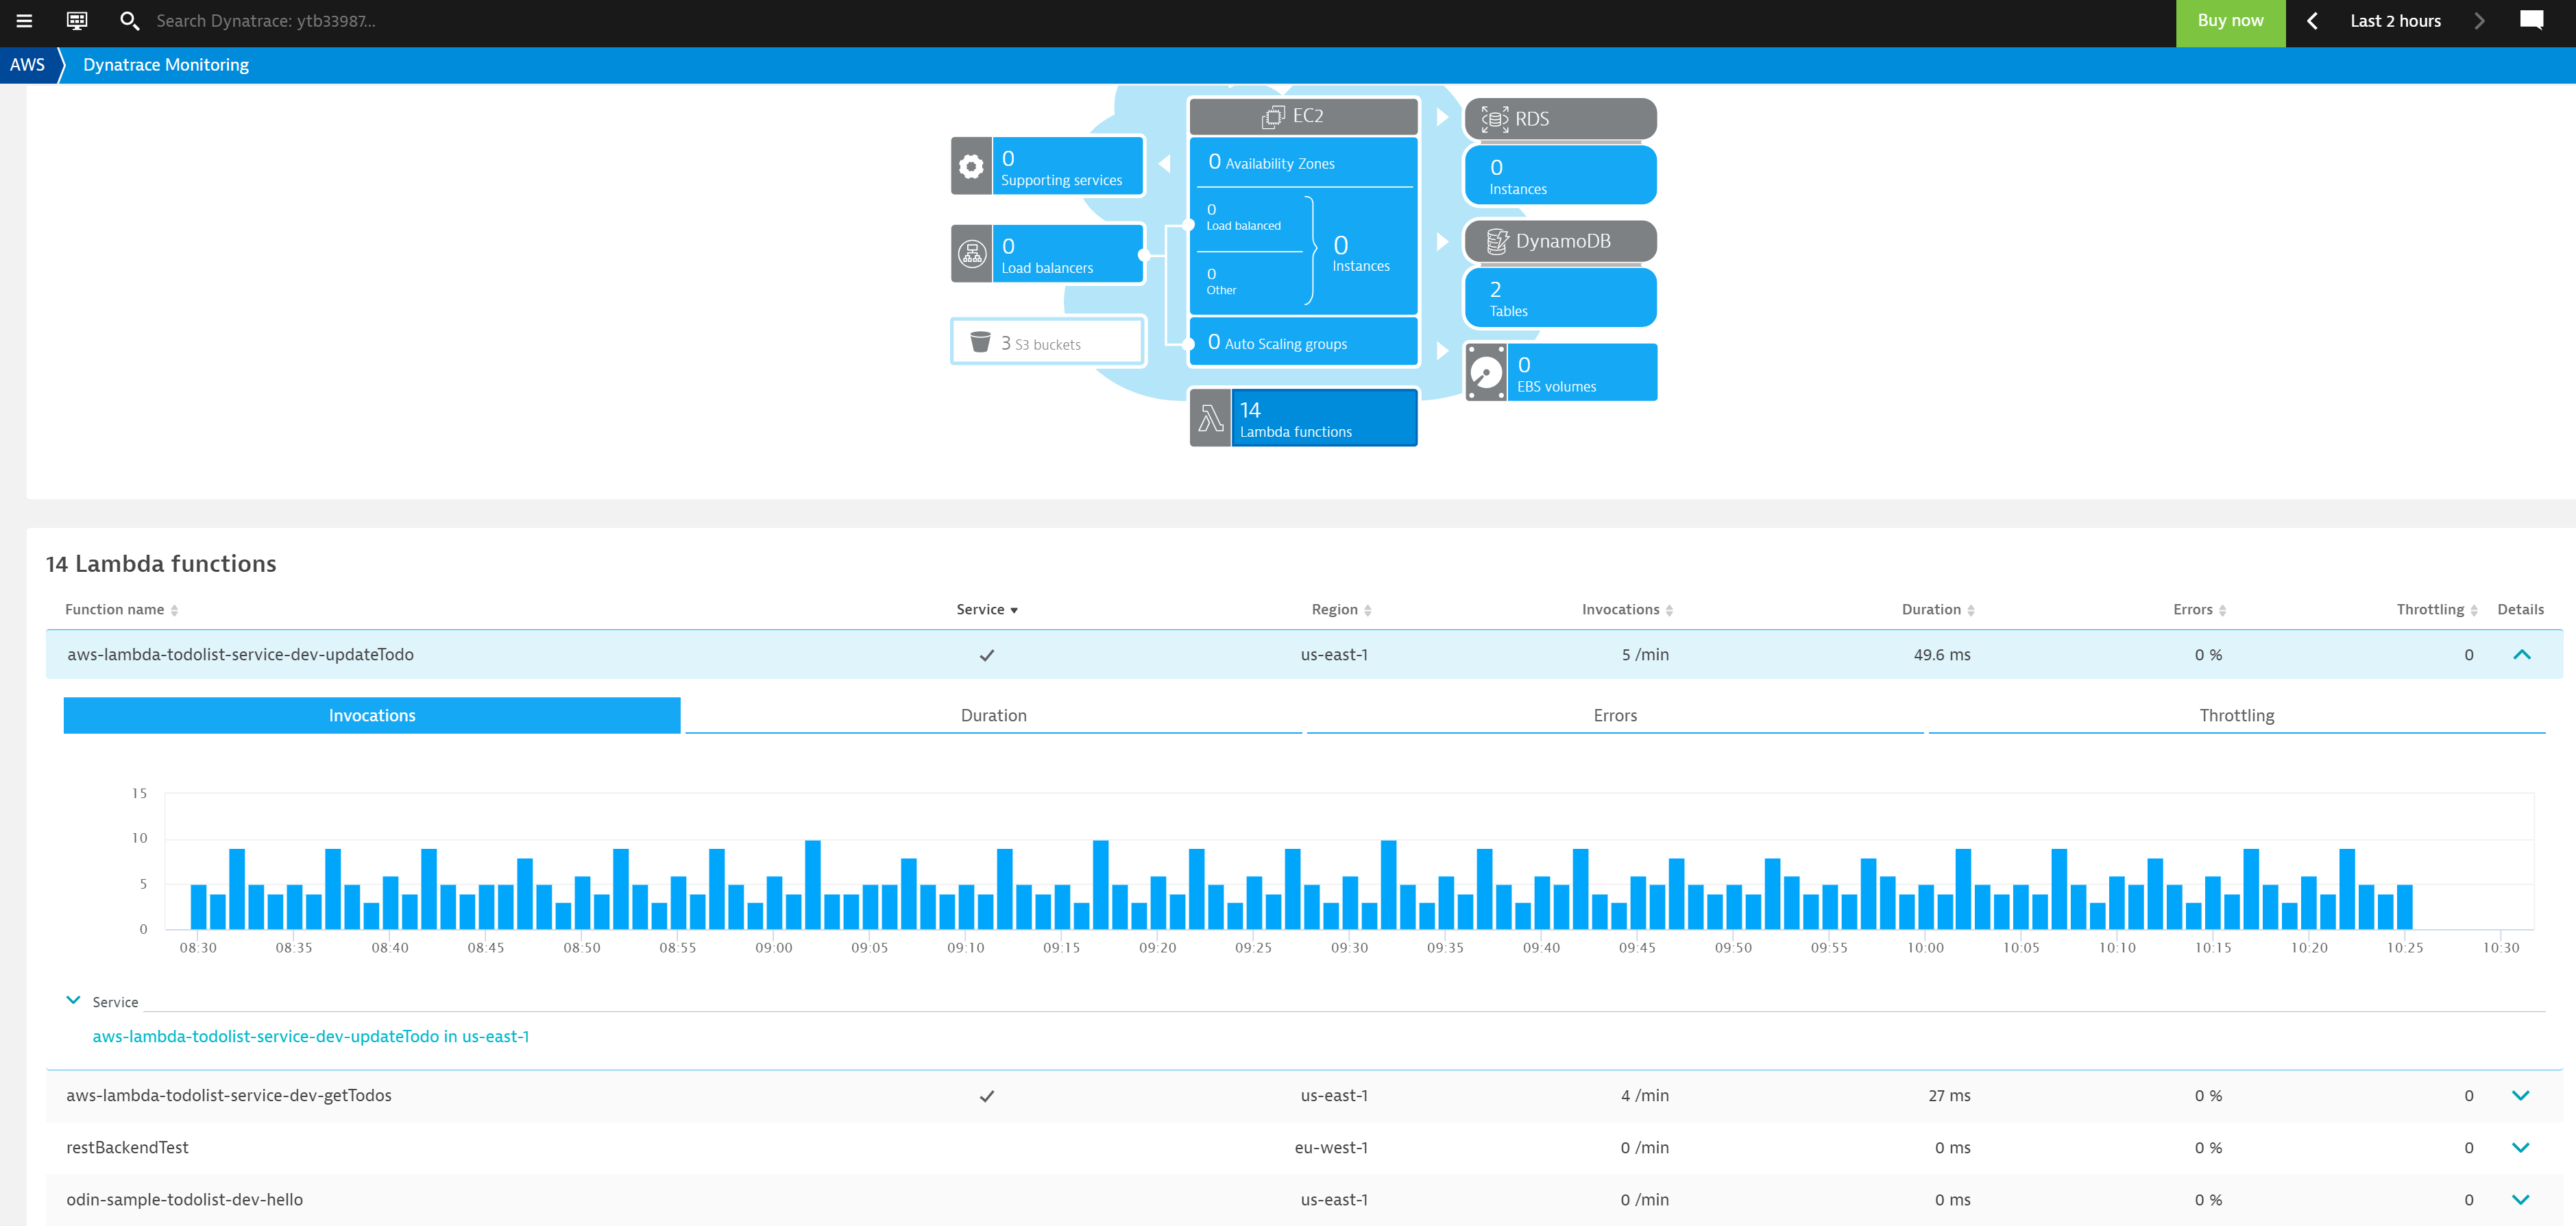
Many of our customers already monitor their Lambda functions with Dynatrace by ingesting AWS CloudWatch metrics. To identify to which of these functions service-level visibility is available due to an attached OneAgent extension, we’ve added a dedicated Service column to the list. Beneath the metrics you’ll find a link that leads you directly to the corresponding service in Dynatrace.
Set up the AWS Lambda extension for instant visibility in just a few steps
You’ll find all the information you need to get started on the AWS Lambda deployment page in your Dynatrace environment.
- Select Deploy Dynatrace from the Dynatrace navigation menu.
- Enter AWS Lambda into the search bar at the top of the page.
- Select the AWS Lambda tile and then select Activate AWS Lambda at the bottom of the page.
The Dynatrace AWS Lambda extension is based on an AWS Lambda layer that can be added to your Lambda functions.
You have options for configuring the extension. You can either set it up via environment variables in a config file, or you can include pre-defined code snippets in your serverless framework, Terraform, CloudFormation, or AWS SAM setup.
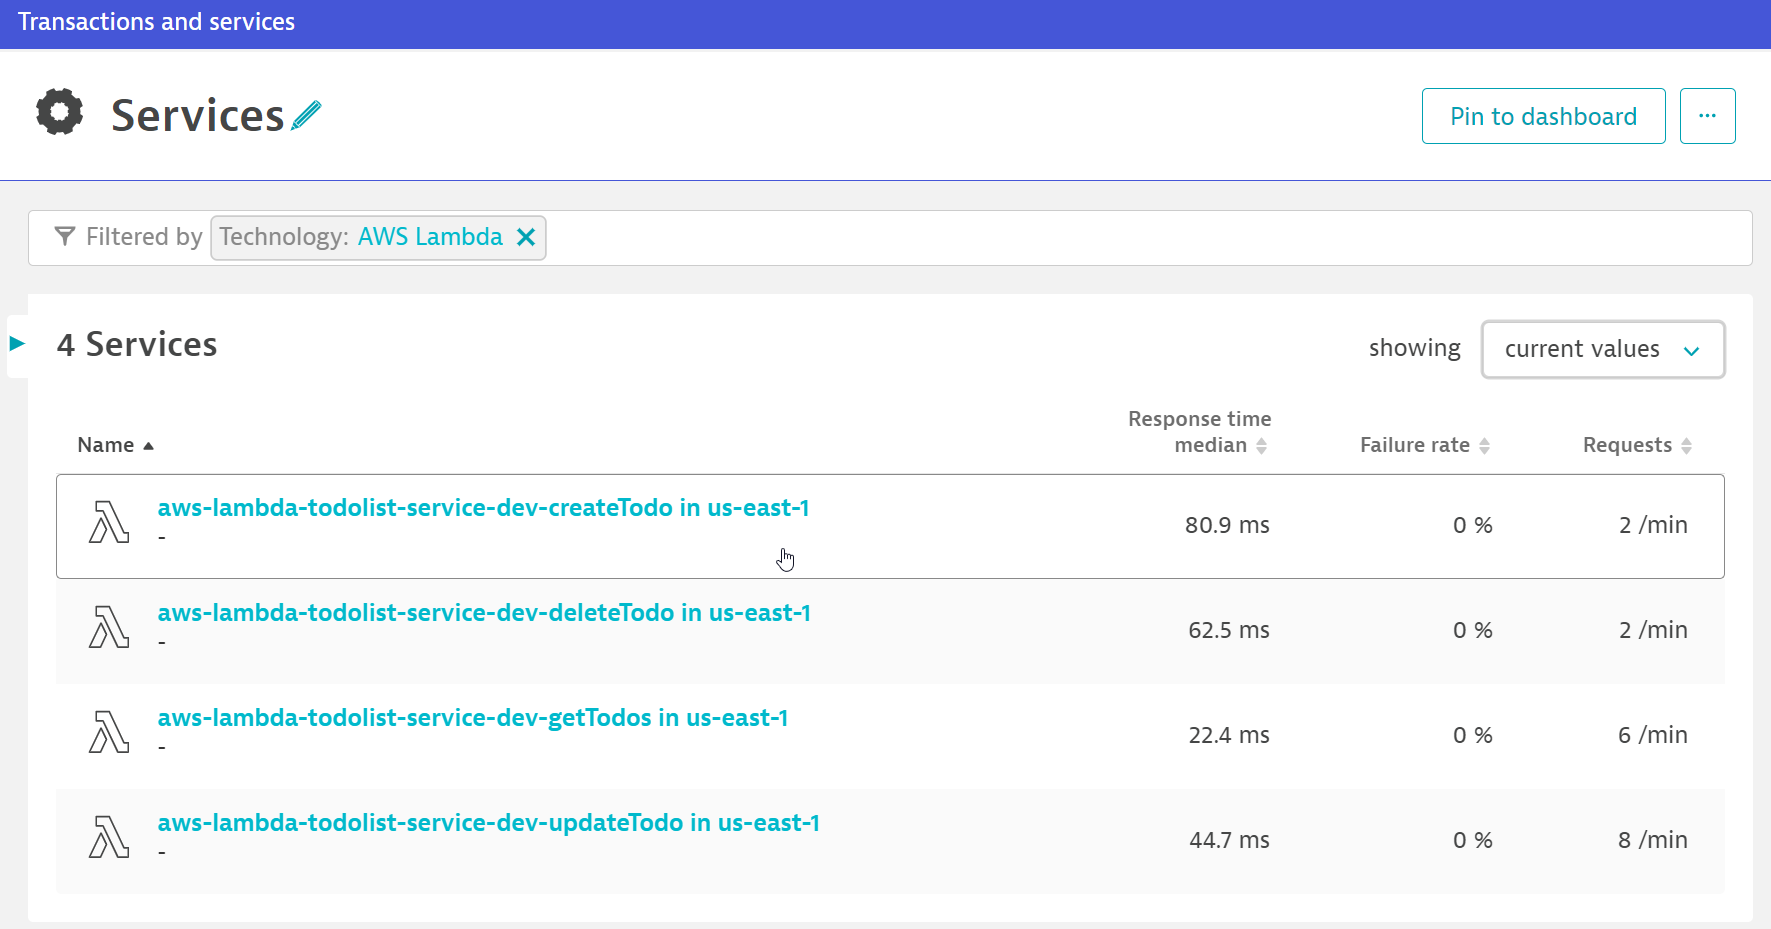
After the Dynatrace AWS Lambda extension is set up and one of your Lambda functions is invoked, the function will appear as a monitored service in Dynatrace. To focus your results, use the AWS Lambda technology filter.
Find more information about how to set this up in our documentation.
The OneAgent AWS Lambda integration will be licensed based on the consumption of Davis data units.
New to Dynatrace?
Try it out by starting your free trial today.
What’s next
Developing the Dynatrace AWS Lambda extension with all its new capabilities, which are available to all customers, is just a first step—we have lots of great new functionality in the pipeline, such as:
- Ingestion of AWS Lambda logs
- Support for additional languages
- And support for container images that are deployed on AWS Lambda
So please stay tuned for more announcements!




Looking for answers?
Start a new discussion or ask for help in our Q&A forum.
Go to forum