
AWS Fargate is one of the newer offerings from Amazon Web Services, allowing you to run containers without managing servers or clusters. AWS Fargate is offered as a launch type for ECS and EKS (planned for 2018). When choosing the previously available EC2 launch type for ECS or EKS, the user is responsible for provisioning enough infrastructure resources (EC2 instances). Using the new Fargate launch type this is completely automated, and AWS is taking care of it.
When running EC2 launch type, enabling Dynatrace full-stack monitoring is the same as monitoring any other system. Simply install the Dynatrace OneAgent on those EC2 instances that get added to the ECS cluster. Once the OneAgent is installed, every container that is launched by ECS is automatically monitored. That includes monitoring the EC2 instance as well as every process and every container. Also remember that we automatically instrument all processes which gives us both code level (PurePath details) as well as log analytics.
Fargate requires a different approach, as we do not have any control over underlying EC2 machines that get launched. AWS is taking care of that. So how do we monitor Fargate? We are still working on the final details, but we encourage anyone to give us feedback, based on the approach that our colleague Dirk Wallerstorfer put into his blog, First Steps with AWS Fargate. In his blog, Dirk explains a simply approach on bundling the OneAgent into the Docker image – as part of the docker build process – very similar to how we do Kubernetes Monitoring.
Putting it to the test!
At one of my recent Unbreakable Pipeline Tour stops in Detroit, I had Frederic Paladin attending. At the end of the workshop, he wanted to know whether my unbreakable pipeline would also work in case the application is deployed using Fargate. I told him – “sure, why wouldn’t it?” and pointed him to Dirk’s blog post to see how it can be done. A couple of days and a couple of email exchanges later, he came back to me with a handful of screenshots from his environment back at his employer, now fully monitored with Dynatrace.
Frederic simply modified his Dockerfile to install the Dynatrace OneAgent. The OneAgent then automatically instruments the application or service running in that container – including all its dependencies to other services.
Automatic AI Analytics: All data captured by OneAgent is automatically analyzed by Dynatrace’s AI Engine which will automatically alert you in case there is a problem impacting your SLA’s or End Users.
REST Accessible: All this data is also accessible via the Dynatrace REST API – allowing you to feed more contextual and AI-analyzed data into your deployment automation tools, e.g: for smarter canary release rollouts or into your auto-remediation tools for smarter self-healing.
Alright – lets walk through the steps to launch some containers in ECS or EKS – either using Fargate or EC2 launch mode!
Step #1: Embed the OneAgent into your Docker Container
If you do not already have a Dynatrace Tenant, simply sign up for a free Dynatrace SaaS Tenant. I also recommend checking out my 101 AWS Monitoring GitHub Tutorial where I show you how to setup AWS CloudWatch monitoring or how to deploy a OneAgent on EC2 instances.
We are still working on an official Fargate Monitoring documentation page – giving you step-by-step instructions for Fargate. For now you can follow the instructions we give for Kubernetes Monitoring, as it requires the same exact steps. The only thing you need is your Dynatrace SaaS Tenant and a PaaS API Token. If you run a Dynatrace Managed (=On Premises) installation you simply have to provide the URL to your API Endpoint. How to obtain a PaaS token is also explained in the doc for Kubernetes Monitoring.
Running on Alpine? In case your containers run on Alpine make sure to use “flavor=musl” parameter when specifying the download string for your OneAgent. More details about this can also be found in the doc on Kubernetes Monitoring.
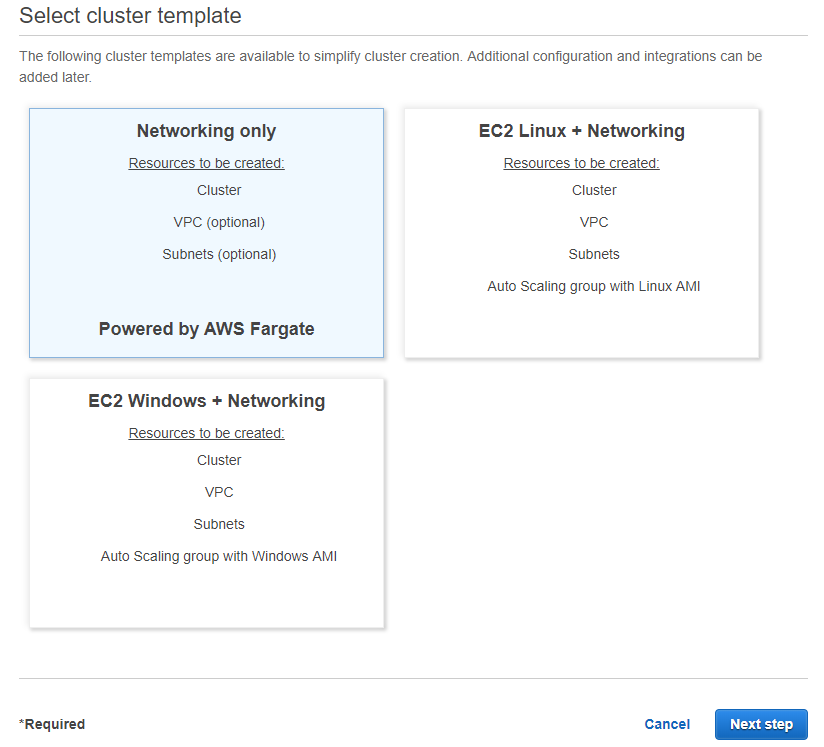
Step #2: Create the ECS Cluster with Fargate Launch Mode
When creating an ECS cluster you can choose the desired launch mode. The following screenshots show how to create an ECS cluster with Fargate:
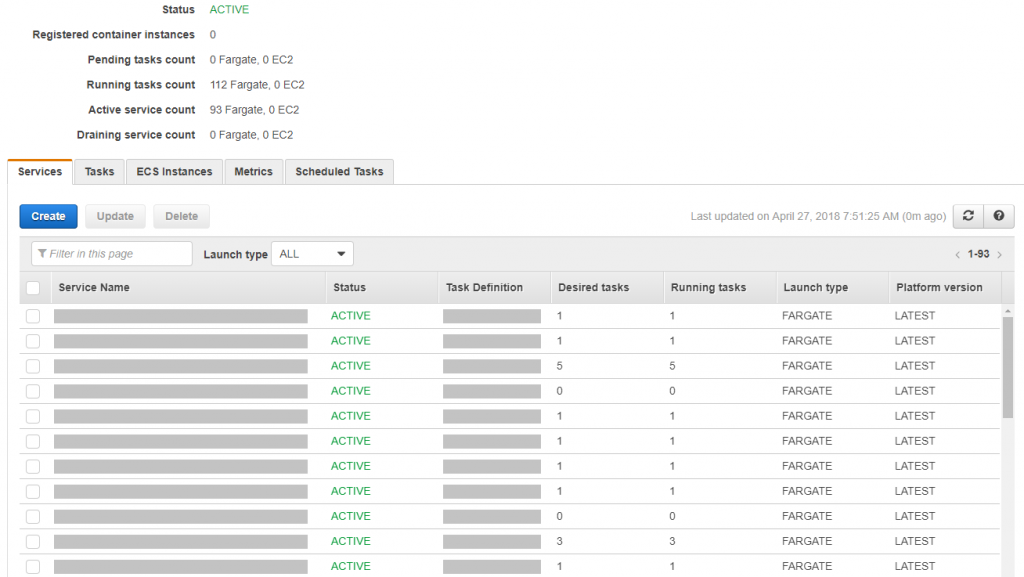
Once the cluster is up, it is time to define services and tasks. For more details I recommend checking the public available AWS Tutorials. The following screenshot shows Frederic’s ECS cluster with all services and tasks.
Step #3: Launch your app and analyze data
That’s really all there is to do. Every time a docker container gets launched by Fargate, the Dynatrace OneAgent starts monitoring the instance with automated full stack code instrumentation. In our scenario it is a Node.js application running in these containers. Here are a couple more screenshots that show the data Dynatrace captures:
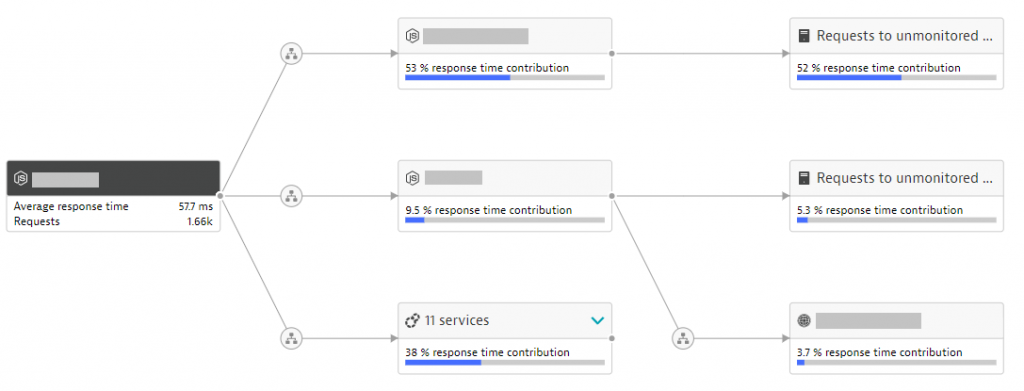
ServiceFlow: Automatic End-to-End PurePath capturing gives us full end-to-end tracing across and through containers, into external services or any other service that runs in containers or in regular processes. Dynatrace also detects and visualizes the proxies that AWS automatically places between the container instances for traffic routing! NO CODE CHANGE NECESSARY: This end-to-end tracing is enabled automatically through Dynatrace OneAgent. No code changes necessary as compared to other solutions such as X-Ray and it also works across a wide variety of runtime technologies (Java, .NET, Go, Node.js, PHP …) which are supported by the Dynatrace OneAgent!
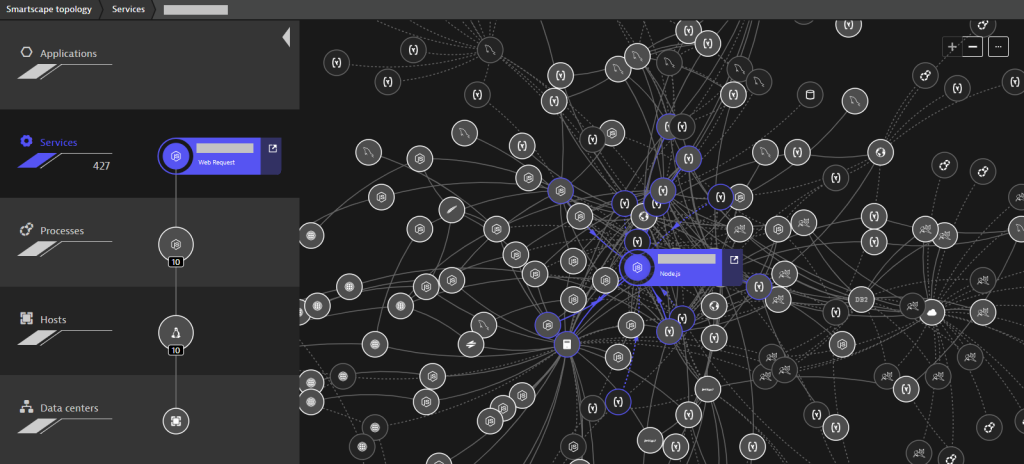
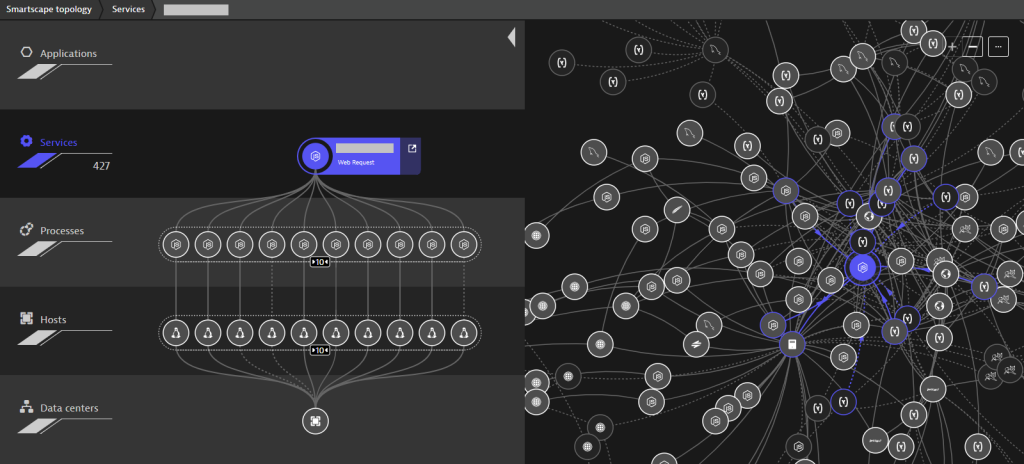
Smartscape: Focusing on a service, Smartscape automatically shows us how many container instances currently run for this service. The screenshot below shows us that there were 10! The view on the right side also shows all incoming and outgoing dependencies to this service. Great way to learn about how depending your service is on others!
AUTOMATE YOUR DEPEDENCY CHECKS: All this dependency data is not only visible in the Dynatrace Smartscape view – it is also accessible through the Dynatrace Smartscape REST API. This opens the opportunity to validate dependencies after you deployed changes into your testing, staging or production environment. As part of my unbreakable pipeline tour, I even talk about failing your CI/CD pipeline in case a deployment or configuration change increases the number of dependencies to other services!
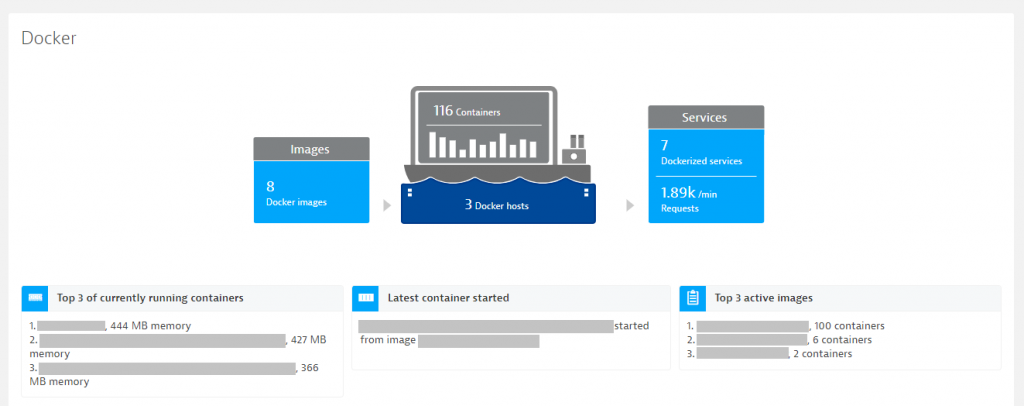
ALL Docker Containers: Frederic also runs ECS clusters with EC2 launch mode. On three of these EC2 hosts he installed a OneAgent. These OneAgents automatically instruments every single Docker container launched on that EC2 host without the need to embed the OneAgent into the container image as shown above. This is the preferred mode in case you have access to the docker host and can install a OneAgent.
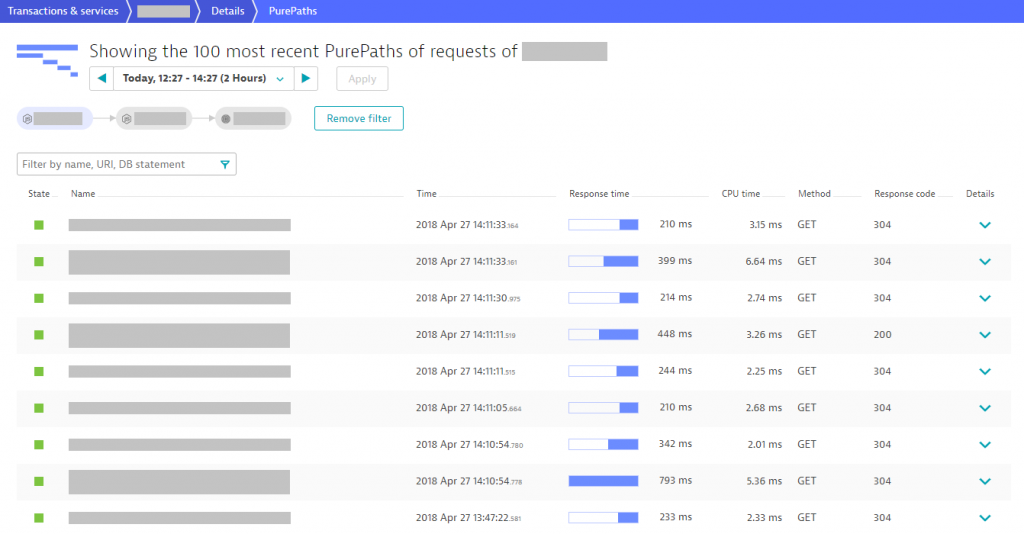
Every Request Captured: Once a process – whether it runs in a container or as a regular process on a host – is instrumented by OneAgent, every request to that process is analyzed by Dynatrace. While Dynatrace automatically performs multi-dimensional baselines on these requests to alert in case there is an anomaly, you can still dig into the PurePath details of individual requests:
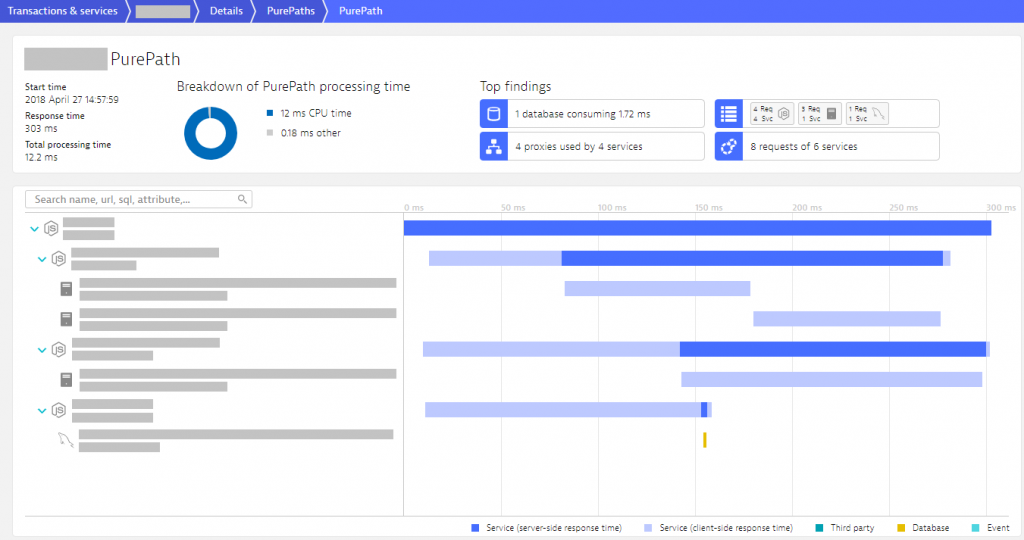
PurePath Details: PurePath is more than just end-to-end tracing. PurePath capture additional context information such as HTTP Headers, Parameters, SQL Statements, Exceptions as well as business and performance relevant method invocations, arguments and return values.
What’s Next on Fargate and other Cloud Technologies?
If you are looking into adopting the latest cloud technologies, make sure to check out our website, blog, GitHub repos and YouTube channels on how to use Dynatrace in those environments. Here are some quick links for you to get you started on the major technology stacks: AWS, OpenShift, Kubernetes, CloudFoundry, Azure, GCP and more …
As for Fargate, this blog shows that instrumenting monitoring your containers with a Dynatrace OneAgent is very straight forward. As it is such a new technology though we still want to collect more feedback from our early access users. If you want to contribute to the final supported version feel free to reach out to me. Comment on this blog post, find me on social media or send me an email.


Looking for answers?
Start a new discussion or ask for help in our Q&A forum.
Go to forum