
In my recent weeks of travelling I got to speak with many organizations that have done or are about to leverage what I call “Cloud Technology.” Why Cloud and not just Cloud? For me, Cloud best describes what is really happening in many transformation projects. It means leveraging new technology stacks, made popular through public cloud offerings and applying it within the constraints of an enterprise that wasn’t born in the cloud. This could mean leveraging certain public cloud services from one or more providers and combining it with on premises installations of Docker, Kubernetes, Cloud Foundry or OpenShift.
Application of Cloud Technology: Neiman Marcus
I recently had the opportunity to chat with an eCommerce Operations Manager at Neiman Marcus. Through our conversation, I got to learn more about their Cloud journey and why it was important for them to let go of old habits acquired in the pre-cloud era. We looked at one of their Cloud environments leveraging Amazon ECS running Spring Boot microservices in dockerized containers. This new stack enables Neiman Marcus to deliver a better online shopping experience for their end-users, while also increasing the speed of innovation demanded by business.
As they shifted over to Cloud technology, the Neiman Marucs team realized that their old habits, when it comes to monitoring enterprise applications, also needed a significant shift as the following questions showed them the limitations of traditional APM:
Q: How to monitor your cloud infrastructure?
A: Traditional APM was built for monolithic applications running on controlled physical or virtual hardware. Back then there was no concept of cloud services!
Q: How to monitor an automatic scaling environment?
Traditional APM works with a lot of static baselines and dashboards showing pre-defined static metrics. That doesn’t fit into a world with short-lived service instances!
Q: How to monitor microservices?
A: Traditional APM was centered around applications, not services. All alerting and dashboarding was based on that concept. How will this fit into a world where we have 100x services as compared to the apps we had in the past?
Q: How to monitor services hosted in Containers?
A: Traditional APM assumes long-running processes hosting monolithic applications that hardly ever change. Now we get new Docker images with every build multiple times a day. How can we successfully inject agents that understand the dynamic nature of these containers?
Neiman Marcus did a Proof of Concept with Dynatrace, and our OneAgent technology, and experienced first-hand that this purpose-built monitoring solution for cloud overcame the limitations of current APM solutions (including AppMon which they have used for many years).
Last week, Neiman Marcus invited me to join a remote session where he showed me how they adopted Dynatrace and why it was the better choice as compared to other APM tools and why they couldn’t do it with the basic AWS CloudWatch monitoring service.
Monitoring Cloud Infrastructure
Neiman Marcus has automated the rollout of Dynatrace OneAgents on all their EC2 instances as well as configured the Dynatrace CloudWatch Integration to pull in additional meta data and metrics from AWS itself – that’s a perfect combination of basic cloud monitoring with the full-stack monitoring capabilities of Dynatrace OneAgent. It allows Neiman Marcus to always get a live and historic overview of how many services and resources they are consuming on AWS, how it is trending and whether there are any issues in the moment. All at one glance:
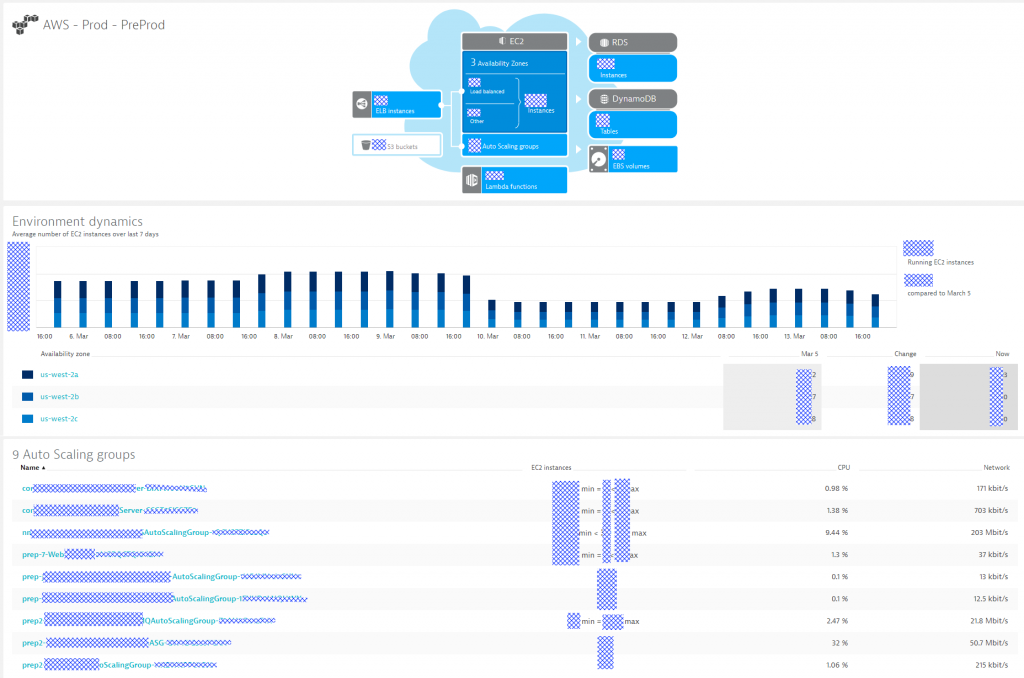
While it’s nice to know that all these metrics and dashboards are available, it is no longer plausible to create dashboards for these dynamic environments. Neither is it plausible to establish meaningful thresholds for basic monitoring metrics and manually configure alerts. The biggest challenge of all is to reduce the noise of false positives. Just because an EC2 instance shows high CPU doesn’t mean it’s a bad thing. It might just be “as designed” because the orchestration engine for your microservices automatically handles these situations and scales up additional hosts or services.
Dynatrace solves this problem by combining basic system monitoring alerting with dynamic baselining on end-user and service response times, throughput and failure rate. Thanks to the automatic dependency information available through Dynatrace Smartscape, the Dynatrace AI will only alert in case your SLAs are really impacted and then also directly points to the problematic underlying infrastructure issue. Just as the following screenshot shows that Neiman Marcus shared with me. Dynatrace alerts on an increase in Failure Rate of the recommendation service and points the root cause to a full disk on one of the ECS cluster nodes. It seems that excessive logging is to be blamed!
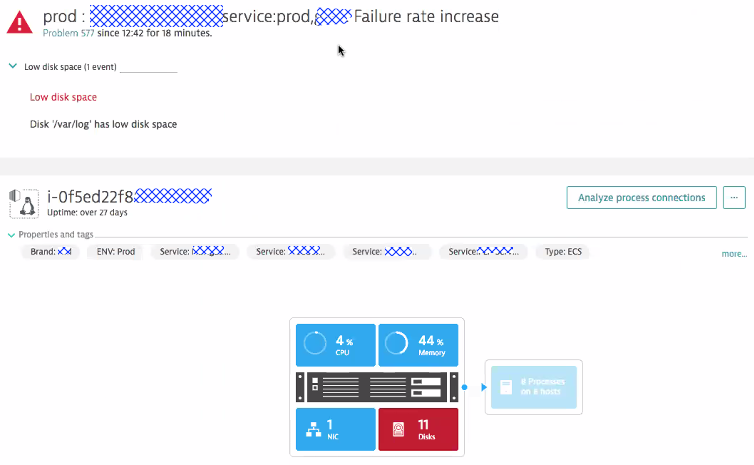
If Neiman Marcus would have gone with traditional APM in combination with CloudWatch his team would have received alerts from both APM as well as CloudWatch. Because of the dynamic nature of the cloud, it would have required manual correlation of these events or building or purchasing a correlation engine that tries to map these disjointed events into a single incident. Dynatrace does this automatically: a single problem ticket with all the automatic correlated events based on actual dependency information with no code changes or configuration. That saves time and reduces the number of tools to maintain!
Tip on Auto-Remediation
In my previous blogs, I started giving tips on how to execute auto-remediating or self-healing actions based on Dynatrace AI detected problems. In this case, Dynatrace could trigger a Lambda function, Ansible Tower, ServiceNow or any other remediation script to trigger log rotation on that EC2 instance. The Dynatrace problem ticket has all the relevant information to do so: EC2 Instance Id, Log Directory as well as all the processes that write to these log files!Tip on Log Analytics
Have a look at Dynatrace Log Analytics. On top of the out-of-the-box Log Analytics and Log Event Detection, Dynatrace recently announced a premium version of our log analytics capabilities. This feature not only allows you to analyze your log files but also allows you to offload the logs and take the pressure of your physical disks that hold the log files in the moment!
Monitoring an Automatic Scalable Environment
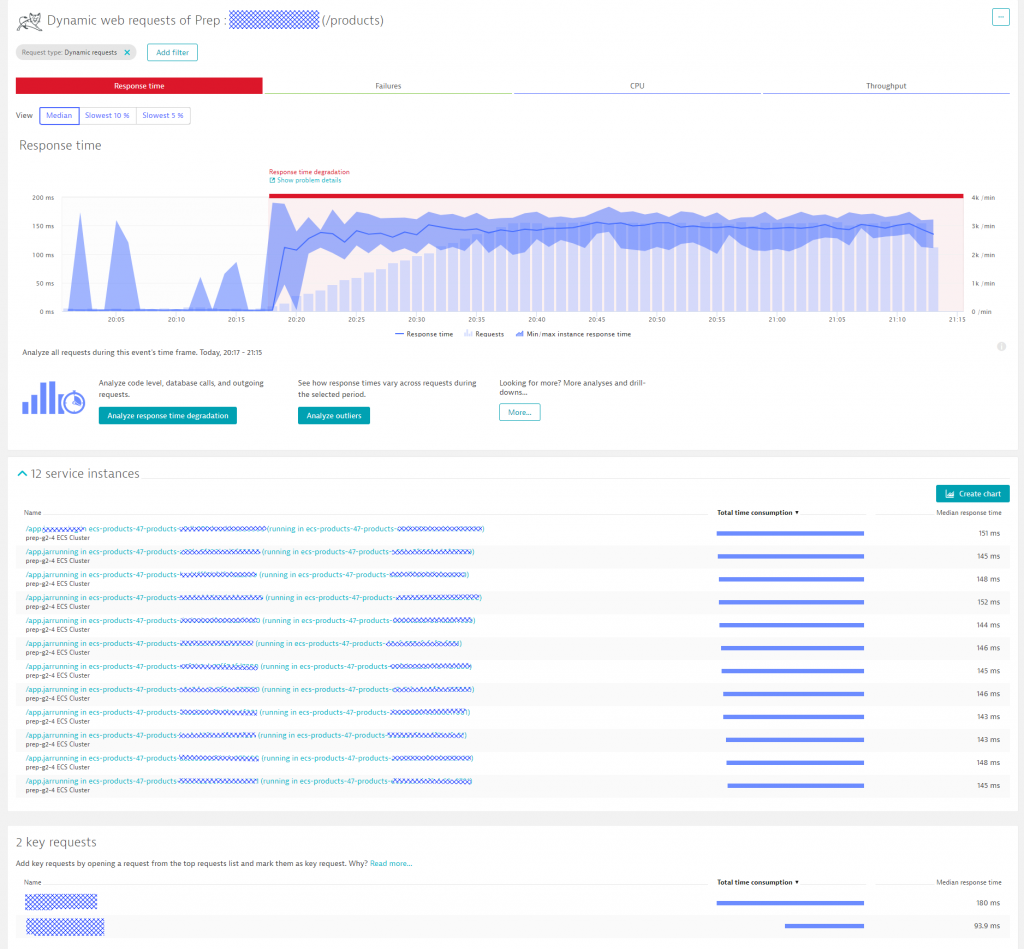
The first screenshot already showed that Dynatrace pulls out key metrics for every AWS Auto Scaling Group. While AWS Auto Scaling groups help scale EC2 instances, ECS scales the number of docker instances for a docker container. Dynatrace OneAgent – once installed on the ECS hosts – will automatically monitor every single docker container instance. Dynatrace also automatically detects the actual services running in the container and starts baselining each service and each service endpoint based on response time, failure rate and throughput. The following screenshot shows how Dynatrace analyzes key performance metrics for the product-service microservice.
At 20:17 Neiman Marcus kicked off a load test. Response Time immediately jumped up to about 150ms, but stayed their despite constantly increasing load over a period of 20 minutes. What is helpful for Neiman Marcus, and the architects behind these microservices, is to get an automated overview of all 12 service instances that have been spawned up on ECS. Response Time seems to be constant across all these instances which means that there is no problem with individual instances. Watching this view over time – while still increase load or simulating load spikes is another great way to validate how your architecture scales up and down!
Tip on Blue / Green Deployments
A deployment pattern often seen with microservice architectures are Blue / Green deployments. Dynatrace can automatically detect which service instances are running Blue vs Green by simply extracting meta data information from the Docker container, passing one of the Dynatrace Env-variables (DT_TAGS, DT_CUSTOM_PROP, DT_CLUSTER_ID) to the OneAgent or calling the Dynatrace Tagging REST API as part of your automated deployments. If you leverage that option you can immediately determine which types of service instances (Blue or Green) are having problems.
Tip on Auto-Remediation
A common pattern in microservice deployments is to kill unhealthy service instances and replace them with a new one. From the outside view a service health can only be evaluated by looking at things like CPU or Memory Consumption. With Dynatrace instrumenting your services you can automatically kill those instances that show bad behavior from a code level perspective, e.g: throwing certain exceptions, high failure rate, high CPU consumption or bad call patterns to other depending services. You can either leverage the Problem Notification Integration to pro-actively trigger a remediation script or you can pull this type of information into your existing orchestration engine that currently detects unhealthy instances based on system monitoring metrics.
Tip on Auto-Scaling
Most of the auto-scaling I have seen is based on CPU or Memory limits. With the granular service level data Dynatrace provides you can extend your auto-scaling algorithms and scale based on service endpoint patterns such as higher throughput or higher failure rate. As Dynatrace tells you which service endpoints are requested how often and how many resources they consume you can even implement smart endpoint scaling by not only adding more service instances but also redirecting traffic to instances that can handle certain service endpoint requests better, e.g: are optimized for memory or CPU!
Monitoring Microservices
We have seen several studies on how many more microservice instances we must manage as compared to the old legacy monoliths. The factors range from 10x to 1000x. But it is not only the number of individual logical services, e.g: Search Service, Billing Service, Product Service, Navigation Service, … it is also the fact that every microservice will run in 1, 10 or 1000 instances depending on load. The key challenge here is that it becomes very hard building meaningful dashboards that can deal with this scale of metrics. Dynatrace Smartscape is always a great way to show how Dynatrace handles services in general – whether they are medium, small or micro(scopic). The following is another screenshot Neiman Marcus shared with me – showing how the Spring Boot navigation-service runs distributed in 4 Tomcats across 3 ECS hosts which run across 2 AWS Availability Zones:
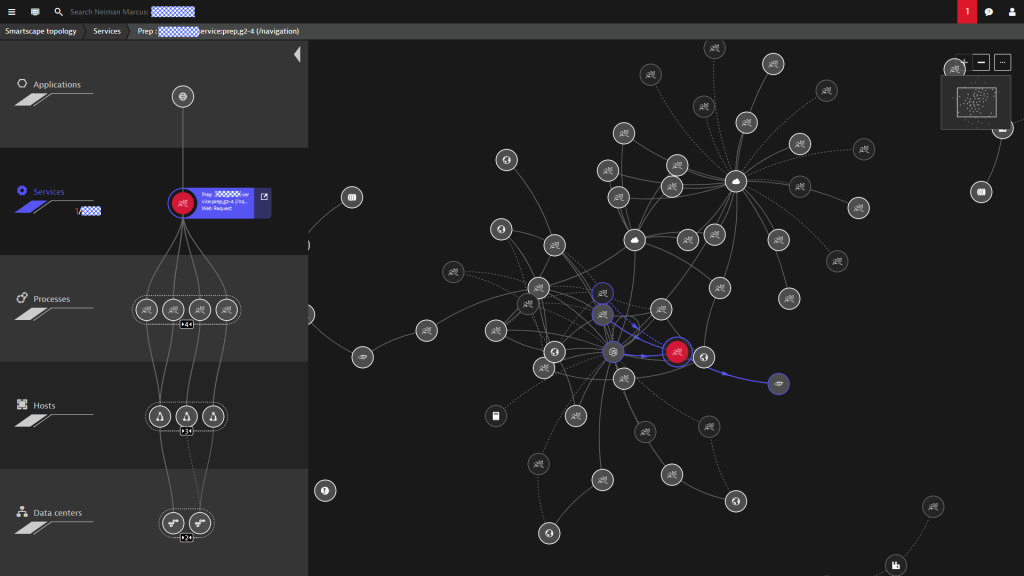
Granted, Smartscape is nice to look at and illustrates the magic behind Dynatrace Dependency Detection. It becomes less useful in extremely large environments unless you filter it down to understand your environment. The power of Smartscape when it comes to Microservices is its data input to the AI-based Problem Detection as well as the fact that Smartscape is also accessible through the Dynatrace REST API.
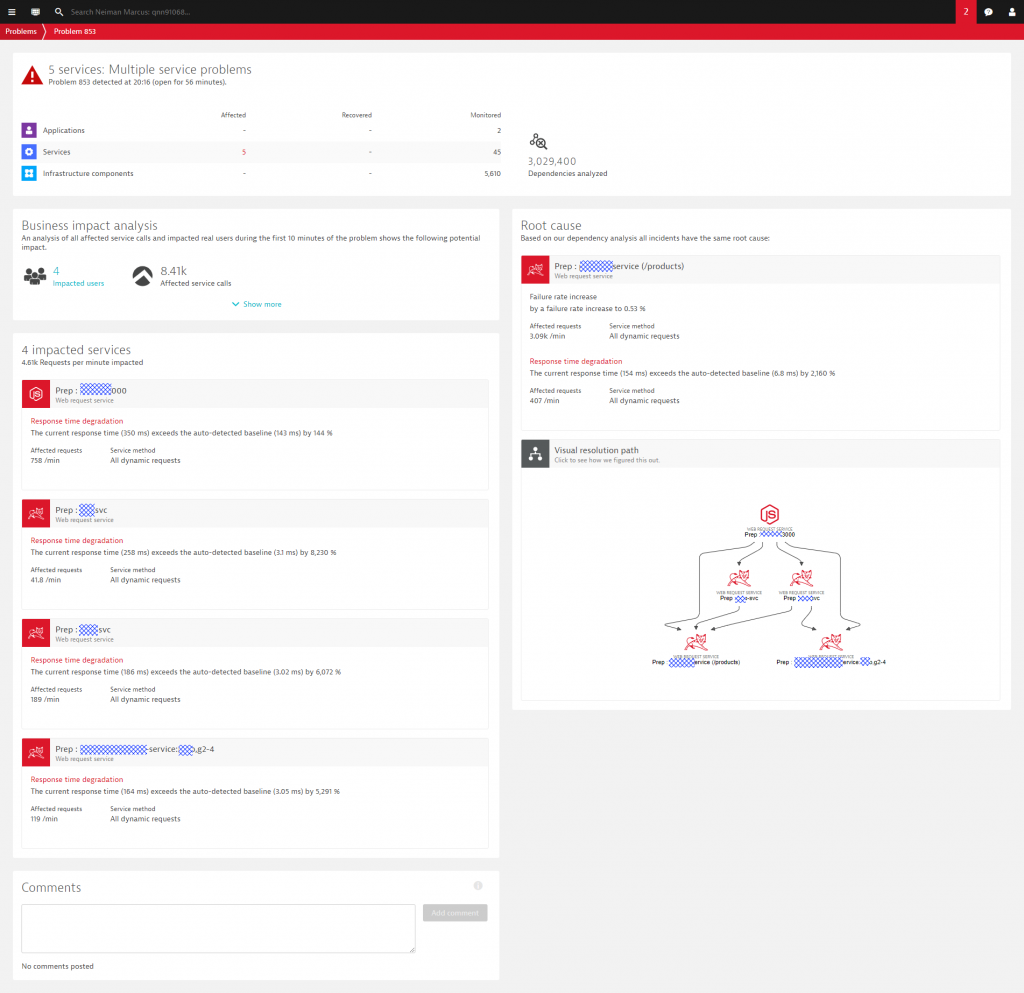
Tip on Problem Detection in for Microservice Architectures: Dynatrace does a pretty good job with automatic detection of your services, process groups and all the meta data that goes into a service, e.g: which container version, which bundle version, size of containers, … The additional tip I want to give you is to push additional meta data information on the Microservice such as “Blue vs Green” or any feature flag information. This will make the AI-detected problem ticket even more useful. Check out the following. Dynatrace detected an issue across 4 services which are all directly or indirectly depending on the product-service. Dynatrace immediately detected that the product-service is the actual root cause – impacting all other services which impacted 4 real users as well as 8410 service calls made in that impacted timeframe!
Tip on Automating Microservice Dependency checks: I am a big fan of automation and a big fan of automating quality gates from Dev to Ops. If you deal with Microservices and push them through your Delivery Pipeline I suggest leveraging the Dynatrace Smartscape API to pull out dependency information about each individual service you are changing. Why? Because you can track the number of dependencies for every build and every configuration change. This allows you to make your developers aware of a sudden change in dependencies that got introduced. Often these changes happen without engineers knowing about it, e.g: somebody included a new 3rd party library or made a configuration change in the API Gateway. Leveraging the Smartscape API will make sure you detect any accidentally introduced dependency faster! All this WITHOUT an additional CMDB!
Monitoring Docker
I just realized that we already covered Docker quite extensively in this blog. All the microservices that Neiman Marcus runs, run on ECS. The visibility comes in by having a Dynatrace OneAgent installed on the ECS hosts which simply are EC2 machines. To install the OneAgent you can either add the installation procedure of the OneAgent to the UserData script, add the OneAgent into the AMI you are using or leverage our Puppet, Chef and Ansible Scripts.
The OneAgent provides one additional benefit on Docker. We do have a Docker specific dashboard that gives us a nice overview of how many Docker hosts are currently monitored, how many different docker images are leveraged and how many container instances are running. Thanks to Neiman Marcus I got another screenshot from their Docker environment living on ECS:
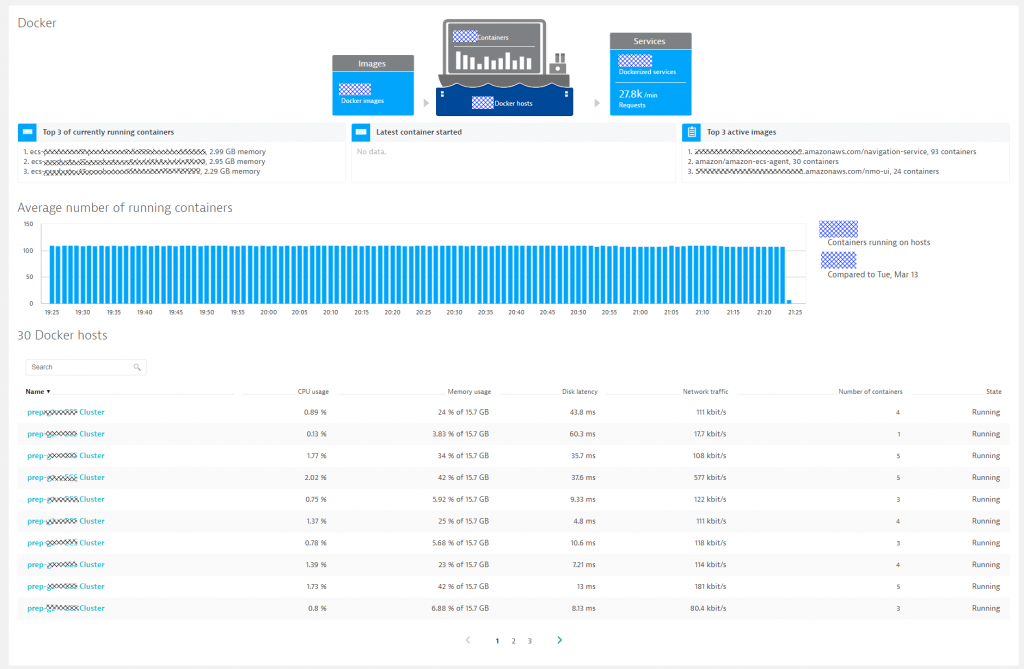
In case you can’t install a OneAgent on the ECS host itself then we provide other options such as running the OneAgent as a daemonset. Beyond Docker on ECS, Dynatrace also supports most container technologies and platforms, e.g: OpenShift/Kubernetes, Pivotal/Cloud Foundry, etc…
Tip for Docker Monitoring: In the last month I have seen very small to very large container environments. Whatever your size, make sure you pass additional context information to the container that Dynatrace can pick up, e.g: BLUE vs GREEN or any other service relevant version information. The more information you pass to Dynatrace the more powerful the Dynatrace AI and the easier it will be to implement auto-remediation actions.
Call to Action! Redefine your monitoring strategy and Redefine Yourself!
Thanks to Neiman Marcus for sharing the insights and the screenshots. The move to the Cloud is your chance to modernize and redefine your monitoring strategy just as Neiman Marcus did. We all understand it’s not easy – especially if you have lived in the comfort of your old APM tool.
Neiman Marcus, just like myself and thousands of others around the world, enjoyed the wonders of PurePath that was introduced with AppMon. Over the years we all got really good at impressing people with our “3 click to root cause” drill-down capabilities that PurePath made possible in distributed applications. It is very hard to open up for new ideas and approaches when being a master in PurePath diagnostics. It was for me – and it was for Neiman Marcus. We both made the transition and are now starting to understand the power of Automation, Full-Stack Monitoring and the AI. I want to end with a quote from my call with Neiman Marcus: “We don’t look at PurePaths that much anymore. We got lazy since we leverage the Dynatrace AI”
It’s easy to see the difference
So, what are you waiting for? Get ready to be amazed in 5 minutes or less.


Looking for answers?
Start a new discussion or ask for help in our Q&A forum.
Go to forum