In my role as DevOps and Autonomous Cloud Activist at Dynatrace, I get to talk to a lot of organizations and teams, and advise them on how to speed up delivery while also increasing the delivery in order to minimize the impact on operations. While optimizing delivery is very important, I haven’t focused enough on how Dynatrace helps IT Service Operation teams answer key questions they are faced with every day in their demanding job to keep Service Levels of their systems, services and applications within the defined agreements (SLAs).
In order to better understand what IT operations really need, and how Dynatrace can help modernize their tasks, I sat down with Stephan Dannewitz, DevOps Engineer at avodaq. While Stephan is as much into optimizing delivery as I am, he better understands the challenges and needs of IT-Service Operation teams from their own experience at avodaq.
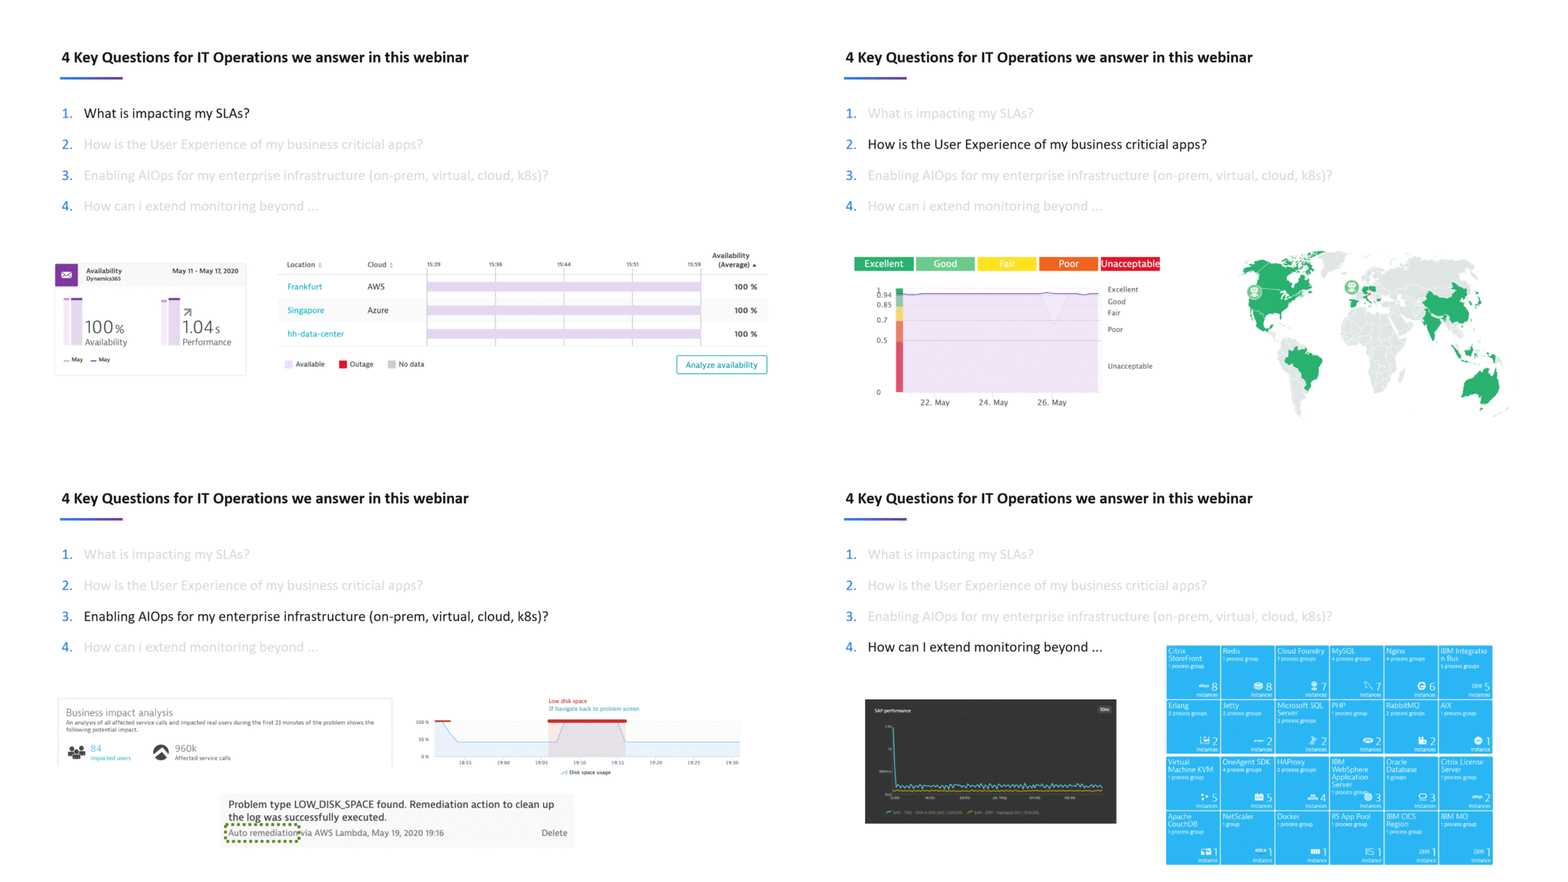
We came up with list of four key questions, then answered and demoed in our recent webinar.
If you’re interested in the German version of the webinar feel free to watch it in our native tone😊
For those that like to read rather than watch a webinar, here I’ll give you a quick rundown of the four steps we covered, so you can start your modernization in areas where you feel Dynatrace can help your existing processes:
Step #1: Monitor your SLAs using Dynatrace Synthetic
Dynatrace Synthetic allows you check the availability and performance for your business-critical applications. This can be your external-facing website, internal business applications. or even your 3rd party SaaS platforms such as Office 365 or Salesforce.
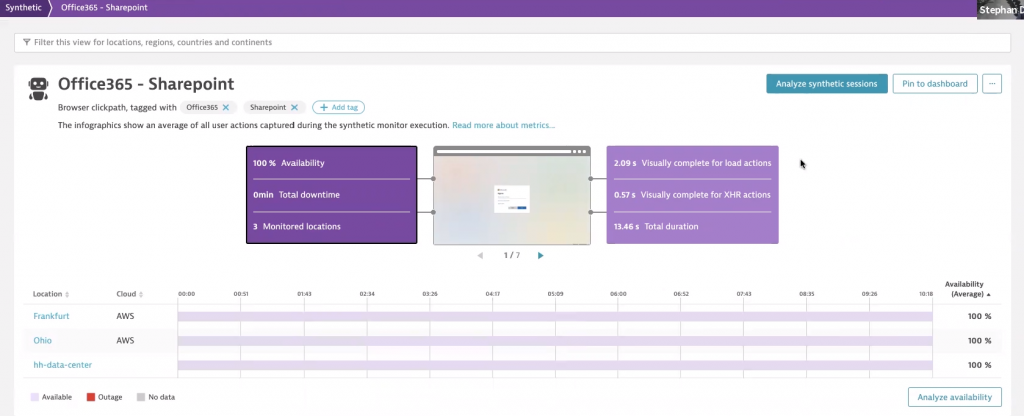
Stephan demoed how avodaq internally leverages Dynatrace Synthetic. SharePoint – part of Office 365 – is a critical business application for them. That’s why he setup Dynatrace Synthetic checks from the public available locations Frankfurt and Ohio as well as from their own Hamburg-based Data Center using Dynatrace Synthetic Private Locations. The Synthetic check constantly monitors if SharePoint is accessible, if login works, and if documents can be accessed with acceptable user experience:
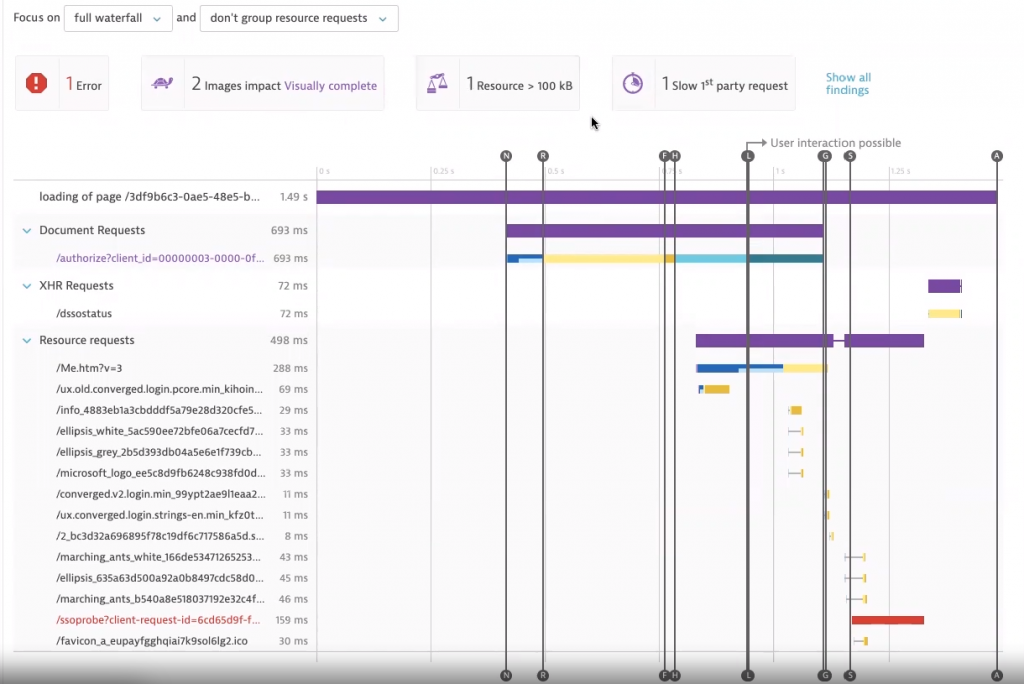
In case Dynatrace alerts on a problem – whether this is a complete outage, slowness, or broken functionality – it provides all the details for quick root cause analysis, which leads to faster problem resolution. In the demo, Stephan showed the waterfall view highlighting issues in connectivity, bad HTTP requests or even JavaScript errors. The view also gives automated recommendations on how to optimize page load times:
Automation tip: These synthetic checks can also be created automatically through the Dynatrace API which allows your delivery and release teams to include the setup of these checks into your release process. This makes sure that every service or application you deploy is always automatically monitored with a synthetic check.
Step #2: Ensure user experience on business-critical apps with Dynatrace RUM
Dynatrace Real User Monitoring (RUM) allows you to monitor your real end-users (web, mobile, kiosks, cars, smart gadgets etc). This not only works for your custom developed applications, but also works for 3rd party applications you host, e.g: SAP or even those that are hosted as a SaaS offering, such as Office 365 and Salesforce.
Stephan demoed RUM for both a custom developed application as well as for Office 365 where he logged on to SharePoint and navigated through some pages. The latter is done through Dynatrace’s SaaS Vendor RUM capability. For all scenarios Dynatrace not only captures page loads, clicks, swipes and form submissions. Thanks to Session Replay you can even see the full user journey in a 4k video like replay.
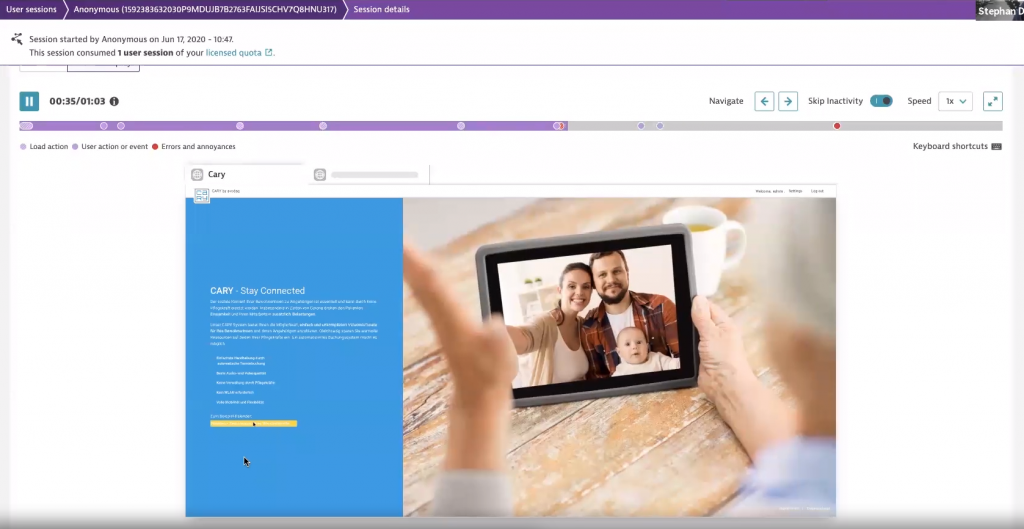
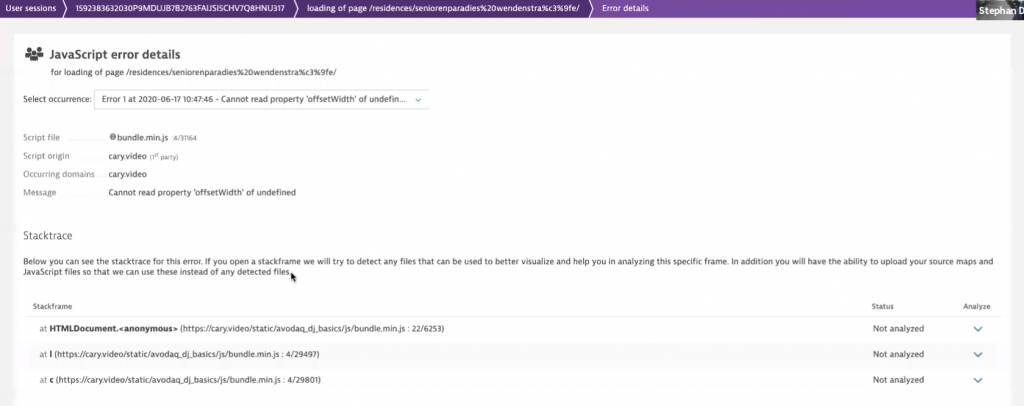
This is a great capability to have to understand where users are really struggling in their journey. In Stephan’s demo, he showed how problems that may or may not be directly visible to the end-user are captured by Dynatrace in the level of detail needed to fix issues. Such as the JavaScript error we detected when browsing through their Cary app below:
Deployment tip: There are multiple ways to enable Dynatrace RUM; installing the Dynatrace OneAgent on your hosting infrastructure, embedding the Dynatrace JavaScript agents in your HTML pages, or through the Dynatrace RUM browser extension. These options give you full flexibility.
Step 3: Automate operational tasks through Dynatrace AIOps
The advantage of Dynatrace’s Davis® AI, as compared to other AIOps solutions, is that thanks to the dependency data gathered by the OneAgent we can notify your teams about problems, their impact and the actual root cause. This information can be used to notify only those teams that should work on a problem and don’t immediately engage in a company wide war room. The other benefit of this level of detail and the automation capabilities is to automate remediation tasks that would otherwise need manual intervention.
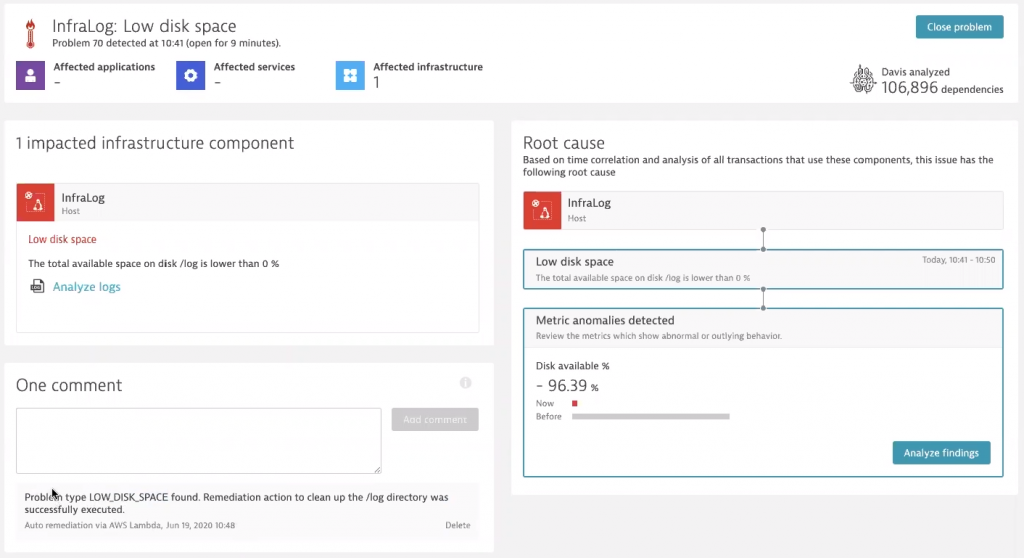
Stephan did a great job in his demo, where he simulated a log spam of an application leading to a full disk which subsequently would impact other applications running on the same infrastructure. Thanks to Dynatrace AIOps this problem was detected automatically and routed to a remediation action Stephan implemented using AWS Lambda.
Besides Lambda, Dynatrace provides integrations into ServiceNow, xMatters, PagerDuty, JIRA, Keptn and many other tools to trigger incident workflows. In this case the Lambda function analyzed the details of the Dynatrace problem and – in case the root cause was a log spam from an app – cleared that log directory to bring the host back to a healthy state:
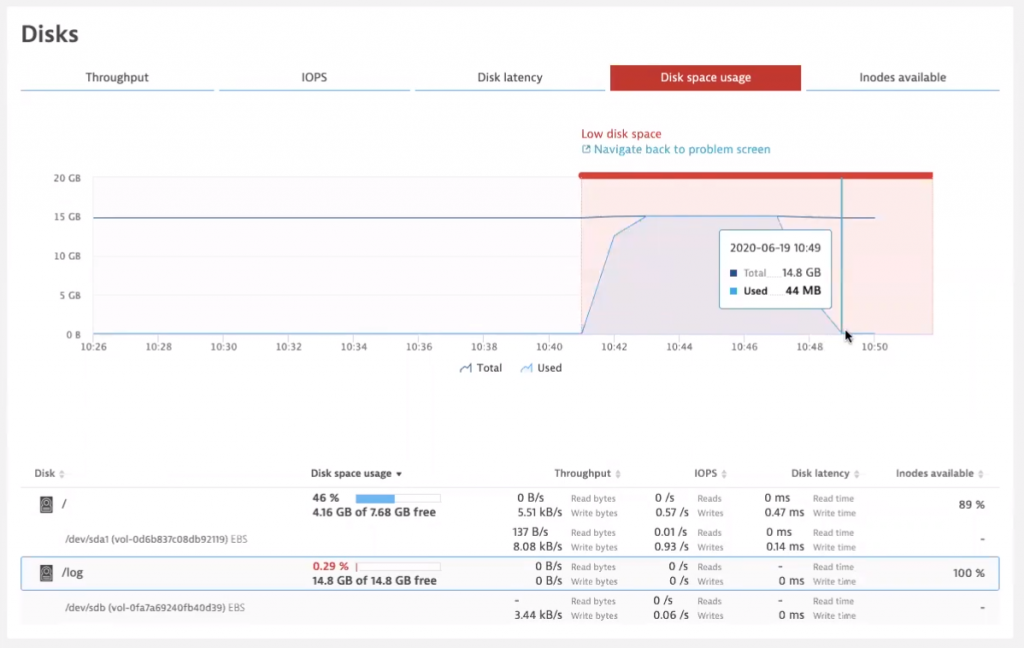
The detailed monitoring dashboards for example, disk utilization also show the positive impact the auto-remediation action had on fixing this issue:
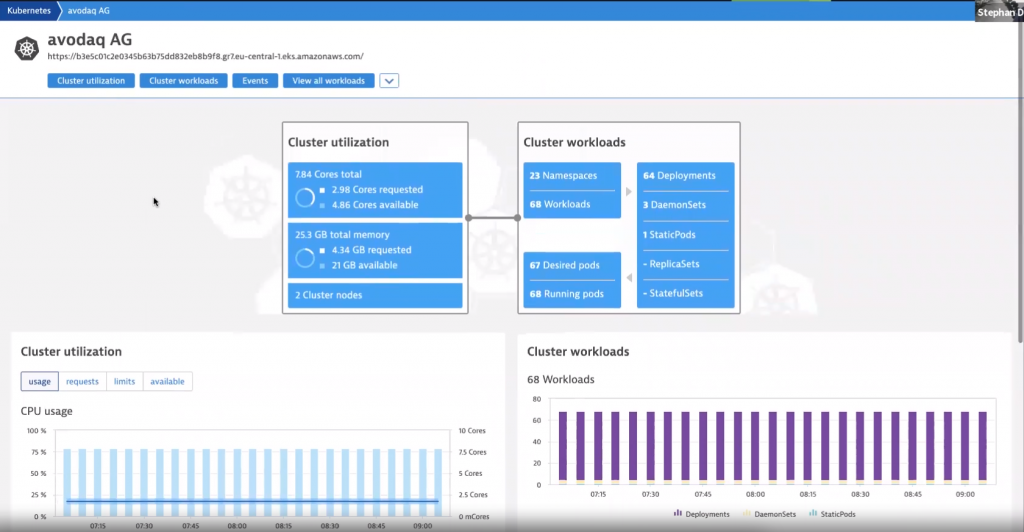
Infrastructure Monitoring tip: Dynatrace OneAgent not only monitors your on-premise physical hardware, but it can also monitor any environment on-premise or in the cloud as well as cloud native platforms such as k8s, OpenShift or serverless environments. During Stephan’s demo, he walked us through the diverse landscape of infrastructure their IT Operation team is responsible for – including k8s clusters as you can see in the below screenshot:
Step #4: Extend monitoring beyond Dynatrace OneAgent
While Dynatrace’s OneAgent has the broadest coverage of technology in the industry, there are always situations where OneAgent cannot be used, such as you won’t be able to install a OneAgent on your coffee machine – unless of course – it runs Linux or a lightweight k8s!
Stephan did a great job walking us through the monitoring extension options of Dynatrace through either Plugins (OneAgent and Active Gate) or through the Dynatrace REST API. He showed us how he used an extension to monitor UDP endpoints as well as SNMP:
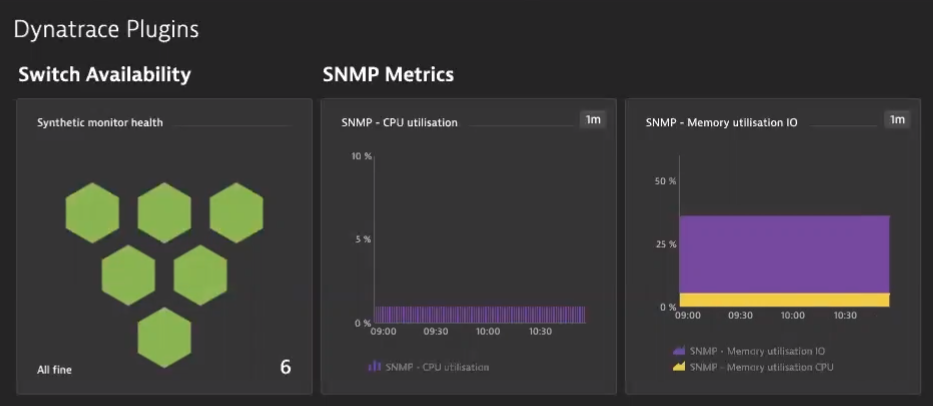
Extension tip: If you want to learn more about extending Dynatrace, or get an overview of available extensions, check out the Dynatrace Hub or my Performance Clinic on Extending Dynatrace with Custom Plugins.
Summary & next steps
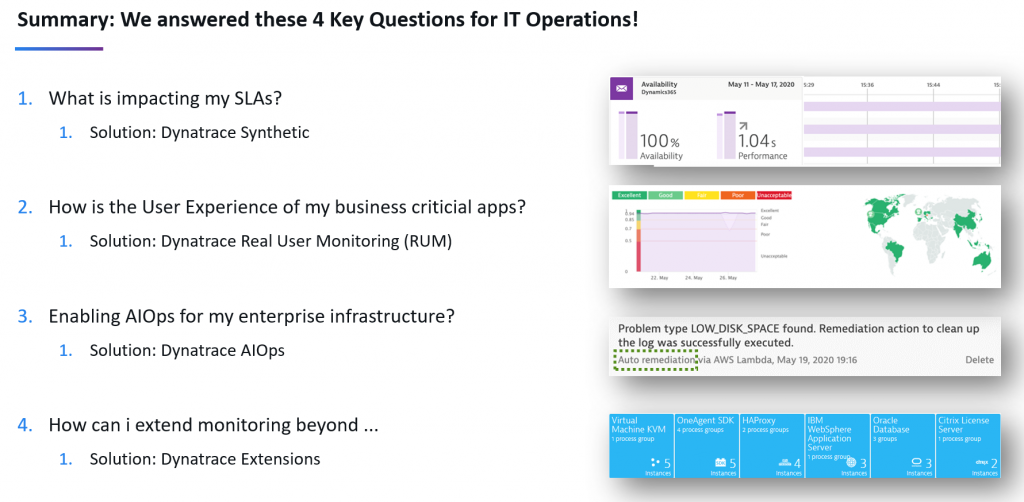
I first want to start with saying thank you to Stephan who gave me the opportunity to learn more about the relevant use cases and challenges in IT Operations. It was fantastic to see how avodaq has implemented Dynatrace in their environment to modernize their IT Service Operations using Dynatrace. At the end of the webinar I must conclude that all questions were answered and supported by live demos:
If you want to watch the webinar you can either get the on-demand version in English or German:
- Modernize your IT-Service Operations with the Dynatrace Software Intelligence platform (English)
- Modernisieren Sie Ihre IT-Service-Operations mit Dynatrace (Deutsch)
Avodaq is not only a Dynatrace customer. As mentioned in the beginning, avodaq is also a Dynatrace partner. If you have any needs of modernizing your IT Service Operations, modernize your delivery or migrate to the cloud feel free to reach out to them.



Looking for answers?
Start a new discussion or ask for help in our Q&A forum.
Go to forum