




















Skip to technology filters Skip to main content
Dynatrace Hub

Extend the platform,
empower your team.

Popular searches:
Home hero bg
Zscaler Internet Access (ZIA)Zscaler Internet Access (ZIA)
Zscaler Internet Access (ZIA)

Zscaler Internet Access (ZIA)

Turn ZIA logs into a fully observable security and network dataset in Dynatrace.

Extension
Free trialDocumentation
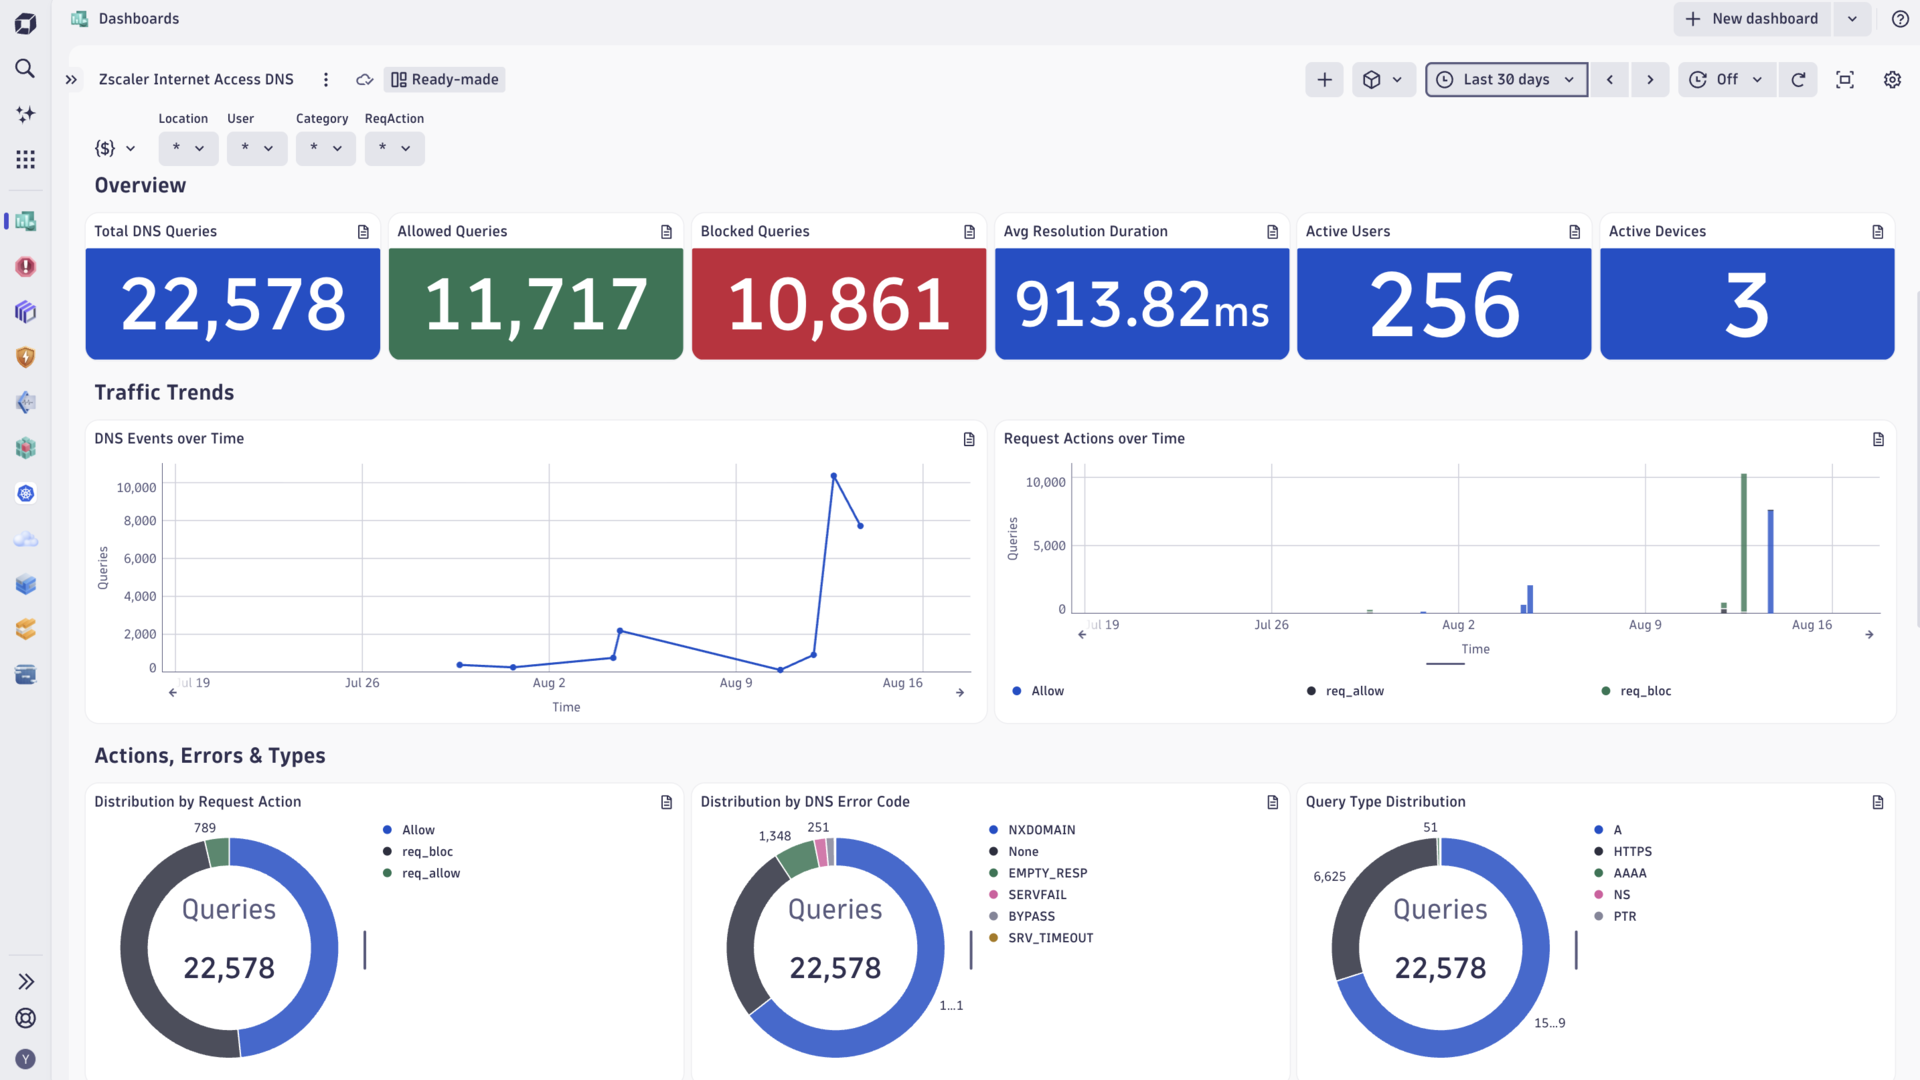
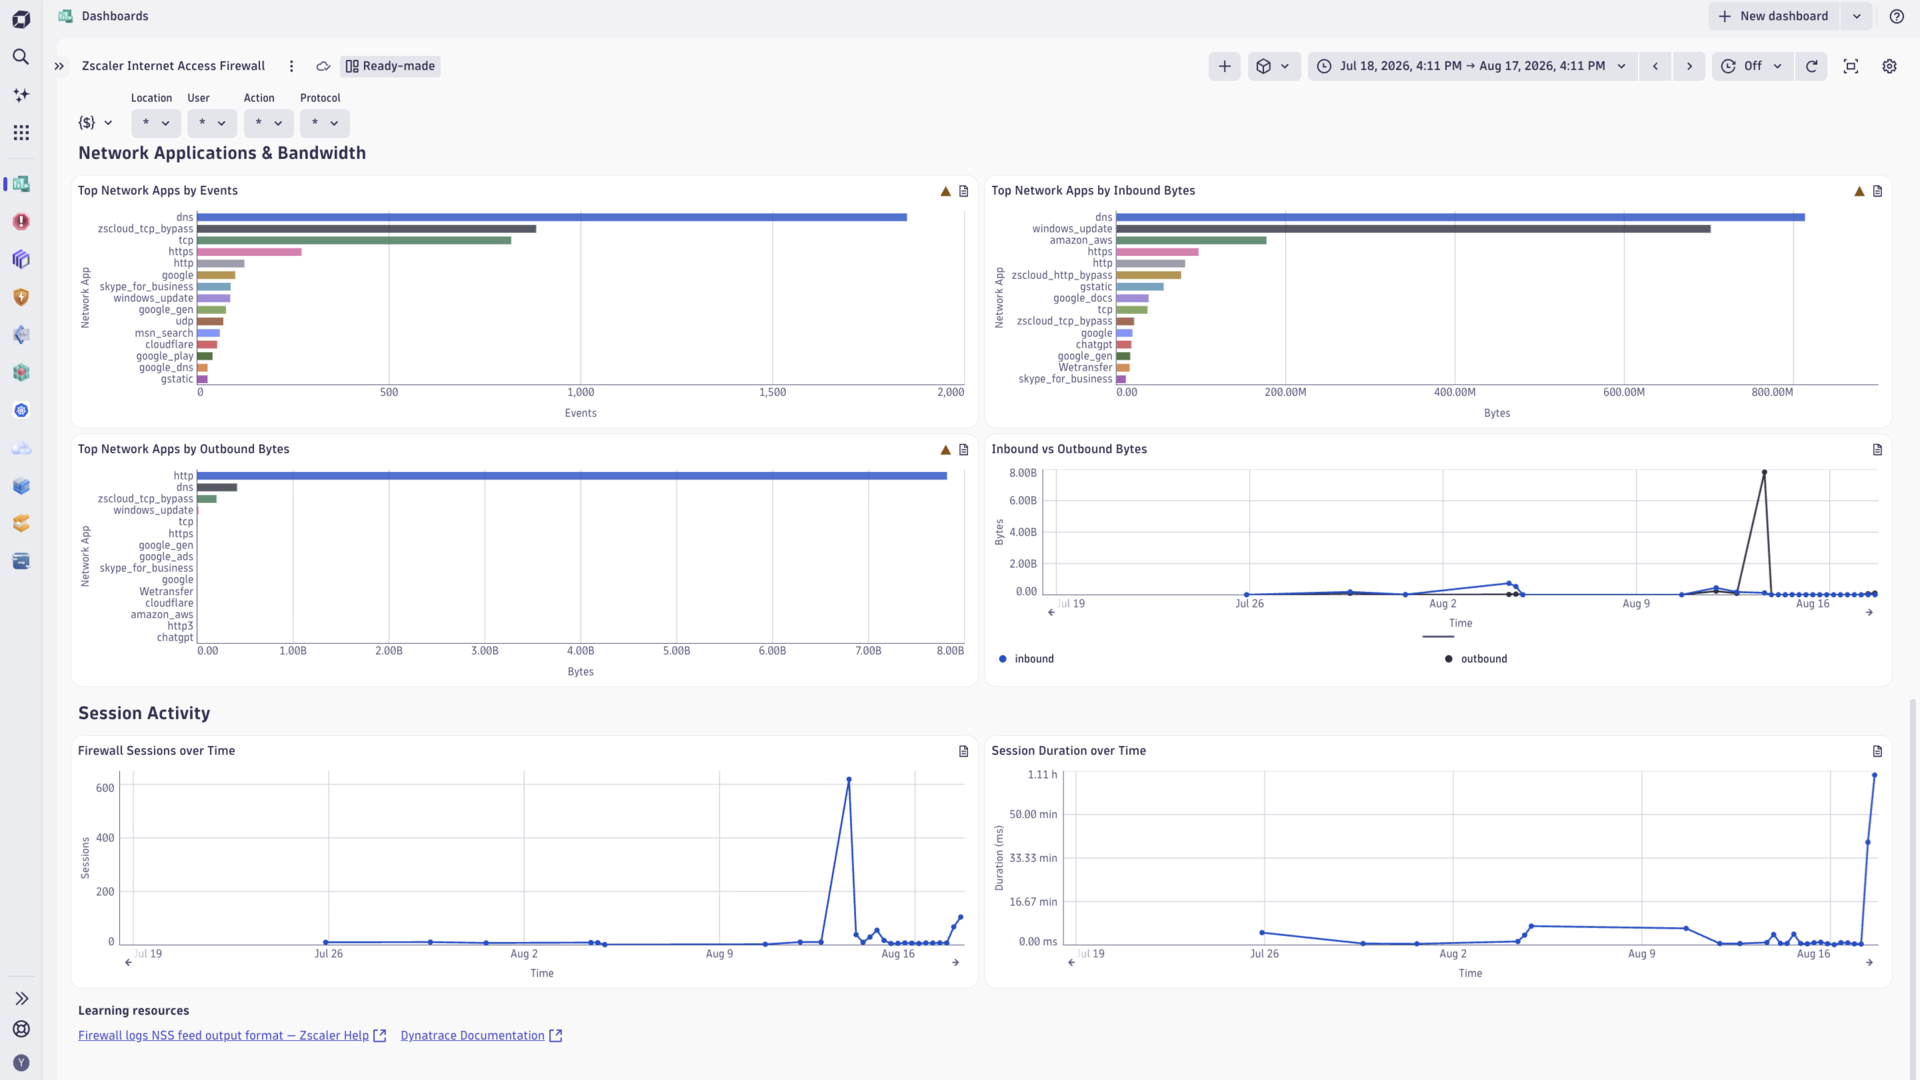
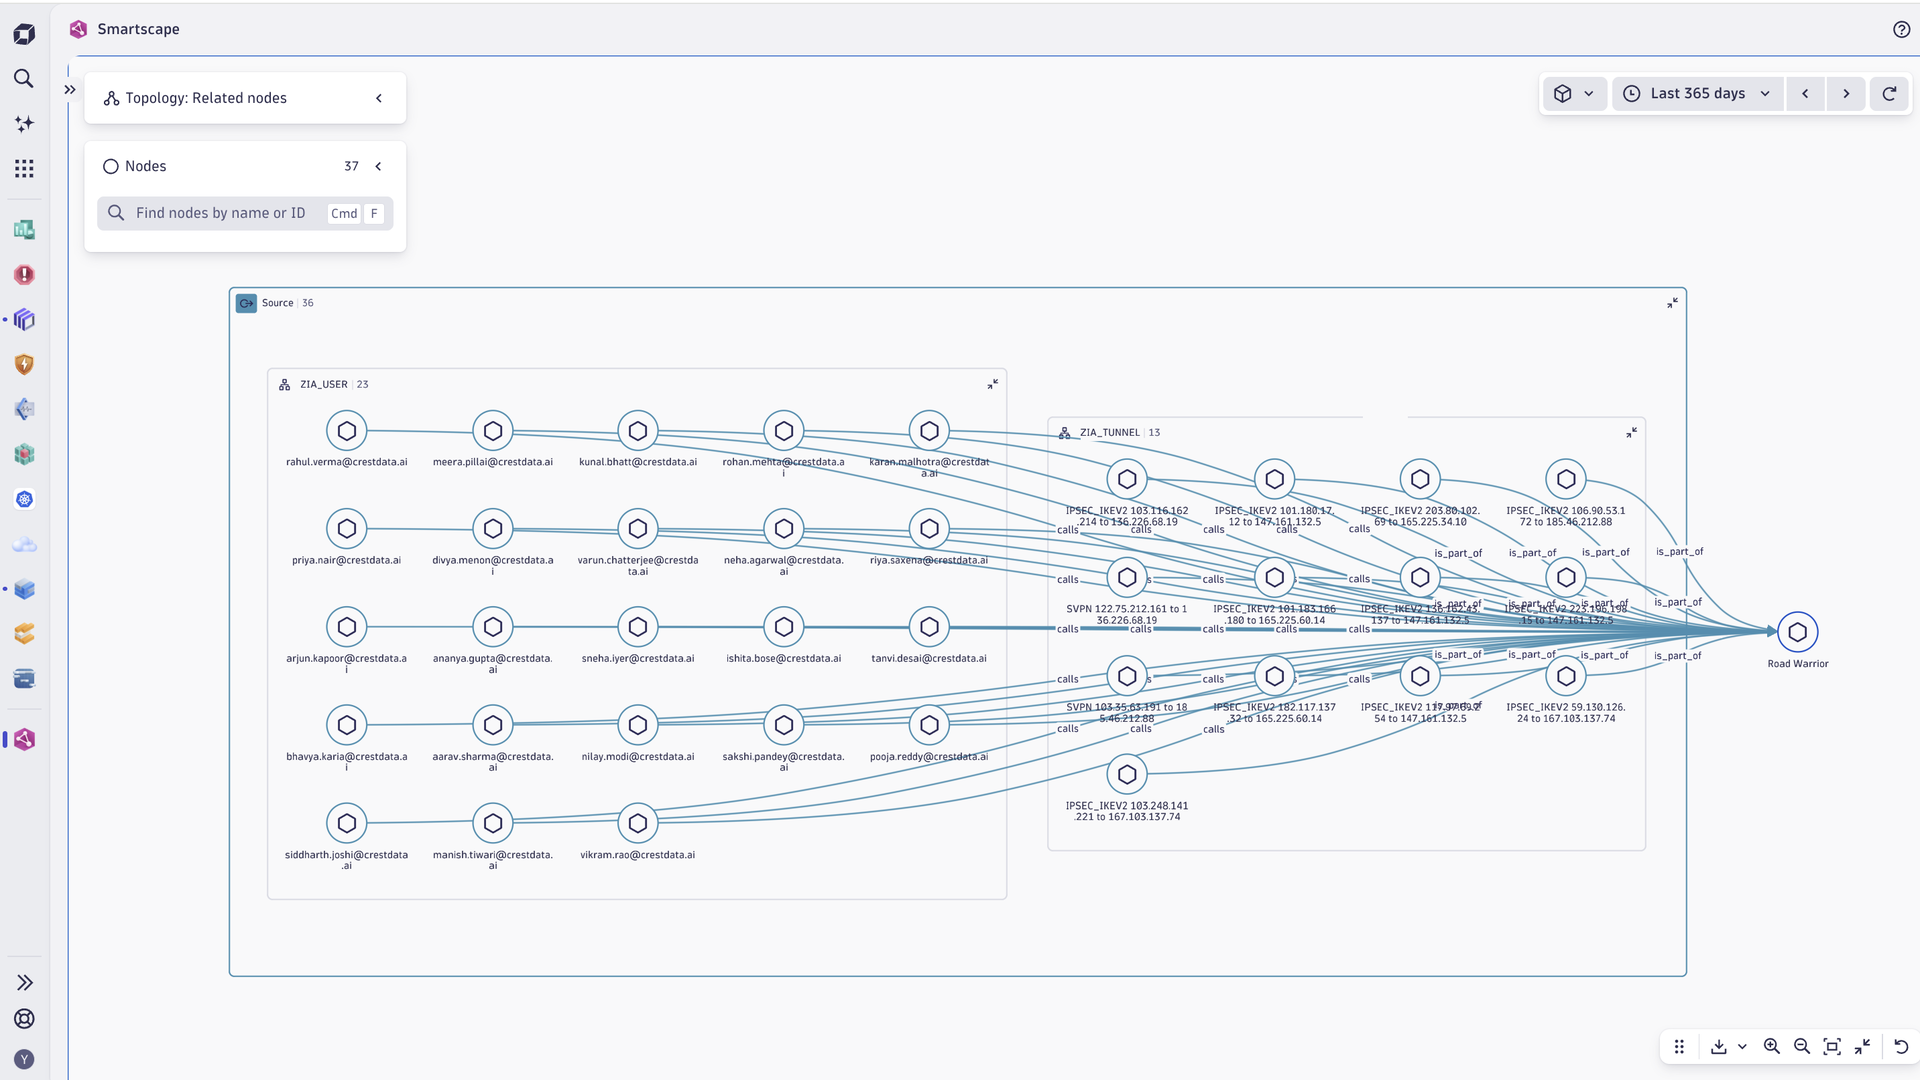
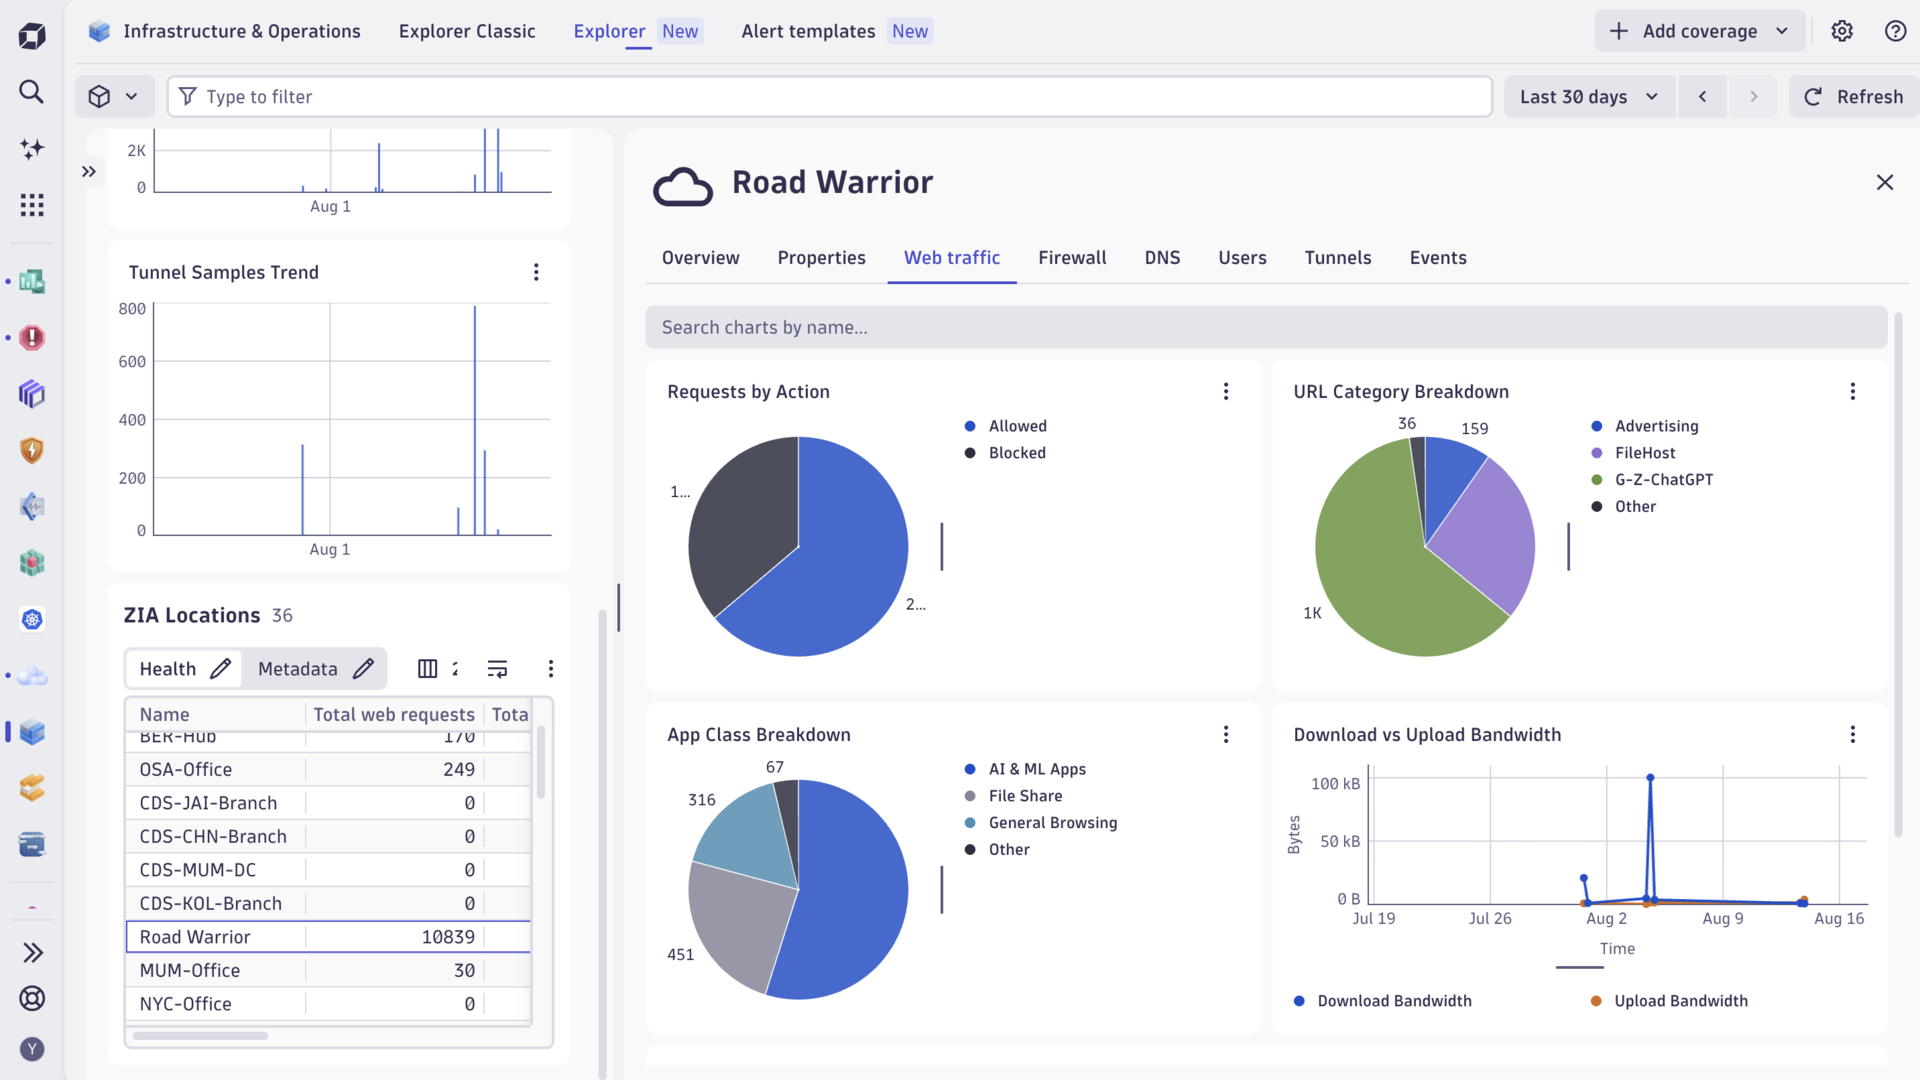
Zscaler ZIA DNS dashboardZscaler ZIA firewall dashboardZscaler ZIA smartscape exampleZscaler ZIA analysis screen example
  • Product information
  • Release notes

Overview

The Zscaler Internet Access extension turns Zscaler Internet Access NSS logs into a fully observable security and network dataset in Dynatrace. Zscaler streams its logs to Dynatrace through Cloud NSS Feeds (Nanolog Streaming Service); the extension extracts metrics, builds the Smartscape topology and enables analysis with ready-to-use dashboards**, unified analysis screens, and alerts.

Use cases

  • Secure Web Gateway visibility — see what users are browsing, catch blocked or risky web activity, and pinpoint slow or bandwidth-heavy traffic by location, user, or application.
  • Firewall and network analysis — understand what the firewall allows or blocks, which rules and network applications drive traffic, and spot capacity or bandwidth pressure per location.
  • DNS health — detect blocked or failing DNS lookups, slow name resolution, and the users or devices generating the most DNS traffic.
  • Tunnel monitoring — track GRE/IPSEC tunnel throughput and Dead Peer Detection activity to catch unstable tunnels before connectivity drops.
  • Admin audit and compliance — track who changed what, and spot spikes in failed admin actions that may signal misconfiguration or unauthorized access.
  • Topology-driven investigation — follow traffic across a live map of locations, users, and tunnels instead of scrolling through raw logs.

Get started

This extension relies on the ZIA NSS logs forwarding to Dynatrace. You can set it up in your ZIA Admin Console.

For step-by-step instructions on the installation and configuration on both Zscaler and Dynatrace sides, please see Zscaler Internet Access (ZIA) extension in the Dynatrace Documentation.

Details

The Zscaler Internet Access extension collects metrics and topology for:

  • ZIA Location
  • ZIA User
  • ZIA Tunnel

Metrics are extracted from the following NSS log feeds (enable them per feed as Cloud NSS Feeds in your ZIA tenant):

  • Web
  • Firewall
  • DNS
  • Tunnel
  • Admin Audit

The Zscaler Internet Access extension is packaged with per-log-type dashboards, unified analysis screens, and alert templates that serve as a starting point for data analysis.

Dynatrace
Documentation
By Dynatrace
Dynatrace support center
Subscribe to new releases
Copy to clipboard

Full version history

To have more information on how to install the downloaded package, please follow the instructions on this page.
ReleaseDate

Full version history

Initial release. Looking forward for your feedback via the Dynatrace Community!

Dynatrace Hub
Get data into DynatraceBuild your own app
Dynatrace Intelligence - Agentic Operations SystemThe Dynatrace Agentic AI ecosystem
All (922)Log Management and AnalyticsKubernetesAI and LLM ObservabilityInfrastructure ObservabilitySoftware DeliveryApplication ObservabilityApplication SecurityBusiness ObservabilityDigital Experience
Filter
Type
Built and maintained by
Partner FinderBecome a partnerDynatrace Developer

Discover recent additions to Dynatrace

Dynatrace Assist logo

Dynatrace Assist

Dynatrace Assist: Ask, analyze, and act with Dynatrace Intelligence.

Smartscape logo

Smartscape

Interactively explore and analyze topology and relationships in digital systems.

Compliance Assistant logo

Compliance Assistant

Track, manage, and automate compliance across your IT and business landscape.

Experience Vitals logo

Experience Vitals

Optimize UX with core vitals, frontend error tracking, and end-to-end visibility.

Error Inspector logo

Error Inspector

Discover, triage, and manage errors across all your frontends.

Users & Sessions logo

Users & Sessions

Discover how users and cohorts with common characteristics experience your app.

Analyze your data

Understand your data better with deep insights and clear visualizations.

Notebooks logo

Notebooks

Create powerful, data-driven documents for custom analytics and collaboration.

Dashboards logo

Dashboards

Transform complex data into clear visualizations with custom dashboards.

Investigations logo

Investigations

Fast and precise incident response on Grail data with DQL queries.

Smartscape logo

Smartscape

Interactively explore and analyze topology and relationships in digital systems.

Logs logo

Logs

Explore all your logs without writing a single query.

Problems logo

Problems

Detect, explain and triage problems automatically using Dynatrace Intelligence.

Automate your processes

Turn data and answers into actions, securely, and at scale.

Workflows logo

Workflows

Automate tasks in your IT landscape and move towards autonomous operations.

Jira logo

Jira

Open, update, and close Jira tickets automatically from Dynatrace Workflows.

Slack logo

Slack

Automate Slack messaging for security incidents, attacks, remediation, and more.

Secure your cloud application

See vulnerabilities and attacks in your environment.

Security Posture Management logo

Security Posture Management

Detect, prioritize, and remediate security and compliance findings with SPM.

Threats & Exploits logo

Threats & Exploits

Understand, triage, and investigate detection findings and alerts.

More resources

Cursor (Live-Debugger) logo

Cursor (Live-Debugger)

Get Real time Code-Level data directly to your Cursor IDE.

Documents logo

Documents

Manage Dashboards, Notebooks and other documents in your Dynatrace environment.

GitHub Copilot Coding Agent logo

GitHub Copilot Coding Agent

Automate vulnerability remediation and boost developer productivity.

GitHub Copilot Custom Agent logo

GitHub Copilot Custom Agent

Automate your development workflows with specialized agent definitions.

Dynatrace Live Debugger on JetBrains logo

Dynatrace Live Debugger on JetBrains

Get real-time code-level data directly to your Jetbrains IDE.

Metrics logo

Metrics

Browse, search, and manage all your metrics in one central catalog.

Pagerduty for Dynatrace Workflows logo

Pagerduty for Dynatrace Workflows

Streamline incident management with automated Pageruty workflows.

Dynatrace Live Debugger on Windsurf logo

Dynatrace Live Debugger on Windsurf

Get real-time code-level data directly to your Windsurf IDE.

Are you looking for something different?

We have hundreds of apps, extensions, and other technologies to customize your environment

Leverage our newest innovations of Dynatrace Saas

Kick-start your app creation

Kick-start your app creation

Whether you’re a beginner or a pro, Dynatrace Developer has the tools and support you need to create incredible apps with minimal effort.
Go to Dynatrace Developer

Upgrading from Dynatrace Managed to SaaS

Upgrading from Dynatrace Managed to SaaS

Drive innovation, speed, and agility in your organization by seamlessly and securely upgrading.
Learn More
Log Management and Analytics

Log Management and Analytics

Innovate faster and more efficiently with unified log management and log analytics for actionable insights and automation.
Learn more